Medical Device Coatings Market (2026 - 2035)

Medical Device Coatings Market Research Report Information By Chemistry (Parylene, Fluoropolymer, Silicone, Hydrogel, and Others (PU, Epoxy, Ceramic)), By Coating Function Type (Antimicrobial, Hydrophilic / Lubricious, Anti-thrombogenic, Drug-eluting, and Others (Anti-fog, Radiopaque)), By Deposition Technology (Plasma Spray, Chemical Vapor Deposition, Physical Vapor Deposition, Dip / Spray Coating, and Others (Electroplating, Sol-gel)), and By Application (Implants, Medical Devices, Surgical Instruments, Diagnostic Equipment, and Others) – Forecast Till 2035
ID: MRFR/CnM/1584-CR
111 Pages
Chitranshi Jaiswal
Last Updated: August 24, 2026
Medical Device Coatings Market
Market Size
Forecast Period2026-2035
CAGR (2026-2035)7.31%
2025 Market SizeUSD 12.48 Billion
2035 Market SizeUSD 25.17 Billion
Key Players
Surmodics, Inc.
Specialty Coating Systems
DSM Biomedical
Biocoat, Inc.
Hydromer Inc.
Harland Medical Systems
Opportunities
  • Dual-Function Surfaces Combining Lubricity and Antimicrobial Action
  • Asia-Pacific Localization and Domestic Substitution
  • Coating-as-a-Service and Outcome-Linked Contracting

Medical Device Coatings Market Summary

The Medical Device Coating Market was valued at USD 12.48 billion in 2025 and is projected to open the forecast window at USD 13.34 billion in 2026 before reaching USD 25.17 billion by 2035, expanding at a 7.31% CAGR. Two catalysts anchor that trajectory. The first is regulatory: the FDA's 2024 guidance tightening biocompatibility evidence requirements under ISO 10993-1 has pushed device OEMs to redesign surfaces rather than substrates [1]. The second is fiscal — the U.S. Centers for Medicare & Medicaid Services attributed roughly USD 28.4 billion in annual excess spending to device-associated infections, making surface chemistry a reimbursement issue, not a materials footnote [2].

Legacy solvent-cast silicone and dip-applied PTFE layers are being replaced by vapor-phase parylene, plasma-activated fluoropolymers and covalently bonded lubricious chemistries that withstand tortuous-path navigation without particulate shedding. Between 2023 and 2025, USD 3.1 billion in tracked venture and corporate financing poured into smart-implant and surface-engineering ventures [3]. The surface-performance clauses of Annex I of the EU Medical Device Regulation prompted re-validation of thousands of legacy coating dossiers [4].


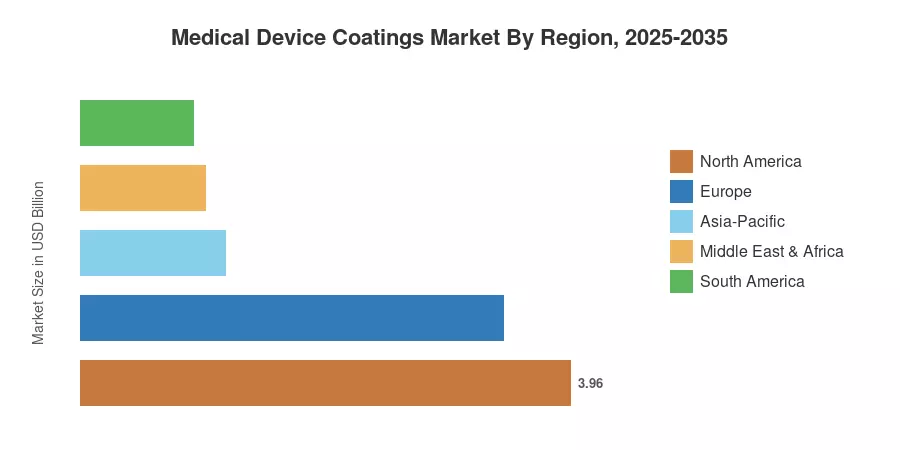
Revenue in North America is expected to be 31.7% of 2025 revenue, backed by dense catheter-lab volumes and a mature 510(k) process. Asia-Pacific compounds at the quickest rate of 9.39% through 2035 as China, India and South Korea increase tertiary surgical capacity. Europe comes next with a 27.4% share, as MDR compliance costs have resulted in supplier consolidation around larger validated providers. We are now entering a decade where surface performance, not device geometry, will be the major clinical differentiator in the Medical Device Coating Market.


Key Report Takeaways

• By Technology

  • Parylene chemistries hold 27.1% of Medical Device Coating Market revenue in 2025, reflecting their conformal pinhole-free barrier behavior on complex electronics.
  • Chemical vapor deposition advances at a 7.82% CAGR through 2035 as OEMs shift away from line-of-sight spray methods.
  • Fluoropolymer chemistries contributed USD 2.24 billion in 2025 revenue, driven by guidewire friction reduction.

• By Sector

  • Antimicrobial functional coatings captured 28.0% of 2025 revenue as hospital-acquired infection penalties widened.
  • Hydrophilic and lubricious systems grow at an 8.28% CAGR, the fastest functional category in the Medical Device Coating Market.
  • Implant applications generated USD 3.58 billion in 2025, led by orthopedic and cardiovascular platforms.

• By Geography

  • North America commands 31.7% of 2025 revenue
  • Asia-Pacific posts a 9.39% CAGR through 2035, the fastest of any region
  • Europe delivered USD 3.42 billion in 2025 revenue under MDR-driven requalification demand


Market Size and Forecast (2021–2035)

In the following, figures are reconciled from bottom-up device-unit modeling – catheter, stent, orthopedic implant and single-use instrument shipments – with top-down validation against coating-service revenue, as stated by contract applicators and specialized chemical suppliers. Historical years are based on audited filings and customs-level resin trade statistics. Forecast years are based on procedure-volume elasticity applied to demographic and surgical-capacity forecasts. The Medical Device Coating Market model was calibrated to regulatory clearance counts for FDA and EU notified bodies.
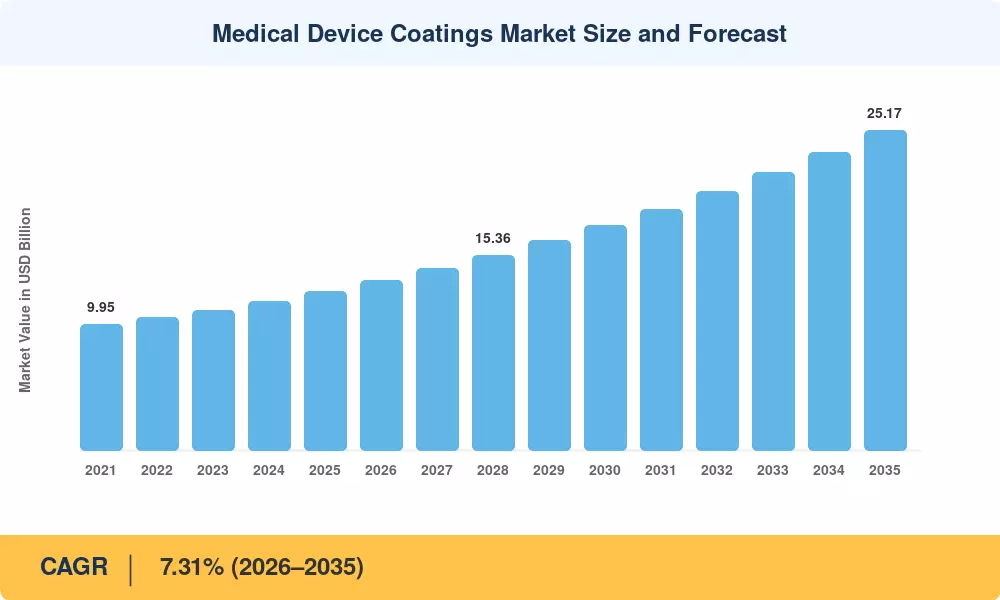
Medical Device Coatings Market Size and Forecast
Our Impact
Enabled $4.3B Revenue Impact for Fortune 500 and Leading Multinationals
Partnering with 2000+ Global Organizations Each Year
30K+ Citations by Top-Tier Firms in the Industry

Driver Impact Analysis

Driver ~% Impact on CAGR Geographic Relevance Impact Timeline
Hospital-acquired infection penalty regimes 1.6 North America, Europe Short-term (≤2 yr)
Minimally invasive procedure growth 1.5 Global Medium-term (2–4 yr)
Aging population and implant longevity demands 1.2 Japan, Europe, North America Long-term (≥4 yr)
Regulatory tightening on biocompatibility evidence 0.9 Global Medium-term (2–4 yr)
Asia-Pacific surgical infrastructure buildout 0.8 Asia-Pacific Long-term (≥4 yr)
Neurovascular and structural heart innovation 0.7 North America, Europe Medium-term (2–4 yr)
Single-use device conversion 0.6 Global Short-term (≤2 yr)


Infection Economics Reshape Procurement

Minimally Invasive Volumes Pull Lubricity Demand

Procedure mix has shifted decisively. Interventional cardiology, peripheral vascular and neurovascular caseloads grew at a compound 6.4% annually across OECD reporting countries between 2019 and 2024 [8], and each of those cases consumes guidewires, sheaths and microcatheters whose navigability depends on coefficient-of-friction performance below 0.03. Device engineers describe surface durability — particulate counts after 100 tortuous-path cycles — as the gating specification for regulatory clearance, a standard that eliminates most conventional dip-applied systems.

Demographics Extend Implant Service Life Expectations

Populations are aging into second and third revision surgeries. The United Nations projects the global cohort aged 65 and over will reach 1.6 billion by 2050 [9], and revision arthroplasty rates in registry data already run near 8.7% at ten years. Longer indwelling periods place osseointegration and anti-thrombogenic chemistries under sustained biological stress, pushing OEMs toward hydroxyapatite and heparin-conjugated surfaces validated for 15-year exposure rather than 5-year benchmarks.

Regulatory Evidence Burdens Favor Established Suppliers

Compliance has become a competitive moat. EU MDR requalification costs averaged EUR 1.4 million per legacy device family for mid-sized manufacturers [4], and FDA biocompatibility guidance now expects extractables and leachables characterization for coating layers previously treated as inert. Smaller applicators lacking ISO 13485-certified analytical capability have exited or been acquired, concentrating validated supply in fewer hands.


Restraints Impact Analysis

The restraint weightings below are directional drags on growth momentum, not subtractive terms applied to the headline rate. Several restraints interact — regulatory cost and raw-material substitution, for example, compound in the same product families. Analysts should read the table as a risk-ranking tool for the Medical Device Coating Market rather than a quantitative deduction.

Restraint ~% Drag on CAGR Geographic Relevance Impact Timeline
PFAS restriction and fluoropolymer substitution 0.9 Europe, North America Medium-term (2–4 yr)
Validation and requalification cost burden 0.7 Global Short-term (≤2 yr)
Raw material and specialty monomer price volatility 0.6 Global Short-term (≤2 yr)
Coating adhesion and delamination failure recalls 0.5 North America Medium-term (2–4 yr)
Pricing pressure from hospital consolidation 0.4 North America, Europe Long-term (≥4 yr)


PFAS Restrictions Threaten a Core Chemistry

Europe's proposed universal PFAS restriction, submitted by five national authorities to ECHA in 2023, would capture the fluoropolymer families underpinning roughly a fifth of device surface volume [7]. Medical derogations remain under discussion, but OEMs cannot design a ten-year platform around a derogation. Reformulation programs toward silicone-hybrid and polyurethane-based lubricious systems typically consume 18 to 30 months of bench and animal validation, deferring revenue and inflating development budgets by an estimated 12–18% per affected product line.

Validation Costs Squeeze Mid-Tier Manufacturers

Cost of compliance scales poorly for smaller portfolios. Notified body capacity constraints have produced review queues averaging 13 to 18 months in the EU [4], and every coating change — even a supplier-driven resin substitution — can trigger a significant-change assessment. Manufacturers report that combined analytical, biocompatibility and clinical evidence packages for a single coated catheter family now exceed USD 900,000, a threshold that discourages incremental innovation and slows adoption of otherwise superior chemistries.

Particulate Shedding Recalls Erode Clinical Confidence

Recall data keeps the risk visible. FDA enforcement records logged multiple Class I and Class II actions between 2023 and 2025 tied to hydrophilic layer separation on intravascular devices [15], with downstream embolic events driving both litigation exposure and specification conservatism. Purchasing committees have responded by demanding third-party particulate testing under ISO 11608 protocols, adding cost and lengthening qualification cycles for new entrants.


Medical Device Coatings Market Opportunities

Dual-Function Surfaces Combining Lubricity and Antimicrobial Action

Single-layer chemistries that deliver both low friction and sustained microbial kill represent the highest-value white space in the Medical Device Coating Market. Silver-ion and chlorhexidine-loaded hydrophilic matrices already show 4-log reductions over 14-day elution windows in published bench work [17], and consolidating two process steps into one reduces applicator cycle time by roughly a third. Suppliers who validate combination claims under a single regulatory submission will capture premium pricing in urology and central venous access.

Asia-Pacific Localization and Domestic Substitution

Import substitution policies are creating a genuine geographic gap. China's Volume-Based Procurement rounds have compressed device pricing while simultaneously favoring domestically manufactured components, and India's Production Linked Incentive scheme allocated INR 3,420 crore to medical device manufacturing clusters [10]. Coating suppliers establishing local ISO 13485 application sites — rather than exporting finished layers — gain tender eligibility that competitors cannot replicate through distribution alone.

Coating-as-a-Service and Outcome-Linked Contracting

Business model innovation is overdue here. Contract applicators are beginning to price on validated throughput and yield guarantees rather than per-liter chemistry sales, bundling process development, equipment leasing and lot-release testing into recurring contracts. Early adopters report gross margin expansion of 600 to 900 basis points versus product-only sales, and the model locks OEM customers into multi-year relationships that materially raise switching costs across the Medical Device Coating Market.

Surface Data Monetization Through Process Analytics

Every coating run generates plasma power, deposition rate, thickness uniformity and cure telemetry that most applicators discard. Suppliers instrumenting their lines can sell predictive yield analytics and audit-ready batch records back to OEMs — a package that shortens regulatory inspections and reduces scrap. Given that coating rework accounts for an estimated 4–7% of finished device cost in complex catheter builds [12], the analytics layer carries software-like margins on hardware-scale volumes.

Bioresorbable and Drug-Eluting Platform Extensions

Resorbable scaffolds and next-generation drug-eluting stents demand coatings that degrade on schedule without inflammatory residue. Polylactide and polyphosphazene carriers tuned for 90- to 180-day elution profiles are moving through clinical evaluation, and the structural heart pipeline alone represents more than 180 active trials globally [11]. Chemistry partners embedded early in these programs secure decade-long supply positions.


Medical Device Coatings Market Future Outlook

Machine Vision and Closed-Loop Process Control

Automation is arriving at the coating line. In-line optical coherence tomography and machine-vision thickness measurement now permit closed-loop adjustment of plasma power and dwell time within a single run, cutting scrap rates from typical 6–9% ranges toward 2%. As these systems mature, the Medical Device Coating Market will reward suppliers on documented process capability indices rather than chemistry claims, and OEM audits will increasingly interrogate control charts before formulations.

Smart Implants and Sensor-Integrated Surfaces

Instrumented orthopedic and cardiac implants require coatings that insulate electronics, permit wireless transmission and remain biocompatible for a decade. Parylene C and hybrid ceramic-polymer stacks are the leading candidates, and the pipeline is real — more than 180 structural heart and instrumented implant trials were active globally as of 2025 [11]. Success in this niche demands dielectric performance specifications that most conventional applicators cannot certify.

Sustainability Reporting Reaches the Coating Line

Scope 3 disclosure obligations under the EU Corporate Sustainability Reporting Directive now reach into device supply chains, and solvent-based application generates the bulk of a coated component's process emissions [20]. Water-based and vapor-phase alternatives reduce volatile organic compound output by 60–80%, converting an environmental metric into a commercial qualification. Purchasers at large hospital systems have begun requesting emissions data alongside biocompatibility files.

Supply Chain Regionalization After a Decade of Consolidation

Tariff exposure and pandemic-era disruption have persuaded OEMs to dual-source surface processing across continents. Analysts expect regional application capacity in Asia-Pacific and Latin America to roughly double by 2032, reducing single-site dependency that once concentrated more than half of global parylene throughput in a handful of facilities. This restructuring reshapes the competitive geography of the Medical Device Coating Market without materially altering total demand.


Medical Device Coatings Market Segmentation

Segment behavior across the Medical Device Coating Market reflects a shift from commodity barrier layers toward engineered multifunctional surfaces.

By Chemistry

Segment Metric (2025) Primary Demand Driver
Parylene 27.1% share Conformal dielectric protection for electronics
Fluoropolymer USD 2.24 billion Friction reduction on guidewires
Silicone 7.0% CAGR (2026–2035) Elastomeric sealing, tubing lubricity
Hydrogel 21.4% share Water-retentive lubricity on catheters
Others (PU, epoxy, ceramic) USD 1.86 billion Orthopedic osseointegration


Parylene retains leadership because nothing else deposits pinhole-free at room temperature onto irregular geometry. The chemistry's dominance in the Medical Device Coating Market is reinforced by neurostimulator and sensor applications where a single defect means device failure. Fluoropolymers hold second position on pure friction performance, though the PFAS overhang described in Section 5.1 has already redirected roughly a fifth of new formulation budgets toward silicone-hybrid substitutes [7]. Buyers evaluating long-cycle platforms should stress-test supplier substitution roadmaps before committing.

By Coating Function Type

Segment Metric (2025) Primary Demand Driver
Antimicrobial 28.0% share Infection penalty regimes
Hydrophilic / Lubricious 8.28% CAGR (2026–2035) Minimally invasive navigation
Anti-thrombogenic USD 1.84 billion Extracorporeal and vascular access
Drug-eluting 14.6% share Restenosis prevention
Others (anti-fog, radiopaque) USD 1.19 billion Visualization and imaging


Antimicrobial functionality leads on economics rather than technology novelty — the penalty math in Section 4.1 makes the business case self-evident. Lubricious systems grow fastest because procedure complexity keeps rising; each new neurovascular indication demands tighter friction and particulate specifications simultaneously. Suppliers report that dual-claim submissions combining both functions face longer review but command 25–40% price premiums once cleared [17].

By Deposition Technology

Segment Metric (2025) Primary Demand Driver
Plasma Spray 24.6% share Hydroxyapatite on orthopedic implants
Chemical Vapor Deposition 7.82% CAGR (2026–2035) Conformal coverage on complex geometry
Physical Vapor Deposition USD 2.31 billion Hard wear-resistant surfaces
Dip / Spray Coating 22.8% share High-volume catheter processing
Others (electroplating, sol-gel) USD 1.42 billion Specialty and hybrid applications


Deposition choice increasingly determines which OEMs a supplier can serve at all. Plasma spray retains scale in orthopedics, where bond strength above 22 MPa remains the qualifying threshold, while vapor-phase methods expand wherever line-of-sight limitations create coverage gaps. Capital intensity differentiates the two paths — a validated CVD chamber runs USD 1.2 to 2.8 million installed, which explains why the Medical Device Coating Market is consolidating around suppliers with balance sheets to fund capacity ahead of demand [6].

By Application

Segment Metric (2025) Primary Demand Driver
Implants USD 3.58 billion Osseointegration and long-term biostability
Medical Devices 7.58% CAGR (2026–2035) Single-use conversion, procedure growth
Surgical Instruments 17.0% share Reprocessing durability
Diagnostic Equipment USD 1.31 billion Optical clarity, biofouling resistance
Others 9.3% share Dental, veterinary, research use


Implants generate the largest revenue pool, but device applications compound faster as single-use conversion accelerates across endoscopy, urology and bronchoscopy. Reprocessing risk drives that shift — CDC guidance on duodenoscope contamination pushed several OEMs toward disposable designs entirely [13], and every disposable unit still requires a coated working channel. Buyers modeling the Medical Device Coating Market should weight unit volume growth more heavily than average selling price in this category.


Regional Market Share Analysis

Region Metric (2025) Primary Investment Themes
North America 31.7% share Infection-penalty compliance, neurovascular platforms
Europe USD 3.42 billion MDR requalification, PFAS substitution R&D
Asia-Pacific 9.39% CAGR (2026–2035) Capacity buildout, domestic substitution
South America USD 0.91 billion Public tender modernization, distributor consolidation
Middle East & Africa 8.12% CAGR (2026–2035) Hospital construction, medical tourism hubs
Total USD 12.48 billion

Regional performance in the Medical Device Coating Market diverges sharply by reimbursement architecture and surgical capacity. Mature markets grow on specification upgrades; emerging markets grow on procedure volume.


North America

Country Metric Key Driver
US 84.6% of regional revenue HAC Reduction Program penalties
Canada USD 0.38 billion Provincial procurement standardization
Mexico 7.9% CAGR (2026–2035) Nearshoring of device assembly


Regulatory gravity keeps North America dominant. FDA cleared more than 3,100 coated device submissions across the 510(k) and De Novo pathways between 2022 and 2025 [1], and the concentration of interventional cardiology and neurovascular innovation around Minneapolis, Irvine and Boston sustains dense applicator ecosystems. Mexican nearshoring adds a second dynamic: Tijuana and Guadalajara clusters now host coating lines serving U.S. OEMs under USMCA content rules, shifting a measurable slice of North American Medical Device Coating Market value southward without leaving the trade bloc.

Europe

Country Metric Key Driver
Germany 24.1% of regional revenue Orthopedic implant manufacturing base
UK USD 0.51 billion NHS infection-reduction targets
France 6.9% CAGR (2026–2035) Cardiovascular procedure expansion
Italy 11.3% of regional revenue Contract manufacturing density
Spain USD 0.26 billion Ambulatory surgical growth
Nordic Countries 7.4% CAGR (2026–2035) Registry-driven implant standards
Russia 3.8% of regional revenue Domestic production mandates
Rest of Europe USD 0.44 billion Eastern European capacity migration


Compliance defines the European story. MDR transition deadlines extended to 2027 and 2028 for legacy certificates bought manufacturers time but not relief, and notified body throughput remains the binding constraint [4]. German orthopedic OEMs have responded by internalizing hydroxyapatite plasma-spray capability rather than depending on external applicators. At the same time, the ECHA PFAS dossier has triggered parallel reformulation programs at nearly every major European coating supplier — an expensive hedge against a restriction that may take years to finalize.

Asia-Pacific

Country Metric Key Driver
China 38.2% of regional revenue Volume-Based Procurement localization
India 10.4% CAGR (2026–2035) Production Linked Incentive scheme
Japan USD 0.71 billion Aging population, revision surgery volume
South Korea 8.6% of regional revenue Aesthetic and dental implant exports
ASEAN USD 0.33 billion Medical tourism infrastructure
Rest of Asia-Pacific 8.9% CAGR (2026–2035) Tertiary hospital construction


Scale and policy converge across the region. China's centralized procurement rounds cut coronary stent prices by more than 90% from 2020 levels while expanding unit volumes several-fold, transferring value from device margin toward high-throughput surface processing [10]. India's incentive scheme and Japan's revision-surgery burden pull in different directions — cost-optimized volume versus premium longevity chemistry — yet both expand the addressable Medical Device Coating Market. Regional applicators increasingly compete on regulatory documentation quality rather than price alone.

South America

Country Metric Key Driver
Brazil 61.4% of regional revenue ANVISA harmonization, SUS tenders
Argentina USD 0.14 billion Private hospital investment
Rest of South America 7.6% CAGR (2026–2035) Andean procurement modernization


Public procurement drives the region. Brazil's Unified Health System accounts for roughly 70% of national device consumption, and ANVISA's alignment with IMDRF documentation standards has lowered entry barriers for internationally validated coating suppliers [18]. Currency volatility remains the sharper constraint — import-denominated chemistry costs swing double digits year to year, pushing OEMs toward regional formulation partnerships.

Middle East & Africa

Country Metric Key Driver
Saudi Arabia 34.8% of regional revenue Vision 2030 hospital construction
UAE USD 0.17 billion Medical tourism, private specialty centers
South Africa 8.4% CAGR (2026–2035) Public sector cardiac capacity
Egypt 9.1% of regional revenue Hepatitis and dialysis program scale
Rest of MEA USD 0.12 billion Donor-funded infrastructure


Infrastructure spending sets the pace here. Saudi Arabia's health sector transformation program committed more than USD 65 billion toward facility construction and localization through 2030 [19], with local-content requirements that favor suppliers willing to establish regional application capability. Egypt's dialysis and hepatology programs generate outsized demand for anti-thrombogenic surfaces on extracorporeal circuits, a niche where volume economics already justify local processing.


Medical Device Coatings Market By Region, 2025-2035

Competitive Benchmarking

Medical Device Coating Market Concentration is in the middle band. The estimated Herfindahl-Hirschman Index is between 780 and 940, and the top five suppliers account for 38–46% of worldwide revenue. Fragmentation persists at the regional applicator tier—several hundred ISO 13485-certified workshops service local OEMs—while innovation in chemistry is concentrated among a dozen enterprises with unique polymer platforms and regulatory master files. Acquisition activity has focused on buyers with validated capability, not new chemistry.

Company Est. Revenue Share Range Key Offerings for Medical Device Coating Market Strategic Positioning
Surmodics, Inc. ~11–14% Hydrophilic, drug-delivery, anti-thrombogenic platforms Chemistry licensor with regulatory master files
Specialty Coating Systems (KISCO) ~9–12% Parylene C, N, HT conformal deposition Global parylene capacity leader
DSM Biomedical (Covestro) ~7–10% Polyurethane, hydrophilic, biomedical polymers Materials science depth, EU-anchored
Biocoat, Inc. ~5–8% HYDAK hyaluronan-based lubricious systems Niche lubricity specialist, high margin
Hydromer Inc. ~4–6% Hydrophilic, antimicrobial, anti-fog coatings Contract development and formulation
Harland Medical Systems ~4–6% Coating equipment plus chemistry packages Integrated equipment-chemistry model
AST Products, Inc. ~3–5% LubriLAST hydrophilic, contact angle metrology Testing instrumentation adjacency
Covalon Technologies Ltd. ~3–5% Silver-based antimicrobial and collagen surfaces Infection-prevention focus
Precision Coating (Chase Corp.) ~3–5% PTFE, ETFE, parylene contract application High-volume contract applicator
Freudenberg Medical ~3–5% Silicone, hydrophilic, catheter processing Vertically integrated device manufacturing
Materion Corporation ~2–4% PVD thin films, optical and wear coatings Advanced materials, diagnostics exposure
Sono-Tek Corporation ~2–4% Ultrasonic spray coating systems for stents Equipment-led entry into drug-eluting


Recent News & Developments


  • ECHA (February 2023): Published the five-nation universal PFAS restriction proposal, opening consultation that placed fluoropolymer device chemistries under formal review and triggering industry-wide substitution planning [7]


  • FDA (January 2024): Issued updated biocompatibility assessment guidance referencing ISO 10993-1:2018, formalizing extractables expectations for surface layers previously treated as inert [1]


  • India Ministry of Chemicals & Fertilizers (August 2023): Approved additional Production Linked Incentive disbursements for medical device manufacturing clusters, drawing component and surface processing investment [10]


Medical Device Coatings Market Report Scope

Parameter Detail
Market Scope Global Medical Device Coating Market across chemistry, coating function type, deposition technology, application and geography
Study Period 2021–2035 (Historical 2021–2024; Base Year 2025; Forecast 2026–2035)
CAGR 7.31% (2026–2035)
Market Size Checkpoints USD 12.48 billion (2025); USD 13.34 billion (2026); USD 25.17 billion (2035)
Fastest Growing Segments Hydrophilic/Lubricious (function); Chemical Vapor Deposition (technology); Asia-Pacific (geography)
Companies Profiled 12 leading suppliers including Surmodics, Specialty Coating Systems, DSM Biomedical, Biocoat, Hydromer, Harland Medical Systems, AST Products, Covalon, Precision Coating, Freudenberg Medical, Materion, Sono-Tek
Valuation Currency USD Billion, constant 2025 exchange rates

FAQs

What contract structures should procurement teams negotiate when sourcing in the Medical Device Coating Market?
Multi-year agreements with volume-tiered pricing and guaranteed yield thresholds protect against capacity shortages. Include change-control clauses requiring supplier notification before any resin or process modification [4].
How should a device OEM decide between in-house application and contract coating?
In-house makes sense above roughly 500,000 annual units, where equipment amortization beats per-part service fees. Below that threshold, contract applicators deliver better regulatory documentation and faster chemistry iteration [12].
What technical due diligence matters most when qualifying a new supplier in the Medical Device Coating Market?
Request particulate counts after simulated-use cycling, adhesion data under ISO 10993 extraction conditions, and process capability indices from production lots. Audit the supplier's regulatory master file status before commercial commitment [1].
Which intellectual property risks are most common in surface chemistry sourcing?
Formulation patents frequently overlap with application-method claims, creating dual infringement exposure—secure written freedom-to-operate opinions covering both chemistry and deposition process before scaling production [21].
How does the Medical Device Coating Market treat sterilization compatibility?
Ethylene oxide and gamma irradiation degrade certain hydrophilic polymers differently, altering friction performance post-sterilization. Validation must test coated devices after the actual terminal sterilization cycle, never before [1].
What integration challenges arise when adding coatings to existing device platforms?
Masking complexity and fixture design typically consume more engineering time than chemistry selection. Retrofit programs frequently require tooling redesign that adds three to six months to launch timelines [6].
Are emerging non-fluorinated lubricious alternatives commercially ready?
Silicone-hybrid and hyaluronan-based systems now match fluoropolymer friction performance in bench testing but carry shorter clinical track records. Most OEMs are dual-qualifying rather than switching outright [7].      
Author
Author
Author Profile
Chitranshi Jaiswal LinkedIn
Team Lead - Research
Chitranshi is a Team Leader in the Chemicals & Materials (CnM) and Energy & Power (EnP) domains, with 6+ years of experience in market research. She leads and mentors teams to deliver cross-domain projects that equip clients with actionable insights and growth strategies. She is skilled in market estimation, forecasting, competitive benchmarking, and both primary & secondary research, enabling her to turn complex data into decision-ready insights. An engineer and MBA professional, she combines technical expertise with strategic acumen to solve dynamic market challenges. Chitranshi has successfully managed projects that support market entry, investment planning, and competitive positioning, while building strong client relationships. Certified in Advanced Excel & Power BI she leverages data-driven approaches to ensure accuracy, clarity, and impactful outcomes.

Research Approach


Secondary Research

The secondary research process involved comprehensive analysis of regulatory databases, peer-reviewed materials science and biomedical engineering journals, clinical publications, and authoritative health technology organizations. Key sources included the US Food & Drug Administration (FDA) Center for Devices and Radiological Health (CDRH), European Medicines Agency (EMA) Medical Device Coordination Group (MDCG), International Organization for Standardization (ISO 10993 & ISO 13485 standards), ASTM International (F04 Medical and Surgical Materials Committee), Advanced Medical Technology Association (AdvaMed), Medical Device Innovation Consortium (MDIC), National Institutes of Health (NIH) National Library of Medicine/NCBI (PubMed), Centers for Disease Control and Prevention (CDC) Healthcare-Associated Infection Data, World Health Organization (WHO) Medical Device Technical Series, Organization for Economic Cooperation and Development (OECD) Health Statistics, National Health Service (NHS) England Medical Device Registry, Japan Ministry of Health Labour and Welfare (MHLW) Medical Device Safety Information, and national competent authority databases from key markets (BfArM Germany, ANSM France, PMDA Japan). These sources were used to collect regulatory approval pathway data, biocompatibility safety studies, coating technology innovation trends, antimicrobial resistance surveillance, implantable device performance statistics, and reimbursement coding analysis for hydrophilic, drug-eluting, antimicrobial, and thromboresistant coating technologies.


Primary Research

To gather both qualitative and quantitative information, the primary research process involved interviewing players from both the supply and demand sides. Medical device coating manufacturers, chemical suppliers, and surface technology providers were among the supply-side sources, along with CEOs, VPs of R&D, heads of regulatory affairs, directors of coating technology, and business unit managers. On the demand side, we had healthcare system quality assurance directors, chiefs of cardiovascular surgery, orthopedic surgeons, interventional cardiologists, medical device procurement officers, supply chain directors from tier-1 device OEMs (e.g., stent manufacturers, orthopaedic implant companies), and so on. Timeliness of clinical efficacy trials, acceptance curves for coating technology, and information about raw material procurement dynamics, sterilization's effect on coating integrity, and material compatibility criteria were all verified by primary research.

Primary Respondent Breakdown:

• By Designation: C-level Primaries (40%), Director Level (25%), Others (35%)

• By Region: North America (38%), Europe (25%), Asia-Pacific (30%), Rest of World (7%)


Market Size Estimation

Global market valuation was derived through revenue triangulation and coating adoption rate analysis across implantable and non-implantable device categories. The methodology included:

• Identification of 50+ key coating technology providers and surface modification specialists across North America, Europe, Asia-Pacific, and Latin America

• Product mapping across antimicrobial coatings (silver ion, chlorhexidine, antibiotic-eluting), drug-eluting polymers (sirolimus, paclitaxel), hydrophilic coatings (polyvinylpyrrolidone, polyethylene glycol), and anti-thrombogenic surfaces (heparin-based, phosphorylcholine)

• Analysis of reported and modeled annual revenues specific to medical device coating portfolios, including OEM captive operations versus third-party coating service providers

• Coverage of manufacturers and contract coating service providers representing 75-80% of global market share in 2024

• Extrapolation using bottom-up (device procedure volume × coating penetration rate × ASP by coating type) and top-down (manufacturer revenue validation) approaches to derive segment-specific valuations for cardiovascular stents, orthopedic implants, neurological shunts, and catheter applications

Download Free Sample

Kindly complete the form below to receive a free sample of this Report

* Please use a valid business email

Download PDF ×

We do not share your information with anyone. However, we may send you emails based on your report interest from time to time. You may contact us at any time to opt-out.

















