Medical Foods Market (2026 - 2035)

ID: MRFR/MED/3484-CR
128 Pages
Vikita Thakur
Last Updated: July 12, 2026
Medical Foods Market Research Report Information By Nutritional Ingredients (Vitamins and Minerals, Proteins, Omega-3, Isoflavones, Phytosterols, and Others) by Route of Administration (Oral and Enteral) By Form (Pills, Powder, and Others) by Application (Chronic Kidney Disease, Nutritional Deficiency, Neurological & Psychological Disorders, Metabolic Disorders, Pain Management, Gastrointestinal Disorders, Orphan diseases, and Others) by Distribution Channel (E-commerce, Hospital Pharmacies, Retail Pharmacies, and Others), by Region (North America, Europe, Asia-Pacific, and Rest of the World) - Forecast till 2035
Medical Foods Market
Market Size
Forecast Period2026-2035
CAGR (2026-2035)5.48%
2025 Market SizeUSD 28.64 Billion
2035 Market SizeUSD 56.18 Billion
Key Players
Abbott Laboratories
Nestlé Health Science
Danone
Mead Johnson
Alfasigma
Primus Pharmaceuticals
Opportunities
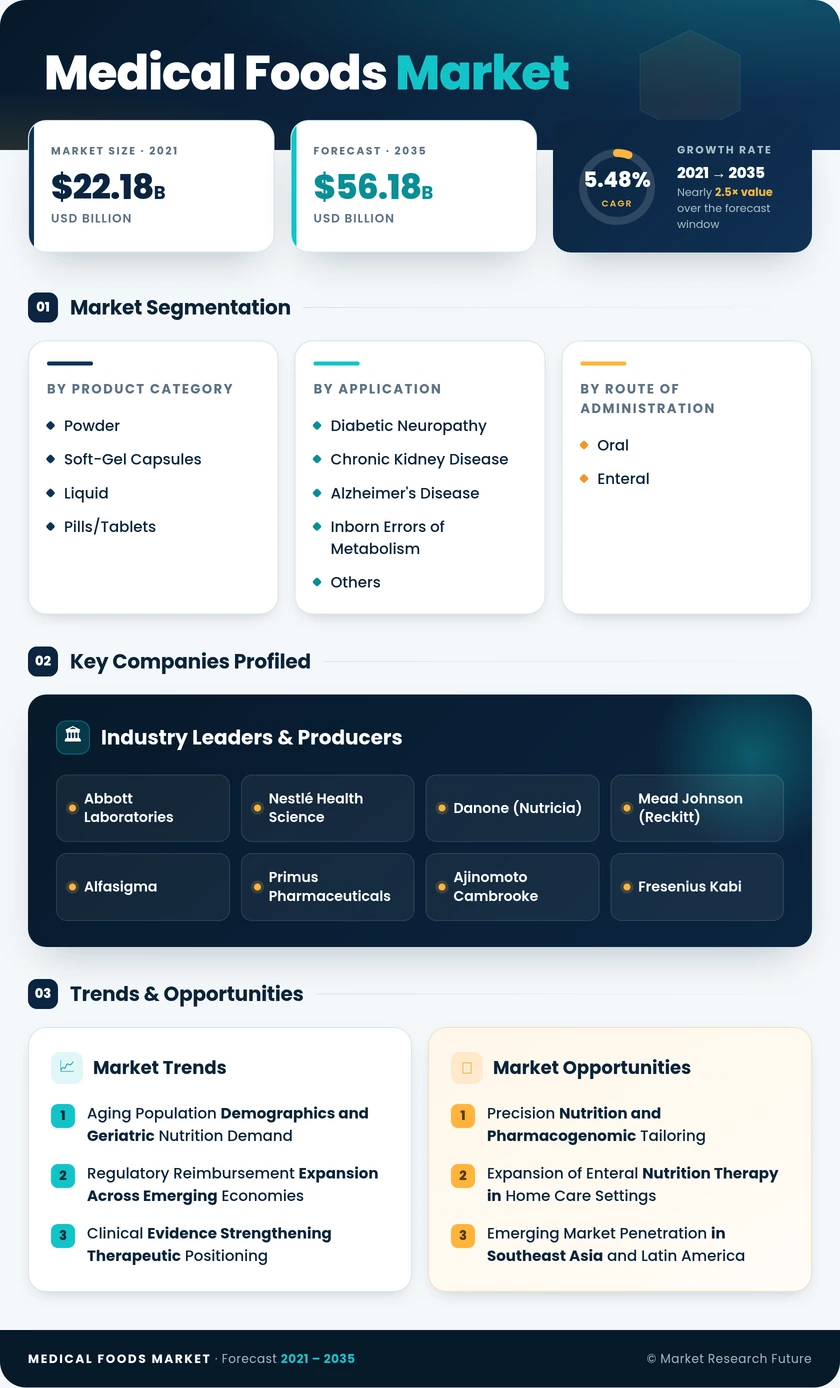
  • Precision Nutrition and Pharmacogenomic Tailoring
  • Expansion of Enteral Nutrition Therapy in Home Care Settings
  • Emerging Market Penetration in Southeast Asia and Latin America
  1. 1 Market Overview |
    1. 1.1 Study Assumptions & Market Definition |
    2. 1.2 Scope of the Study |
    3. 1.3 Research Methodology
  2. 2 Market Summary & Key Takeaways
  3. 3 Market Dynamics |
    1. 3.1 Market Drivers Analysis | |
      1. 3.1.1 Aging Population Demographics and Geriatric Nutrition Demand | |
      2. 3.1.2 Regulatory Reimbursement Expansion Across Emerging Economies | |
      3. 3.1.3 Clinical Evidence Strengthening Therapeutic Positioning | |
      4. 3.1.4 E-Commerce and Direct-to-Consumer Distribution | |
      5. 3.1.5 Soft-Gel Bioavailability Innovation | |
      6. 3.1.6 Hospital Formulary Standardization | |
      7. 3.1.7 Rise in Chronic Metabolic Disorders |
    2. 3.2 Market Restraints Analysis | |
      1. 3.2.1 Medicare Part B Coverage Gap in the United States | |
      2. 3.2.2 Payer Scrutiny Over Premium Ingredient Costs | |
      3. 3.2.3 Physician Awareness and Prescribing Gaps | |
      4. 3.2.4 Regulatory Fragmentation Across Jurisdictions | |
      5. 3.2.5 Patient Compliance and Palatability Challenges |
    3. 3.3 Market Opportunity Analysis | |
      1. 3.3.1 Precision Nutrition and Pharmacogenomic Tailoring | |
      2. 3.3.2 Expansion of Enteral Nutrition Therapy in Home Care Settings | |
      3. 3.3.3 Emerging Market Penetration in Southeast Asia and Latin America | |
      4. 3.3.4 Digital Therapeutics Integration and Subscription Models | |
      5. 3.3.5 Data Monetization Through Real-World Evidence Generation |
    4. 3.4 Industry Value Chain Analysis |
    5. 3.5 Porter's Five Forces Analysis
  4. 4 Global Medical Foods Market Size & Forecast (2021–2035) |
    1. 4.1 Historical Market Size (2021–2025) |
    2. 4.2 Current & Forecast Market Size (2026–2035) |
    3. 4.3 Market Size by Revenue (USD Billion) |
    4. 4.4 Year-over-Year Growth Analysis
  5. 5 Segmentation Analysis |
    1. 5.1 By Product Category | |
      1. 5.1.1 Powder | |
      2. 5.1.2 Soft-Gel Capsules | |
      3. 5.1.3 Liquid | |
      4. 5.1.4 Pills/Tablets |
    2. 5.2 By Application | |
      1. 5.2.1 Diabetic Neuropathy | |
      2. 5.2.2 Chronic Kidney Disease | |
      3. 5.2.3 Alzheimer's Disease | |
      4. 5.2.4 Inborn Errors of Metabolism | |
      5. 5.2.5 Other Applications |
    3. 5.3 By Route of Administration | |
      1. 5.3.1 Oral | |
      2. 5.3.2 Enteral |
    4. 5.4 By Patient Group | |
      1. 5.4.1 Geriatric | |
      2. 5.4.2 Adult | |
      3. 5.4.3 Pediatric |
    5. 5.5 By Distribution Channel | |
      1. 5.5.1 Hospital Pharmacy | |
      2. 5.5.2 Retail Pharmacy | |
      3. 5.5.3 Online Pharmacy
  6. 6 Regional Analysis |
    1. 6.1 North America | |
      1. 6.1.1 United States | |
      2. 6.1.2 Canada | |
      3. 6.1.3 Mexico |
    2. 6.2 Europe | |
      1. 6.2.1 Germany | |
      2. 6.2.2 United Kingdom | |
      3. 6.2.3 France | |
      4. 6.2.4 Italy | |
      5. 6.2.5 Spain | |
      6. 6.2.6 Nordic Countries | |
      7. 6.2.7 Russia | |
      8. 6.2.8 Rest of Europe |
    3. 6.3 Asia-Pacific | |
      1. 6.3.1 China | |
      2. 6.3.2 India | |
      3. 6.3.3 Japan | |
      4. 6.3.4 South Korea | |
      5. 6.3.5 ASEAN | |
      6. 6.3.6 Rest of Asia-Pacific |
    4. 6.4 South America | |
      1. 6.4.1 Brazil | |
      2. 6.4.2 Argentina | |
      3. 6.4.3 Rest of South America |
    5. 6.5 Middle East & Africa | |
      1. 6.5.1 Saudi Arabia | |
      2. 6.5.2 UAE | |
      3. 6.5.3 South Africa | |
      4. 6.5.4 Egypt | |
      5. 6.5.5 Rest of MEA
  7. 7 Competitive Landscape |
    1. 7.1 Market Share Analysis (2025) |
    2. 7.2 Competitive Benchmarking Matrix |
    3. 7.3 Company Profiles | |
      1. 7.3.1 Abbott Laboratories | |
      2. 7.3.2 Nestlé Health Science | |
      3. 7.3.3 Danone (Nutricia) | |
      4. 7.3.4 Mead Johnson (Reckitt) | |
      5. 7.3.5 Alfasigma | |
      6. 7.3.6 Primus Pharmaceuticals | |
      7. 7.3.7 Ajinomoto Cambrooke | |
      8. 7.3.8 Fresenius Kabi | |
      9. 7.3.9 Meiji Holdings | |
      10. 7.3.10 Perrigo Company
  8. 8 Future Outlook & Strategic Recommendations (2026–2035) |
    1. 8.1 AI-Driven Personalization and Predictive Nutrition |
    2. 8.2 Platform Economics and Integrated Care Models |
    3. 8.3 Sustainability and Clean-Label Reformulation |
    4. 8.4 Regulatory Convergence and Global Harmonization
  9. 9 Recent Developments & News
  10. 10 Frequently Asked Questions (FAQs)
  11. 11 Report Scope & Methodology |
    1. 11.1 Study Period & Base Year |
    2. 11.2 Data Sources & Citations |
    3. 11.3 Abbreviations
  12. 12 LIST OF TABLES |
  13. TABLE 1 Global Medical Foods Market Size & Forecast, by Revenue (USD Billion), 2021–2035 |
  14. TABLE 2 Global Medical Foods Market – Year-over-Year Growth Analysis, 2021–2035 |
  15. TABLE 3 Global Medical Foods Market – Driver Impact Analysis, 2026–2035 |
  16. TABLE 4 Global Medical Foods Market – Restraint Impact Analysis, 2026–2035 |
  17. TABLE 5 Global Medical Foods Market Size, by Product Category, 2021–2035 (USD Billion) |
  18. TABLE 6 Global Medical Foods Market Size, by Application, 2021–2035 (USD Billion) |
  19. TABLE 7 Global Medical Foods Market Size, by Route of Administration, 2021–2035 (USD Billion) |
  20. TABLE 8 Global Medical Foods Market Size, by Patient Group, 2021–2035 (USD Billion) |
  21. TABLE 9 Global Medical Foods Market Size, by Distribution Channel, 2021–2035 (USD Billion) |
  22. TABLE 10 Global Medical Foods Market Size, by Region, 2021–2035 (USD Billion) |
  23. TABLE 11 North America Medical Foods Market Size, by Country, 2021–2035 (USD Billion) |
  24. TABLE 12 Europe Medical Foods Market Size, by Country, 2021–2035 (USD Billion) |
  25. TABLE 13 Asia-Pacific Medical Foods Market Size, by Country, 2021–2035 (USD Billion) |
  26. TABLE 14 South America Medical Foods Market Size, by Country, 2021–2035 (USD Billion) |
  27. TABLE 15 Middle East & Africa Medical Foods Market Size, by Country, 2021–2035 (USD Billion) |
  28. TABLE 16 Competitive Benchmarking Matrix – Global Medical Foods Market, 2025 |
  29. TABLE 17 Company Profiles – Key Players, Global Medical Foods Market |
  30. TABLE 18 Recent Developments & Strategic Announcements, 2023–2025 |
  31. TABLE 19 North America Medical Foods Market Size, by Product Category, 2021–2035 (USD Billion) |
  32. TABLE 20 North America Medical Foods Market Size, by Application, 2021–2035 (USD Billion) |
  33. TABLE 21 North America Medical Foods Market Size, by Route of Administration, 2021–2035 (USD Billion) |
  34. TABLE 22 North America Medical Foods Market Size, by Patient Group, 2021–2035 (USD Billion) |
  35. TABLE 23 North America Medical Foods Market Size, by Distribution Channel, 2021–2035 (USD Billion) |
  36. TABLE 24 Europe Medical Foods Market Size, by Product Category, 2021–2035 (USD Billion) |
  37. TABLE 25 Europe Medical Foods Market Size, by Application, 2021–2035 (USD Billion) |
  38. TABLE 26 Europe Medical Foods Market Size, by Route of Administration, 2021–2035 (USD Billion) |
  39. TABLE 27 Europe Medical Foods Market Size, by Patient Group, 2021–2035 (USD Billion) |
  40. TABLE 28 Europe Medical Foods Market Size, by Distribution Channel, 2021–2035 (USD Billion) |
  41. TABLE 29 Asia-Pacific Medical Foods Market Size, by Product Category, 2021–2035 (USD Billion) |
  42. TABLE 30 Asia-Pacific Medical Foods Market Size, by Application, 2021–2035 (USD Billion) |
  43. TABLE 31 Asia-Pacific Medical Foods Market Size, by Route of Administration, 2021–2035 (USD Billion) |
  44. TABLE 32 Asia-Pacific Medical Foods Market Size, by Patient Group, 2021–2035 (USD Billion) |
  45. TABLE 33 Asia-Pacific Medical Foods Market Size, by Distribution Channel, 2021–2035 (USD Billion) |
  46. TABLE 34 South America Medical Foods Market Size, by Product Category, 2021–2035 (USD Billion) |
  47. TABLE 35 South America Medical Foods Market Size, by Application, 2021–2035 (USD Billion) |
  48. TABLE 36 South America Medical Foods Market Size, by Route of Administration, 2021–2035 (USD Billion) |
  49. TABLE 37 South America Medical Foods Market Size, by Patient Group, 2021–2035 (USD Billion) |
  50. TABLE 38 South America Medical Foods Market Size, by Distribution Channel, 2021–2035 (USD Billion) |
  51. TABLE 39 Middle East & Africa Medical Foods Market Size, by Product Category, 2021–2035 (USD Billion) |
  52. TABLE 40 Middle East & Africa Medical Foods Market Size, by Application, 2021–2035 (USD Billion) |
  53. TABLE 41 Middle East & Africa Medical Foods Market Size, by Route of Administration, 2021–2035 (USD Billion) |
  54. TABLE 42 Middle East & Africa Medical Foods Market Size, by Patient Group, 2021–2035 (USD Billion) |
  55. TABLE 43 Middle East & Africa Medical Foods Market Size, by Distribution Channel, 2021–2035 (USD Billion) |
  56. TABLE 44 Report Scope & Methodology Summary |
  57. TABLE 45 Detailed Sources and Citations
  58. 13 LIST OF FIGURES |
  59. FIGURE 1 Global Medical Foods Market Dynamics – Drivers, Restraints, and Opportunities |
  60. FIGURE 2 Industry Value Chain Analysis – Medical Foods Market |
  61. FIGURE 3 Porter's Five Forces Analysis – Medical Foods Market |
  62. FIGURE 4 Global Medical Foods Market Size Trend (USD Billion), 2021–2035 |
  63. FIGURE 5 Global Medical Foods Market Share, by Product Category, 2025 |
  64. FIGURE 6 Global Medical Foods Market Share, by Application, 2025 |
  65. FIGURE 7 Global Medical Foods Market Share, by Route of Administration, 2025 |
  66. FIGURE 8 Global Medical Foods Market Share, by Patient Group, 2025 |
  67. FIGURE 9 Global Medical Foods Market Share, by Distribution Channel, 2025 |
  68. FIGURE 10 Global Medical Foods Market Share, by Region, 2025 |
  69. FIGURE 11 North America Medical Foods Market Size Trend, 2021–2035 |
  70. FIGURE 12 Europe Medical Foods Market Size Trend, 2021–2035 |
  71. FIGURE 13 Asia-Pacific Medical Foods Market Size Trend, 2021–2035 |
  72. FIGURE 14 South America Medical Foods Market Size Trend, 2021–2035 |
  73. FIGURE 15 Middle East & Africa Medical Foods Market Size Trend, 2021–2035 |
  74. FIGURE 16 Competitive Landscape – Market Share Distribution, 2025 |
  75. FIGURE 17 Competitive Benchmarking Radar Chart – Top 10 Players

Segmentation Quick Reference

DimensionSub-SegmentsDominant SegmentFastest Growing Segment
Product CategoryPowder, Soft-Gel Capsules, Liquid, Pills/TabletsPowderSoft-Gel Capsules
ApplicationDiabetic Neuropathy, Chronic Kidney Disease, Alzheimer's Disease, Inborn Errors of Metabolism, OthersDiabetic NeuropathyChronic Kidney Disease
Route of AdministrationOral, EnteralOralEnteral
Patient GroupGeriatric, Adult, PediatricGeriatricPediatric
Distribution ChannelHospital Pharmacy, Retail Pharmacy, Online PharmacyHospital PharmacyOnline Pharmacy
GeographyNorth America, Europe, Asia-Pacific, South America, Middle East & AfricaNorth AmericaAsia-Pacific


Market Segmentation Overview

By Product Category

Sub-SegmentKey Trend
PowderHospital bulk procurement drives volume; cost-per-serving advantage over liquids
Soft-Gel CapsulesLipid-based delivery enhancing fat-soluble nutrient bioavailability
LiquidReady-to-consume convenience for geriatric and pediatric patients
Pills/TabletsAmbulatory convenience for chronic condition management


Powder formulations continue to dominate due to their flexibility in clinical settings and favorable economics for institutional buyers. Soft-gel capsules are attracting R&D investment as manufacturers seek differentiated delivery mechanisms for neurological and metabolic disorder applications.

By Application

Sub-SegmentKey Trend
Diabetic NeuropathyB-vitamin complex formulations targeting nerve function restoration
Chronic Kidney DiseaseProtein-restricted, phosphorus-managed formulas per nephrology guidelines
Alzheimer's DiseaseMulti-nutrient combinations (Souvenaid-type) targeting synaptic function
Inborn Errors of MetabolismAmino acid-modified formulas for PKU, MSUD, and related conditions
Other ApplicationsOncology malnutrition, IBD, and post-surgical recovery nutrition


Diabetic neuropathy leads by revenue share, reflecting the global scale of Type 2 diabetes. Chronic kidney disease is the fastest-growing application as renal societies worldwide endorse medical nutrition therapy as standard care.

By Route of Administration

Sub-SegmentKey Trend
OralDominant format for ambulatory and home-based chronic disease management
EnteralGrowing in ICU and long-term care through tube-feeding standardization


Oral delivery accounts for nearly two-thirds of consumption, though enteral administration is growing faster as home enteral nutrition programs expand across developed markets.

By Patient Group

Sub-SegmentKey Trend
GeriatricLargest cohort; sarcopenia and cognitive decline driving multi-nutrient demand
AdultWorking-age diabetes and CKD management expanding addressable market
PediatricNewborn screening programs accelerating early intervention with specialized formulas


Geriatric patients represent over half of market volume. Pediatric formulations are the fastest-growing cohort due to expanded metabolic screening at birth.

By Distribution Channel

Sub-SegmentKey Trend
Hospital PharmacyFormulary gatekeeping controls institutional product selection
Retail PharmacyWalk-in prescription fulfillment for chronic maintenance patients
Online PharmacyDTC subscription models and telehealth integration driving rapid growth


Hospital pharmacies control the majority of distribution, but online channels are eroding this dominance through direct-to-patient convenience and algorithmic prescription matching.


Download PDF ×

We do not share your information with anyone. However, we may send you emails based on your report interest from time to time. You may contact us at any time to opt-out.