Download Free Sample
Kindly complete the form below to receive a free sample of this Report
Medical Waste Management Services Market Research Report By End Use (Hospitals, Clinics, Laboratories, Pharmacies, Research Institutions), By Waste Type (Non-Hazardous Waste, Hazardous Waste, Infectious Waste, Pathological Waste, Sharps Waste), By Application (Biomedical Waste, Pharmaceutical Waste, Chemical Waste, Sharps Waste, Radioactive Waste), By Service Type (Collection Services, Transportation Services, Treatment Services, Disposal Services, Consultation Services), By Regulatory Compliance (Local Regulations, National Regulations, International Standards, Environmental Guidelines, Health and Safety Regulations) And By Region (North America, Europe, Asia-Pacific, And Rest Of The World) – Market Forecast Till 2035.
As per MRFR analysis, the Medical Waste Management Services Market was estimated at 15.5 USD Billion in 2024. The Medical Waste Management Services industry is projected to grow from 16.19 USD Billion in 2025 to 25.0 USD Billion by 2035, exhibiting a compound annual growth rate (CAGR) of 4.44% during the forecast period 2025 - 2035.
The Medical Waste Management Services Market is poised for substantial growth driven by regulatory compliance and technological advancements.
| 2024 Market Size | 15.5 (USD Billion) |
| 2035 Market Size | 25.0 (USD Billion) |
| CAGR (2025 - 2035) | 4.44% |
Stericycle (US), Waste Management (US), Veolia (FR), Clean Harbors (US), Republic Services (US), SUEZ (FR), MedPro Disposal (US), BioMedical Waste Solutions (US), Corteva (US)
Our Impact
Enabled $4.3B Revenue Impact for Fortune 500 and Leading Multinationals
Partnering with 2000+ Global Organizations Each Year
30K+ Citations by Top-Tier Firms in the Industry
The Medical Waste Management Services Market is currently experiencing a notable evolution, driven by increasing awareness regarding the environmental and health implications of improper waste disposal. Stakeholders across various sectors, including healthcare facilities, laboratories, and pharmaceutical companies, are recognizing the necessity of effective waste management strategies. This shift is likely influenced by stringent regulations and guidelines aimed at ensuring safe disposal practices. As a result, the market is witnessing a surge in demand for specialized services that cater to the unique needs of medical waste disposal, treatment, and recycling. Furthermore, advancements in technology are facilitating more efficient waste management solutions, which may enhance operational efficiency and compliance with regulatory standards. In addition, the growing emphasis on sustainability is prompting organizations to adopt eco-friendly practices in their waste management processes. This trend appears to be fostering innovation in waste treatment technologies, such as the development of alternative disposal methods that minimize environmental impact. The Medical Waste Management Services Market is thus positioned for growth, as companies strive to align their operations with evolving environmental standards and consumer expectations. Overall, the market landscape is characterized by a dynamic interplay of regulatory pressures, technological advancements, and a heightened focus on sustainability, which collectively shape the future of medical waste management services.
The Medical Waste Management Services Market is increasingly influenced by stringent regulations and standards imposed by governmental bodies. These regulations aim to ensure safe handling, treatment, and disposal of medical waste, compelling organizations to adopt compliant practices. As a result, service providers are enhancing their offerings to meet these evolving requirements, which may lead to improved safety and environmental outcomes.
Innovations in technology are playing a pivotal role in transforming the Medical Waste Management Services Market. The emergence of advanced waste treatment solutions, such as automated sorting systems and environmentally friendly disposal methods, is likely to enhance operational efficiency. These advancements may also facilitate better tracking and reporting of waste management processes, ensuring compliance with regulatory mandates.
There is a growing trend towards sustainability within the Medical Waste Management Services Market, as organizations seek to minimize their environmental footprint. This shift is prompting the adoption of eco-friendly waste management practices, including recycling and waste-to-energy conversion. Such initiatives not only align with regulatory expectations but also resonate with the increasing consumer demand for environmentally responsible practices.
The Medical Waste Management Services Market is significantly influenced by stringent regulatory frameworks governing waste disposal practices. Governments and health authorities have established comprehensive regulations to mitigate the risks associated with improper medical waste disposal. These regulations often mandate specific treatment and disposal methods, compelling healthcare providers to engage professional waste management services. For instance, the World Health Organization has outlined guidelines that emphasize the importance of safe waste management practices. As compliance becomes increasingly critical, healthcare facilities are likely to invest in specialized services to avoid penalties and ensure adherence to legal requirements. This trend suggests a robust growth trajectory for the Medical Waste Management Services Market, as regulatory pressures drive demand for expert waste management solutions.
The proliferation of healthcare facilities, including hospitals, clinics, and laboratories, is a primary driver of the Medical Waste Management Services Market. As the number of healthcare establishments rises, so does the volume of medical waste generated. According to recent estimates, the healthcare sector produces approximately 5.9 million tons of medical waste annually. This surge necessitates efficient waste management solutions to ensure compliance with regulations and to protect public health. The growing demand for medical waste management services is further fueled by the need for specialized disposal methods that adhere to stringent safety standards. Consequently, the expansion of healthcare facilities is likely to bolster the Medical Waste Management Services Market, as these establishments seek reliable partners to manage their waste responsibly.
The escalating demand for safe disposal methods is a crucial driver of the Medical Waste Management Services Market. With the increasing volume of hazardous medical waste generated by healthcare facilities, there is a pressing need for effective disposal solutions that mitigate health risks. Healthcare providers are increasingly recognizing the importance of engaging specialized waste management services to ensure the safe handling and disposal of their waste. This demand is further amplified by the potential health hazards associated with improper waste disposal, which can lead to infections and environmental contamination. As awareness of these risks grows, healthcare facilities are likely to prioritize partnerships with waste management companies that offer comprehensive and safe disposal methods. This trend indicates a promising outlook for the Medical Waste Management Services Market, as the need for safe waste management solutions continues to rise.
There is a rising awareness regarding the environmental impact of medical waste, which serves as a significant driver for the Medical Waste Management Services Market. Stakeholders, including healthcare providers and patients, are becoming increasingly conscious of the ecological consequences of improper waste disposal. This awareness has led to a demand for sustainable waste management practices that minimize environmental harm. Many healthcare facilities are now seeking services that not only comply with regulations but also promote eco-friendly disposal methods. The shift towards sustainability is reflected in the growing preference for waste management companies that utilize green technologies and practices. As environmental considerations gain prominence, the Medical Waste Management Services Market is likely to expand, driven by the need for responsible waste management solutions.
Technological advancements play a pivotal role in shaping the Medical Waste Management Services Market. Innovations such as advanced sterilization techniques, waste tracking systems, and automated disposal solutions enhance the efficiency and safety of medical waste management. For example, the adoption of microwave and chemical treatment technologies has been shown to reduce the volume of waste while ensuring effective pathogen destruction. Furthermore, the integration of digital solutions for waste tracking allows healthcare facilities to monitor their waste generation and disposal processes in real-time. This not only improves operational efficiency but also aids in compliance with regulatory standards. As technology continues to evolve, it is expected that the Medical Waste Management Services Market will experience increased demand for innovative solutions that address the complexities of waste management.
In the Medical Waste Management Services Market, Biomedical Waste holds the largest market share, significantly contributing to overall market dynamics. This segment includes waste produced from healthcare activities, such as hospitals, clinics, and laboratories, which necessitates careful handling and disposal. Following closely, Sharps Waste represents a rapidly growing segment, reflecting the increasing focus on safety in medical practices and the rise in procedures that generate sharps, such as syringes and other pointed instruments.
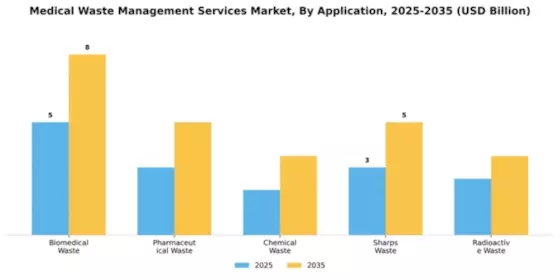
Biomedical Waste (Dominant) vs. Sharps Waste (Emerging)
Biomedical Waste is characterized by its substantial quantity generated in healthcare settings, necessitating specialized collection, treatment, and disposal methods to mitigate environmental and health risks. This segment is marked by stringent regulations and guidelines to ensure safe handling, establishing its dominant position in the market. Meanwhile, Sharps Waste has emerged as a growing concern, prompted by enhanced awareness over safety protocols and incidences related to improper disposal. With the introduction of innovative collection devices and safe disposal solutions, the Sharps Waste segment is gaining momentum, positioned to expand rapidly in response to evolving healthcare standards.
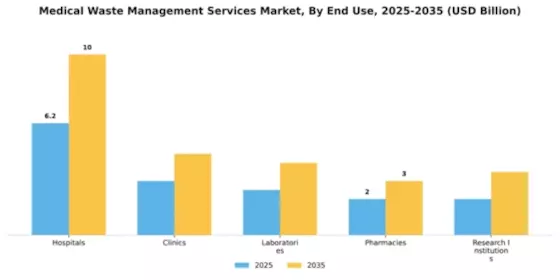
In the Medical Waste Management Services Market, hospitals represent the largest segment due to their extensive operations and significant waste generation. They are responsible for unique waste types, including hazardous and non-hazardous materials, resulting in a substantial requirement for efficient waste disposal services. Following hospitals, clinics have emerged as a rapidly growing segment, driven by the increasing prevalence of outpatient services and vaccinations, leading to an increase in medical waste generation requiring management.
Hospitals (Dominant) vs. Clinics (Emerging)
Hospitals dominate the Medical Waste Management Services Market primarily because of the high volume and diverse types of waste they produce. They generate waste that necessitates specialized management practices, such as biohazard disposal and incineration protocols. On the other hand, clinics are rapidly emerging due to a rising trend towards outpatient care, which increases their waste output. This evolving landscape indicates a shift in focus towards more compact and mobile waste management solutions tailored for clinic settings, strategically addressing their unique waste disposal needs.
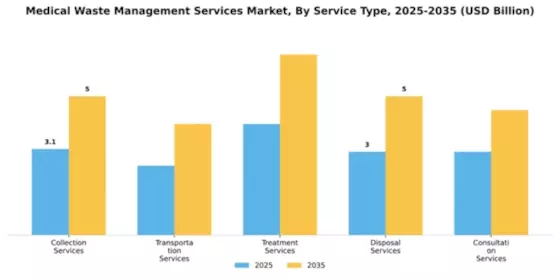
In the Medical Waste Management Services Market, the collection services segment holds the largest market share due to the essential role of proper collection in ensuring safety and compliance. This segment encompasses a variety of services, including scheduled pickups and on-demand collection, catering to healthcare facilities' needs. Conversely, the treatment services segment, which involves processes to neutralize or dispose of waste safely, represents the fastest-growing facet of the market as burgeoning regulations and an increasing focus on sustainability drive demand for environmentally sound treatment solutions.
Collection Services (Dominant) vs. Treatment Services (Emerging)
Collection services are dominant in the Medical Waste Management Services Market, as they form the foundation of effective waste management practices. This segment includes diverse offerings such as regular collections tailored to healthcare facilities' operating hours and specialized collection for hazardous materials. On the other hand, treatment services are emerging rapidly, fueled by the implementation of stringent regulations aimed at reducing the environmental impact of medical waste. This growth is backed by advancements in treatment technologies, such as autoclaving and chemical disinfection, which enhance efficiency and compliance while addressing the increasing public demand for eco-friendly waste management practices.
In the Medical Waste Management Services Market, the largest segment is Hazardous Waste, which commands a significant portion of the market share. This category primarily includes waste that poses risk to human health and the environment. Conversely, Infectious Waste is witnessing rapid growth, driven by the increasing volume of medical and biological waste generated in healthcare facilities. As hospitals and clinics expand, so does the need for effective waste management solutions, particularly for waste that may be infectious in nature.
Hazardous Waste (Dominant) vs. Infectious Waste (Emerging)
Hazardous Waste represents a prominent segment in the Medical Waste Management Services Market, composed of materials that contain potentially harmful substances. Its dominance stems from stringent regulations and the necessity for specialized disposal methods. Medical facilities are often obligated to manage these wastes meticulously due to their toxicity. On the other hand, Infectious Waste, categorized as a fast-emerging segment, is primarily generated by activities that involve pathogens, such as laboratories and surgical facilities. The growing awareness of health risks associated with infectious materials drives demand for innovative management solutions, creating new opportunities for providers in this space.
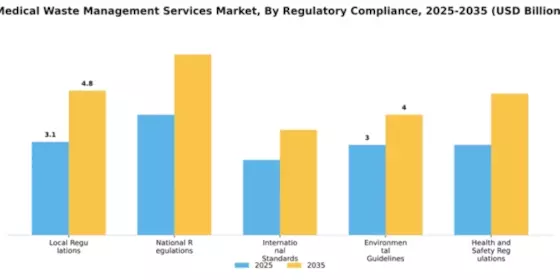
In the Medical Waste Management Services Market, local regulations play a pivotal role, accounting for the largest share in regulatory compliance due to their direct impact on waste management practices within specific municipalities. These regulations set forth by local authorities dictate the collection, disposal, and treatment methods of medical waste, ensuring that local healthcare facilities comply with mandated guidelines. In contrast, national regulations are emerging rapidly, demonstrating the fastest growth as governments recognize the need for uniform compliance and enhanced safety across states and regions. This shift highlights a growing awareness of the critical need for streamlined practices in waste management on a broader national scale. Growth trends within the regulatory compliance segment are being driven by increasing government scrutiny and stringent enforcement of waste management protocols. As healthcare facilities expand and generate larger volumes of waste, both local and national authorities are stepping up their efforts to ensure compliance. Additionally, the rise of international standards is prompting local and national entities to align their regulations with global benchmarks, further accelerating the adoption of best practices in medical waste management. This evolving landscape underscores the importance of regulatory adherence in fostering safety and protecting public health.
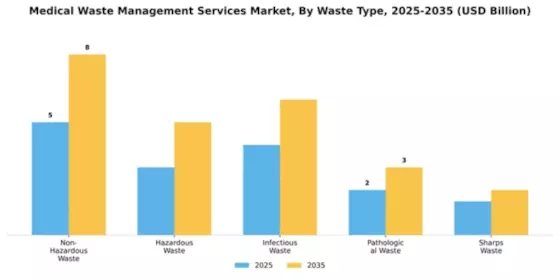
Local Regulations (Dominant) vs. International Standards (Emerging)
Local regulations serve as the cornerstone of waste management practices in the healthcare sector, ensuring that facilities meet specific community needs and safety standards. These regulations often require meticulous documentation, training, and operational protocols tailored to the locality, emphasizing the importance of compliance at a grassroots level. In contrast, international standards are emerging as key drivers for harmonizing medical waste management practices across borders. While they may lack the immediate enforcement power of local laws, their adoption is becoming increasingly critical as global health concerns necessitate uniformity and accountability in waste treatment methods. As healthcare becomes increasingly globalized, the interaction between local regulations and international standards will shape the future of the medical waste management landscape.
Get more detailed insights about Medical Waste Management Services Market Request Free Sample
North America is poised to maintain its leadership in the Medical Waste Management Services Market, holding a significant market share of 7.75 in 2024. The region's growth is driven by stringent regulations, increasing healthcare activities, and rising awareness about safe waste disposal. The demand for efficient waste management solutions is further fueled by technological advancements and the need for compliance with environmental standards. The competitive landscape in North America is robust, featuring key players such as Stericycle, Waste Management, and Clean Harbors. These companies are leveraging innovative technologies and expanding their service offerings to capture a larger market share. The U.S. remains the largest contributor, supported by a well-established healthcare infrastructure and a growing emphasis on sustainability in waste management practices.
Europe's Medical Waste Management Services Market is projected to grow significantly, with a market size of 4.5 by 2025. The region's growth is primarily driven by stringent EU regulations aimed at reducing environmental impact and promoting sustainable waste management practices. Increased healthcare activities and public awareness regarding the dangers of improper waste disposal are also key factors contributing to market expansion. Leading countries in this region include Germany, France, and the UK, where companies like Veolia and SUEZ are prominent players. The competitive landscape is characterized by a focus on compliance and innovation, with firms investing in advanced technologies to enhance service efficiency. The European market is increasingly prioritizing eco-friendly solutions, aligning with broader sustainability goals.
The Asia-Pacific region is witnessing rapid growth in the Medical Waste Management Services Market, with a projected size of 2.5 by 2025. This growth is driven by increasing healthcare expenditures, urbanization, and rising awareness of the importance of proper waste disposal. Governments are implementing stricter regulations to manage medical waste effectively, which is further propelling market demand. Countries like China and India are leading the charge, with a growing number of healthcare facilities and a rising population. The competitive landscape includes local and international players, with companies like BioMedical Waste Solutions and MedPro Disposal expanding their footprint. The region's market is characterized by a mix of traditional practices and modern waste management solutions, creating opportunities for innovation and investment.
The Middle East and Africa region is gradually developing its Medical Waste Management Services Market, currently valued at 0.75. The growth is driven by increasing healthcare infrastructure and rising awareness of the health risks associated with improper waste disposal. However, challenges such as regulatory inconsistencies and limited resources hinder rapid market expansion. Governments are beginning to recognize the importance of effective waste management, leading to gradual improvements in regulations. Countries like South Africa and the UAE are at the forefront of this market, with local companies and international players working to establish efficient waste management systems. The competitive landscape is evolving, with a focus on compliance and sustainability. As regulations tighten, the demand for reliable waste management services is expected to rise, presenting opportunities for growth in the region.
The Medical Waste Management Services Market is characterized by a competitive landscape that is increasingly shaped by regulatory pressures, technological advancements, and a growing emphasis on sustainability. Key players such as Stericycle (US), Waste Management (US), and Veolia (FR) are strategically positioning themselves to leverage these dynamics. Stericycle (US) has focused on enhancing its service offerings through digital transformation initiatives, aiming to streamline operations and improve customer engagement. Waste Management (US) has adopted a strategy of regional expansion, targeting underserved markets to bolster its service footprint. Meanwhile, Veolia (FR) emphasizes innovation in waste treatment technologies, which is critical in meeting stringent environmental regulations and customer expectations.The market structure appears moderately fragmented, with a mix of large multinational corporations and smaller regional players. This fragmentation is indicative of the diverse needs across different healthcare sectors, necessitating localized solutions. Key players are increasingly localizing their operations and optimizing supply chains to enhance service delivery and reduce costs. The collective influence of these companies shapes a competitive environment where agility and responsiveness to market demands are paramount.In November Stericycle (US) announced a partnership with a leading healthcare technology firm to develop an integrated waste management platform. This strategic move is likely to enhance operational efficiency and provide clients with real-time tracking of waste disposal processes, thereby addressing compliance and safety concerns more effectively. Such innovations may set a new standard in the industry, emphasizing the importance of technology in waste management.In October Waste Management (US) launched a new initiative aimed at increasing recycling rates within medical facilities. This initiative not only aligns with sustainability goals but also positions the company as a leader in environmentally responsible waste management. By promoting recycling, Waste Management (US) could potentially reduce landfill contributions and enhance its corporate image, appealing to environmentally conscious clients.In September Veolia (FR) expanded its operations in North America by acquiring a regional waste management company. This acquisition is significant as it allows Veolia (FR) to enhance its service capabilities and market presence in a key region. The integration of local expertise with Veolia's advanced technologies may lead to improved service delivery and customer satisfaction, further solidifying its competitive edge.As of December the competitive trends in the Medical Waste Management Services Market are increasingly defined by digitalization, sustainability, and the integration of artificial intelligence (AI) into operations. Strategic alliances are becoming more prevalent, as companies recognize the value of collaboration in enhancing service offerings and operational efficiencies. The shift from price-based competition to a focus on innovation, technology, and supply chain reliability is evident, suggesting that future competitive differentiation will hinge on the ability to adapt to evolving market demands and regulatory landscapes.

The Medical Waste Management Services Market is projected to grow at a 4.44% CAGR from 2025 to 2035, driven by regulatory changes, technological advancements, and increasing healthcare activities.
New opportunities lie in:
By 2035, the market is expected to be robust, driven by innovation and regulatory compliance.
| MARKET SIZE 2024 | 15.5(USD Billion) |
| MARKET SIZE 2025 | 16.19(USD Billion) |
| MARKET SIZE 2035 | 25.0(USD Billion) |
| COMPOUND ANNUAL GROWTH RATE (CAGR) | 4.44% (2025 - 2035) |
| REPORT COVERAGE | Revenue Forecast, Competitive Landscape, Growth Factors, and Trends |
| BASE YEAR | 2024 |
| Market Forecast Period | 2025 - 2035 |
| Historical Data | 2019 - 2024 |
| Market Forecast Units | USD Billion |
| Key Companies Profiled | Stericycle (US), Waste Management (US), Veolia (FR), Clean Harbors (US), Republic Services (US), SUEZ (FR), MedPro Disposal (US), BioMedical Waste Solutions (US), Corteva (US) |
| Segments Covered | Application, End Use, Service Type, Waste Type, Regulatory Compliance |
| Key Market Opportunities | Integration of advanced technologies for efficient and sustainable Medical Waste Management Services. |
| Key Market Dynamics | Rising regulatory scrutiny and technological advancements drive innovation in medical waste management services. |
| Countries Covered | North America, Europe, APAC, South America, MEA |
The market valuation was 15.5 USD Billion in 2024.
The market is projected to reach 25.0 USD Billion by 2035.
The expected CAGR is 4.44% during the forecast period 2025 - 2035.
Key players include Stericycle, Waste Management, Veolia, Clean Harbors, and Republic Services.
Biomedical Waste had the highest valuation at 5.0 USD Billion in 2024.
The Pharmaceutical Waste segment is projected to grow from 3.0 USD Billion to 5.0 USD Billion by 2035.
Treatment Services are projected to grow from 4.0 USD Billion to 6.5 USD Billion by 2035.
The Hospitals segment is expected to grow from 6.2 USD Billion to 10.0 USD Billion by 2035.
Hazardous Waste is projected to grow from 3.0 USD Billion to 5.0 USD Billion by 2035.
Local Regulations are projected to increase from 3.1 USD Billion to 4.8 USD Billion by 2035, influencing market dynamics.


Kindly complete the form below to receive a free sample of this Report

“This is really good guys. Excellent work on a tight deadline. I will continue to use you going forward and recommend you to others. Nice job”


“Thanks. It’s been a pleasure working with you, please use me as reference with any other Intel employees.”


“Thanks for sending the report it gives us a good global view of the Betaïne market.”


“Thank you, this will be very helpful for OQS.”


“We found the report very insightful! we found your research firm very helpful. I'm sending this email to secure our future business.”


“I am very pleased with how market segments have been defined in a relevant way for my purposes (such as "Portable Freezers & refrigerators" and "last-mile"). In general the report is well structured. Thanks very much for your efforts.”


“I have been reading the first document or the study, ,the Global HVAC and FP market report 2021 till 2026. Must say, good info! I have not gone in depth at all parts, but got a good indication of the data inside!”


“We got the report in time, we really thank you for your support in this process. I also thank to all of your team as they did a great job.”


“The Automotive 48V ECU Components Procurement Intelligence Study” was a complex project, but the Market Research Future (MRFR) team handled it with quality, agility, and customer-centricity. They delivered all requested data on time and within the agreed scope. The team, including Shubhendra Anand and Rahul Gotadki, was always readily available to clarify questions and swiftly implement necessary adjustments, driving the project to a successful conclusion within a very demanding timeframe.
I would also like to specifically commend Akshay Agarwal for his responsiveness and support at every stage—from our initial inquiry on May 6th through to final delivery on June 18th. His dedication made the entire process seamless.”



