Download Free Sample
Kindly complete the form below to receive a free sample of this Report
Waste Management Consulting Services Market Research Report By End Use (Municipal, Industrial, Commercial, Construction, Healthcare), By Application (Waste Reduction, Recycling Optimization, Composting Services, Landfill Management, Hazardous Waste Management), By Service Type (Consultation Services, Training And Education, Compliance Assistance, Technology Implementation, Waste Auditing) And By Region (North America, Europe, Asia-Pacific, And Rest Of The World) – Market Forecast Till 2035.
As per MRFR analysis, the Waste Management Consulting Services Market was estimated at 6.2 USD Billion in 2024. The Waste Management Consulting Services industry is projected to grow from 6.45 USD Billion in 2025 to 9.5 USD Billion by 2035, exhibiting a compound annual growth rate (CAGR) of 3.96% during the forecast period 2025 - 2035.
The Waste Management Consulting Services Market is experiencing a robust shift towards sustainability and technological integration.
| 2024 Market Size | 6.2 (USD Billion) |
| 2035 Market Size | 9.5 (USD Billion) |
| CAGR (2025 - 2035) | 3.96% |
Waste Management Inc (US), Veolia Environnement SA (FR), SUEZ SA (FR), Biffa plc (GB), Republic Services Inc (US), Clean Harbors Inc (US), GFL Environmental Inc (CA), Covanta Holding Corporation (US), Stericycle Inc (US)
Our Impact
Enabled $4.3B Revenue Impact for Fortune 500 and Leading Multinationals
Partnering with 2000+ Global Organizations Each Year
30K+ Citations by Top-Tier Firms in the Industry
The Waste Management Consulting Services Market is currently experiencing a transformative phase, driven by increasing environmental awareness and regulatory pressures. Organizations are increasingly seeking expert guidance to navigate complex waste management challenges, which include compliance with stringent regulations and the implementation of sustainable practices. This market appears to be evolving as businesses recognize the importance of integrating waste management strategies into their overall operational frameworks. The demand for specialized consulting services is likely to grow, as companies aim to enhance their sustainability profiles and reduce their environmental footprints. Moreover, technological advancements are reshaping the landscape of waste management consulting. The integration of data analytics, artificial intelligence, and innovative waste processing technologies is enabling consultants to offer more effective solutions tailored to specific client needs. This trend suggests a shift towards more data-driven decision-making processes, where insights derived from advanced technologies inform waste management strategies. As the Waste Management Consulting Services Market continues to expand, it may also witness increased collaboration between public and private sectors, fostering a more holistic approach to waste management challenges.
There is a growing emphasis on incorporating sustainability into waste management practices. Organizations are increasingly seeking consulting services that help them develop and implement sustainable waste management strategies, aligning with global environmental goals.
The rise of technology in waste management consulting is notable. Consultants are leveraging data analytics and innovative technologies to provide tailored solutions, enhancing efficiency and effectiveness in waste management processes.
With evolving regulations, businesses are prioritizing compliance in their waste management strategies. Consulting services that specialize in navigating complex regulatory landscapes are becoming essential for organizations aiming to avoid penalties and enhance their operational integrity.
The pursuit of corporate sustainability goals is a driving force behind the Waste Management Consulting Services Market. Many organizations are setting ambitious targets to reduce waste and enhance recycling efforts as part of their broader sustainability strategies. This shift is often accompanied by the need for expert guidance on how to effectively implement these goals. Consulting services play a crucial role in helping companies develop and execute waste management plans that align with their sustainability objectives. Recent studies suggest that businesses with well-defined sustainability goals can enhance their brand reputation and customer loyalty. As more companies commit to sustainability, the demand for waste management consulting services is expected to grow, further propelling the Waste Management Consulting Services Market.
The Waste Management Consulting Services Market is significantly influenced by the tightening of regulations surrounding waste disposal and management. Governments are implementing stricter policies to ensure compliance with environmental standards, which necessitates expert consulting services. Organizations are increasingly required to adhere to regulations that govern waste management, including proper disposal methods and reporting requirements. This regulatory landscape creates a demand for consulting services that can help businesses navigate complex compliance issues. For instance, the implementation of the Waste Framework Directive in various regions has led to a surge in demand for consulting services, as companies seek to avoid penalties and enhance their sustainability profiles. As regulations continue to evolve, the Waste Management Consulting Services Market is poised for growth.
The increasing awareness regarding environmental issues is a pivotal driver for the Waste Management Consulting Services Market. As individuals and organizations become more conscious of their ecological footprint, there is a growing demand for consulting services that can guide effective waste management strategies. This trend is reflected in the rising number of sustainability initiatives adopted by businesses, which often require expert advice on waste reduction and recycling practices. In fact, recent data indicates that companies investing in sustainable waste management practices can reduce their operational costs by up to 30 percent. Consequently, the Waste Management Consulting Services Market is likely to experience substantial growth as more entities seek to align their operations with environmentally friendly practices.
The transition towards a circular economy is emerging as a key driver for the Waste Management Consulting Services Market. This economic model emphasizes the importance of reusing and recycling materials to minimize waste and reduce resource consumption. As businesses and governments increasingly adopt circular economy principles, there is a heightened demand for consulting services that can assist in developing strategies for waste reduction and resource recovery. The shift towards a circular economy not only supports environmental sustainability but also presents economic opportunities for organizations. For instance, companies that embrace circular practices can potentially unlock new revenue streams through the sale of recycled materials. Consequently, the Waste Management Consulting Services Market is likely to experience growth as more entities seek to transition towards this sustainable economic model.
Technological advancements are reshaping the Waste Management Consulting Services Market by introducing innovative solutions for waste reduction and recycling. The integration of smart technologies, such as IoT and AI, enables more efficient waste tracking and management processes. These technologies facilitate real-time monitoring of waste generation and disposal, allowing organizations to optimize their waste management strategies. Moreover, the adoption of advanced recycling technologies is enhancing the recovery of valuable materials from waste streams. As businesses increasingly recognize the benefits of these technologies, the demand for consulting services that can guide their implementation is likely to rise. The Waste Management Consulting Services Market stands to benefit from this trend, as companies seek to leverage technology to improve their waste management practices.
In the Waste Management Consulting Services Market, the application segment is characterized by different areas such as Waste Reduction, Recycling Optimization, Composting Services, Landfill Management, and Hazardous Waste Management. Among these, Waste Reduction holds the largest share due to its critical importance in minimizing waste at the source. Recycling Optimization follows closely, gaining ground as businesses increasingly recognize the financial and environmental benefits of optimizing their existing recycling processes.
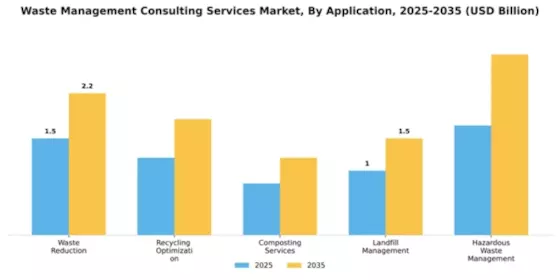
Waste Reduction (Dominant) vs. Recycling Optimization (Emerging)
Waste Reduction is currently the dominant application in the Waste Management Consulting Services Market, widely recognized for its effectiveness in lowering waste production through better operational practices and employee engagement. Businesses are investing heavily in Waste Reduction strategies to meet sustainability goals, driven by regulatory pressures and consumer demand for greener practices. On the other hand, Recycling Optimization is an emerging focus area, rapidly gaining traction as firms aim to boost recycling rates and reduce costs. With advancements in technology and data analytics, organizations are finding innovative ways to enhance recycling processes, thus establishing Recycling Optimization as a pivotal element in achieving a circular economy.
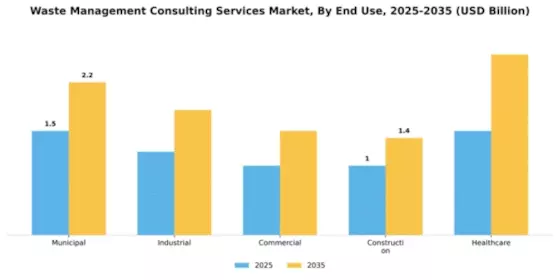
In the Waste Management Consulting Services Market, Municipal services hold a substantial share, predominantly due to the increased focus on efficient waste disposal and recycling practices within cities. This segment encompasses the collection, sorting, and treatment of waste generated by households and local governments, leading to significant growth. Following closely are the Industrial and Commercial segments, which are characterized by their need for tailored waste management strategies that comply with environmental regulations. On the other hand, the Healthcare sector is rapidly gaining traction as a key player in waste management consulting services. The surge in healthcare waste, driven by the ongoing expansion of healthcare facilities and the heightened awareness of the risks associated with biomedical waste, is propelling this segment's growth. Rising regulatory pressures and the need for sustainable practices further underscore the importance of healthcare waste management.
Municipal (Dominant) vs. Healthcare (Emerging)
The Municipal segment dominates the Waste Management Consulting Services Market, primarily due to its comprehensive approach to waste management that encompasses various services including waste collection, recycling, and disposal in urban areas. Municipalities are increasingly adopting advanced waste management strategies to address rising waste volumes and environmental concerns, making this segment a leader in the market. Conversely, the Healthcare segment, though emerging, is growing rapidly as hospitals and clinics face increasing pressures to manage medical waste safely and sustainably. This segment introduces unique challenges, such as the need for specialized treatment methods and compliance with stringent regulations. Collectively, these segments illustrate the diverse needs in waste management, showcasing both stability in Municipal services and dynamic growth in Healthcare.
In the Waste Management Consulting Services Market, Consultation Services hold the largest market share, offering expert guidance on waste management strategies. This segment is crucial for organizations looking to enhance sustainability and optimize waste practices. In contrast, Technology Implementation is rapidly gaining traction, reflecting a paradigm shift towards the adoption of innovative solutions and digital tools in waste management. As businesses strive to modernize their approaches, this segment is gaining momentum among stakeholders seeking efficiency and effectiveness in waste operations.
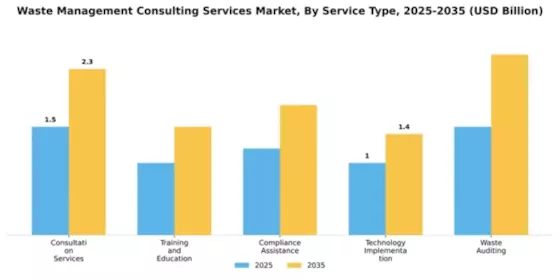
Consultation Services (Dominant) vs. Technology Implementation (Emerging)
Consultation Services represent a dominant force in the Waste Management Consulting Services Market, characterized by their extensive industry expertise and tailored solutions that help businesses navigate complex waste management challenges. These services are instrumental in formulating strategies that minimize environmental impact while maximizing operational efficiency. On the other hand, Technology Implementation has emerged as a vital segment, focusing on integrating cutting-edge technologies such as waste tracking systems and data analytics. This evolution signifies a growing recognition of the need for innovation to drive sustainability and effectiveness in waste handling, positioning Technology Implementation as a key player in shaping the future of waste management.
Get more detailed insights about Waste Management Consulting Services Market Request Free Sample
North America is poised to maintain its leadership in the Waste Management Consulting Services Market, holding a significant market share of 3.1 billion. The region's growth is driven by stringent environmental regulations, increasing waste generation, and a rising emphasis on sustainability. Government initiatives aimed at reducing landfill waste and promoting recycling are further catalyzing demand for consulting services. The competitive landscape is robust, with key players such as Waste Management Inc, Republic Services Inc, and Clean Harbors Inc leading the charge. The U.S. remains the largest market, supported by advanced infrastructure and technology adoption. Canadian firms like GFL Environmental Inc are also gaining traction, contributing to the region's overall growth and innovation in waste management solutions.
Europe's Waste Management Consulting Services Market is valued at 1.8 billion, driven by a strong regulatory framework and a commitment to sustainability. The European Union's directives on waste management and recycling are pivotal in shaping market dynamics. Countries are increasingly adopting circular economy principles, which are expected to boost demand for consulting services in waste reduction and resource recovery. Leading countries like Germany, France, and the UK are at the forefront of this transformation, with companies such as Veolia Environnement SA and SUEZ SA playing crucial roles. The competitive landscape is characterized by a mix of local and international players, all striving to meet the evolving regulatory requirements and consumer expectations for sustainable waste management solutions. "The European Green Deal aims to make Europe the first climate-neutral continent by 2050, which will significantly impact waste management practices."
The Asia-Pacific region, valued at 1.5 billion, is witnessing rapid growth in the Waste Management Consulting Services Market. This surge is attributed to urbanization, population growth, and increasing waste generation. Governments are implementing stricter regulations to manage waste effectively, which is driving demand for consulting services. Initiatives aimed at enhancing recycling rates and reducing landfill usage are also contributing to market expansion. Countries like China, India, and Japan are leading the charge, with significant investments in waste management infrastructure. The competitive landscape features both local firms and international players, including Biffa plc and Covanta Holding Corporation, who are adapting to the unique challenges and opportunities in the region. The focus on sustainable practices is expected to further enhance market growth in the coming years.
The Middle East and Africa region, with a market size of 0.8 billion, presents unique challenges and opportunities in the Waste Management Consulting Services Market. Rapid urbanization and population growth are leading to increased waste generation, prompting governments to seek effective waste management solutions. Regulatory frameworks are gradually evolving, focusing on sustainability and environmental protection, which is expected to drive demand for consulting services. Countries like South Africa and the UAE are making strides in waste management, with local firms and international players exploring opportunities in this developing market. The presence of key players such as Stericycle Inc is indicative of the growing interest in waste management solutions. As regulations tighten, the market is likely to see increased investment and innovation in waste management practices.
The Waste Management Consulting Services Market is currently characterized by a dynamic competitive landscape, driven by increasing regulatory pressures, a growing emphasis on sustainability, and the need for innovative waste management solutions. Major players such as Waste Management Inc (US), Veolia Environnement SA (FR), and SUEZ SA (FR) are strategically positioning themselves through a combination of technological advancements and regional expansions. Waste Management Inc (US) focuses on enhancing its digital capabilities to optimize waste collection and processing, while Veolia Environnement SA (FR) emphasizes its commitment to circular economy principles, integrating sustainability into its core operations. SUEZ SA (FR) is actively pursuing partnerships to bolster its service offerings, thereby shaping a competitive environment that prioritizes innovation and sustainability.The market structure appears moderately fragmented, with a mix of large multinational corporations and smaller regional players. Key business tactics include localizing services to meet specific regional needs and optimizing supply chains to enhance operational efficiency. The collective influence of these major players fosters a competitive atmosphere where collaboration and innovation are paramount, as companies seek to differentiate themselves in a crowded marketplace.In November Waste Management Inc (US) announced a strategic partnership with a leading technology firm to develop AI-driven waste sorting systems. This initiative is poised to enhance operational efficiency and reduce contamination rates in recycling streams, reflecting the company's commitment to leveraging technology for improved waste management solutions. The strategic importance of this move lies in its potential to set new industry standards for waste processing.In October Veolia Environnement SA (FR) launched a new initiative aimed at increasing the recycling rates of plastics in urban areas. This program, which includes educational campaigns and community engagement, underscores Veolia's proactive approach to addressing environmental challenges. The significance of this initiative is evident in its alignment with global sustainability goals, positioning Veolia as a leader in the transition towards a circular economy.In September SUEZ SA (FR) completed the acquisition of a regional waste management firm, enhancing its service capabilities in the North American market. This acquisition not only expands SUEZ's operational footprint but also strengthens its competitive position by integrating local expertise and resources. The strategic importance of this acquisition lies in its potential to drive growth and improve service delivery in a key market.As of December current trends in the Waste Management Consulting Services Market are increasingly defined by digitalization, sustainability, and the integration of AI technologies. Strategic alliances are becoming more prevalent, as companies recognize the value of collaboration in addressing complex waste management challenges. Looking ahead, competitive differentiation is likely to evolve from traditional price-based competition towards a focus on innovation, technological advancements, and supply chain reliability. This shift suggests that companies that prioritize these elements will be better positioned to thrive in an ever-evolving market.
The Waste Management Consulting Services Market is projected to grow at a 3.96% CAGR from 2025 to 2035, driven by regulatory changes, technological advancements, and increasing environmental awareness.
New opportunities lie in:
By 2035, the market is expected to be robust, reflecting increased demand for innovative waste management solutions.
| MARKET SIZE 2024 | 6.2(USD Billion) |
| MARKET SIZE 2025 | 6.45(USD Billion) |
| MARKET SIZE 2035 | 9.5(USD Billion) |
| COMPOUND ANNUAL GROWTH RATE (CAGR) | 3.96% (2025 - 2035) |
| REPORT COVERAGE | Revenue Forecast, Competitive Landscape, Growth Factors, and Trends |
| BASE YEAR | 2024 |
| Market Forecast Period | 2025 - 2035 |
| Historical Data | 2019 - 2024 |
| Market Forecast Units | USD Billion |
| Key Companies Profiled | Waste Management Inc (US), Veolia Environnement SA (FR), SUEZ SA (FR), Biffa plc (GB), Republic Services Inc (US), Clean Harbors Inc (US), GFL Environmental Inc (CA), Covanta Holding Corporation (US), Stericycle Inc (US) |
| Segments Covered | Application, End Use, Service Type |
| Key Market Opportunities | Integration of advanced data analytics for optimizing waste management strategies and compliance. |
| Key Market Dynamics | Rising regulatory pressures and technological advancements drive demand for innovative waste management consulting services. |
| Countries Covered | North America, Europe, APAC, South America, MEA |
The market valuation reached 6.2 USD Billion in 2024.
The market is expected to grow to 9.5 USD Billion by 2035.
The anticipated CAGR for the market from 2025 to 2035 is 3.96%.
Key players include Waste Management Inc, Veolia Environnement SA, SUEZ SA, and others.
The main applications include Waste Reduction, Recycling Optimization, and Hazardous Waste Management.
Revenue from Waste Reduction services is projected to be between 1.5 and 2.2 USD Billion.
Healthcare waste management consulting services are expected to generate between 1.5 and 2.6 USD Billion.
Services include Consultation Services, Training and Education, and Compliance Assistance.
Waste Auditing services are expected to generate between 1.5 and 2.5 USD Billion.
Industrial waste management is projected to generate between 1.2 and 1.8 USD Billion, while Municipal waste management is expected to reach between 1.5 and 2.2 USD Billion.


Kindly complete the form below to receive a free sample of this Report

“This is really good guys. Excellent work on a tight deadline. I will continue to use you going forward and recommend you to others. Nice job”


“Thanks. It’s been a pleasure working with you, please use me as reference with any other Intel employees.”


“Thanks for sending the report it gives us a good global view of the Betaïne market.”


“Thank you, this will be very helpful for OQS.”


“We found the report very insightful! we found your research firm very helpful. I'm sending this email to secure our future business.”


“I am very pleased with how market segments have been defined in a relevant way for my purposes (such as "Portable Freezers & refrigerators" and "last-mile"). In general the report is well structured. Thanks very much for your efforts.”


“I have been reading the first document or the study, ,the Global HVAC and FP market report 2021 till 2026. Must say, good info! I have not gone in depth at all parts, but got a good indication of the data inside!”


“We got the report in time, we really thank you for your support in this process. I also thank to all of your team as they did a great job.”


“The Automotive 48V ECU Components Procurement Intelligence Study” was a complex project, but the Market Research Future (MRFR) team handled it with quality, agility, and customer-centricity. They delivered all requested data on time and within the agreed scope. The team, including Shubhendra Anand and Rahul Gotadki, was always readily available to clarify questions and swiftly implement necessary adjustments, driving the project to a successful conclusion within a very demanding timeframe.
I would also like to specifically commend Akshay Agarwal for his responsiveness and support at every stage—from our initial inquiry on May 6th through to final delivery on June 18th. His dedication made the entire process seamless.”



