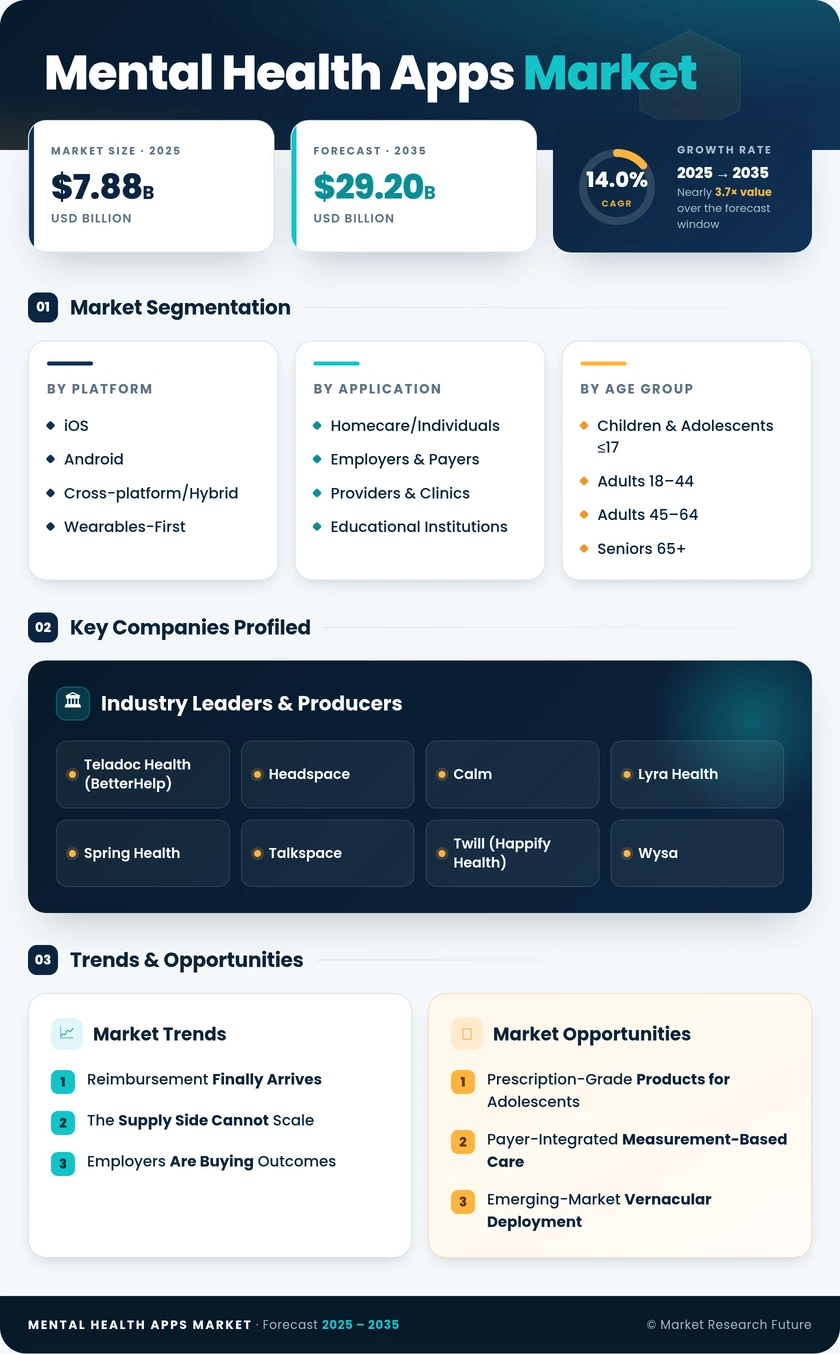
Mental Health Apps Market (2026 - 2035)

Mental Health Apps Market Research Report: Size, Share, Trend Analysis By Applications (Stress Management, Meditation, Therapy, Mood Tracking, Self-Help), By User Type (Individuals, Healthcare Professionals, Corporate Employees, Students), By Platform (iOS, Android, Web, Wearable Devices), By Pricing Model (Subscription, One-Time Purchase, Freemium, In-App Purchases) and By Regional (North America, Europe, South America, Asia Pacific, Middle East and Africa) - Growth Outlook & Industry Forecast 2025 To 2035

Forecast Period
2026-2035
CAGR
14.0%
2025 Market Size
USD 7.88 Billion
2035 Market Size
USD 29.20 Billion
Healthcare Services ● Updated August 2026 Report ID: MRFR/HS/17677-HCR | Pages: 128 | Author: Vikita Thakur, Rahul Gotadki
  1. 1 Market Overview |
    1. 1.1 Study Assumptions & Market Definition |
    2. 1.2 Scope of the Study |
    3. 1.3 Research Methodology
  2. 2 Market Summary & Key Takeaways |
    1. 2.1 Key Findings by Platform |
    2. 2.2 Key Findings by Application |
    3. 2.3 Key Findings by Geography
  3. 3 Global Mental Health Apps Market Size & Forecast (2021–2035) |
    1. 3.1 Historical Market Size (2021–2025) |
    2. 3.2 Current & Forecast Market Size (2026–2035) |
    3. 3.3 Market Size by Revenue (USD Billion) |
    4. 3.4 Year-over-Year Growth Analysis
  4. 4 Market Drivers Analysis |
    1. 4.1 Reimbursement Pathways for Digital Therapeutics |
    2. 4.2 Clinician Shortage & Access Gaps |
    3. 4.3 Employer Behavioural Benefit Expansion |
    4. 4.4 Generative AI Conversational Agents |
    5. 4.5 Smartphone & Wearable Penetration in Asia-Pacific |
    6. 4.6 Adolescent Mental Health Policy Funding
  5. 5 Market Restraints Analysis |
    1. 5.1 Long-Term User Retention Weakness |
    2. 5.2 Privacy & Data-Sharing Scrutiny |
    3. 5.3 Thin Clinical Evidence Base |
    4. 5.4 Regulatory Fragmentation Across Jurisdictions |
    5. 5.5 Clinical Liability & Crisis-Escalation Risk
  6. 6 Market Opportunity Analysis |
    1. 6.1 Prescription-Grade Adolescent Products |
    2. 6.2 Payer-Integrated Measurement-Based Care |
    3. 6.3 Emerging-Market Vernacular Deployment |
    4. 6.4 De-Identified Outcome Data Licensing |
    5. 6.5 Wearable-Native Passive Detection |
    6. 6.6 Industry Value Chain Analysis |
    7. 6.7 Porter's Five Forces Analysis
  7. 7 Regional Analysis |
    1. 7.1 North America | |
      1. 7.1.1 US | |
      2. 7.1.2 Canada | |
      3. 7.1.3 Mexico |
    2. 7.2 Europe | |
      1. 7.2.1 Germany | |
      2. 7.2.2 UK | |
      3. 7.2.3 France | |
      4. 7.2.4 Italy | |
      5. 7.2.5 Spain | |
      6. 7.2.6 Nordic Countries | |
      7. 7.2.7 Russia | |
      8. 7.2.8 Rest of Europe |
    3. 7.3 Asia-Pacific | |
      1. 7.3.1 China | |
      2. 7.3.2 India | |
      3. 7.3.3 Japan | |
      4. 7.3.4 South Korea | |
      5. 7.3.5 ASEAN | |
      6. 7.3.6 Rest of Asia-Pacific |
    4. 7.4 South America | |
      1. 7.4.1 Brazil | |
      2. 7.4.2 Argentina | |
      3. 7.4.3 Rest of South America |
    5. 7.5 Middle East & Africa | |
      1. 7.5.1 Saudi Arabia | |
      2. 7.5.2 UAE | |
      3. 7.5.3 South Africa | |
      4. 7.5.4 Egypt | |
      5. 7.5.5 Rest of Middle East & Africa
  8. 8 Future Outlook (2026–2035) |
    1. 8.1 Regulated AI as Default Interface |
    2. 8.2 Platform Economics & Consolidation |
    3. 8.3 Outcome Data as Balance Sheet Asset |
    4. 8.4 Passive Sensing Displacing Self-Report
  9. 9 Segmentation Analysis |
    1. 9.1 By Platform | |
      1. 9.1.1 iOS | |
      2. 9.1.2 Android | |
      3. 9.1.3 Cross-platform/Hybrid | |
      4. 9.1.4 Wearables-First |
    2. 9.2 By Application | |
      1. 9.2.1 Depression & Anxiety Management | |
      2. 9.2.2 Stress & Sleep Management | |
      3. 9.2.3 Meditation & Mindfulness Wellness | |
      4. 9.2.4 Substance Use & Addiction Recovery | |
      5. 9.2.5 Other Applications |
    3. 9.3 By End User | |
      1. 9.3.1 Homecare/Individuals | |
      2. 9.3.2 Employers & Payers | |
      3. 9.3.3 Providers & Clinics | |
      4. 9.3.4 Educational Institutions |
    4. 9.4 By Age Group | |
      1. 9.4.1 Children & Adolescents ≤17 | |
      2. 9.4.2 Adults 18–44 | |
      3. 9.4.3 Adults 45–64 | |
      4. 9.4.4 Seniors 65+ |
    5. 9.5 By Subscription Model | |
      1. 9.5.1 Freemium | |
      2. 9.5.2 Paid Subscription | |
      3. 9.5.3 One-Time Purchase | |
      4. 9.5.4 Employer/Payer-Sponsored
  10. 10 Competitive Landscape |
    1. 10.1 Market Share Analysis (2026) |
    2. 10.2 Competitive Benchmarking Matrix |
    3. 10.3 Company Profiles | |
      1. 10.3.1 Teladoc Health (BetterHelp) | |
      2. 10.3.2 Headspace | |
      3. 10.3.3 Calm | |
      4. 10.3.4 Lyra Health | |
      5. 10.3.5 Spring Health | |
      6. 10.3.6 Talkspace | |
      7. 10.3.7 Twill (Happify Health) | |
      8. 10.3.8 Wysa | |
      9. 10.3.9 Modern Health | |
      10. 10.3.10 Big Health | |
      11. 10.3.11 Woebot Health
  11. 11 Recent Developments & News
  12. 12 Report Scope & Methodology |
    1. 12.1 Study Period & Base Year |
    2. 12.2 Data Sources & Citations |
    3. 12.3 Abbreviations
  13. 13 Detailed Sources & Citations
  14. 14 Frequently Asked Questions
  15. 15 LIST OF TABLES |
  16. TABLE 1 Global Mental Health Apps Market Size & Forecast, by Revenue (USD Billion), 2021–2035 |
  17. TABLE 2 Global Mental Health Apps Market – Year-over-Year Growth Analysis, 2021–2035 |
  18. TABLE 3 Driver Impact Analysis – Global Mental Health Apps Market, 2026–2035 |
  19. TABLE 4 Restraint Impact Analysis – Global Mental Health Apps Market, 2026–2035 |
  20. TABLE 5 Global Mental Health Apps Market Size, by Region, 2021–2035 (USD Billion) |
  21. TABLE 6 North America Mental Health Apps Market Size, by Country, 2021–2035 (USD Billion) |
  22. TABLE 7 Europe Mental Health Apps Market Size, by Country, 2021–2035 (USD Billion) |
  23. TABLE 8 Asia-Pacific Mental Health Apps Market Size, by Country, 2021–2035 (USD Billion) |
  24. TABLE 9 South America Mental Health Apps Market Size, by Country, 2021–2035 (USD Billion) |
  25. TABLE 10 Middle East & Africa Mental Health Apps Market Size, by Country, 2021–2035 (USD Billion) |
  26. TABLE 11 Global Mental Health Apps Market Size, by Platform, 2021–2035 (USD Billion) |
  27. TABLE 12 Global Mental Health Apps Market Size, by Application, 2021–2035 (USD Billion) |
  28. TABLE 13 Global Mental Health Apps Market Size, by End User, 2021–2035 (USD Billion) |
  29. TABLE 14 Global Mental Health Apps Market Size, by Age Group, 2021–2035 (USD Billion) |
  30. TABLE 15 Global Mental Health Apps Market Size, by Subscription Model, 2021–2035 (USD Billion) |
  31. TABLE 16 North America Mental Health Apps Market Size, by Platform & Application, 2021–2035 (USD Billion) |
  32. TABLE 17 Europe Mental Health Apps Market Size, by Platform & Application, 2021–2035 (USD Billion) |
  33. TABLE 18 Asia-Pacific Mental Health Apps Market Size, by Platform & Application, 2021–2035 (USD Billion) |
  34. TABLE 19 South America Mental Health Apps Market Size, by End User, 2021–2035 (USD Billion) |
  35. TABLE 20 Middle East & Africa Mental Health Apps Market Size, by End User, 2021–2035 (USD Billion) |
  36. TABLE 21 Competitive Benchmarking Matrix – Global Mental Health Apps Market, 2026 |
  37. TABLE 22 Company Profiles – Key Players, Global Mental Health Apps Market |
  38. TABLE 23 Recent Developments & Strategic Announcements, 2023–2025 |
  39. TABLE 24 Report Scope & Methodology Summary |
  40. TABLE 25 Detailed Sources & Citations Index
  41. 16 LIST OF FIGURES |
  42. FIGURE 1 Global Mental Health Apps Market Dynamics – Drivers, Restraints & Opportunities |
  43. FIGURE 2 Industry Value Chain Analysis – Mental Health Apps Ecosystem |
  44. FIGURE 3 Porter's Five Forces Analysis – Global Mental Health Apps Market |
  45. FIGURE 4 Global Market Size Trend & Forecast, 2021–2035 (USD Billion) |
  46. FIGURE 5 Year-over-Year Growth Rate Trend, 2022–2035 (%) |
  47. FIGURE 6 Market Share by Platform, 2025 vs 2035 (%) |
  48. FIGURE 7 Market Share by Application, 2025 vs 2035 (%) |
  49. FIGURE 8 Market Share by End User, 2025 (%) |
  50. FIGURE 9 CAGR Comparison by Age Group, 2026–2035 (%) |
  51. FIGURE 10 Market Share by Subscription Model, 2025 (%) |
  52. FIGURE 11 Regional Market Share Distribution, 2025 (%) |
  53. FIGURE 12 Regional CAGR Comparison, 2026–2035 (%) |
  54. FIGURE 13 North America Country-Level Share Distribution, 2025 (%) |
  55. FIGURE 14 Europe Country-Level Share Distribution, 2025 (%) |
  56. FIGURE 15 Asia-Pacific Country-Level Share Distribution, 2025 (%) |
  57. FIGURE 16 Competitive Landscape – Estimated Revenue Share Positioning, 2026 |
  58. FIGURE 17 Company Strategic Positioning Matrix – Evidence Depth vs Distribution Reach |
  59. FIGURE 18 Reimbursement Pathway Maturity by Geography, 2026
Share::
Request Free Sample

Segmentation Quick Reference

DimensionSub-SegmentsDominant SegmentFastest Growing Segment
By PlatformiOS; Android; Cross-platform/Hybrid; Wearables-FirstiOSWearables-First
By ApplicationDepression & Anxiety Management; Stress & Sleep Management; Meditation & Mindfulness Wellness; Substance Use & Addiction Recovery; Other ApplicationsDepression & Anxiety ManagementSubstance Use & Addiction Recovery
By End UserHomecare/Individuals; Employers & Payers; Providers & Clinics; Educational InstitutionsHomecare/IndividualsEmployers & Payers
By Age GroupChildren & Adolescents ≤17; Adults 18–44; Adults 45–64; Seniors 65+Adults 18–44Children & Adolescents ≤17
By Subscription ModelFreemium; Paid Subscription; One-Time Purchase; Employer/Payer-SponsoredFreemiumEmployer/Payer-Sponsored
By GeographyNorth America; Europe; Asia-Pacific; South America; Middle East & AfricaNorth AmericaAsia-Pacific


Market Segmentation Overview

By Platform

Sub-SegmentKey Trend
iOSHighest revenue per subscriber; preferred launch platform for clinical pilots
AndroidVolume-led expansion across Asia-Pacific, Africa and Latin America
Cross-platform/HybridStandard build choice for enterprise and payer deployments
Wearables-FirstPassive biomarker capture reduces daily-engagement dependency


Platform strategy now follows the buyer rather than the developer. Consumer-first vendors optimise for iOS conversion economics, while institutional vendors build cross-platform from day one because population contracts cannot exclude device classes.

By Application

Sub-SegmentKey Trend
Depression & Anxiety ManagementDirectly reimbursable; anchors prescription digital therapeutic pipelines
Stress & Sleep ManagementCore of employer wellbeing packages; strongest cross-sell into clinical tiers
Meditation & Mindfulness WellnessMature consumer category; competing on content depth and brand
Substance Use & Addiction RecoveryPublic settlement funding accelerating institutional procurement
Other ApplicationsEmerging niches including PTSD, eating disorders and bipolar support


Application boundaries are blurring as vendors bundle wellness and clinical tiers within one interface. The commercial logic is straightforward: acquire cheaply through wellness content, then upgrade qualifying users into reimbursed therapeutic pathways.

By End User

Sub-SegmentKey Trend
Homecare/IndividualsStill the largest pool, but share erodes each forecast year
Employers & PayersFastest-scaling channel; outcome guarantees now standard in contracts
Providers & ClinicsDeployed as step-care to manage referral waiting lists
Educational InstitutionsCampus and district procurement rising with youth policy funding


Institutional buyers reshape product requirements more than consumers do. Reporting dashboards, audit trails, and escalation protocols carry little weight with individual subscribers but decide every enterprise renewal.

By Age Group

Sub-SegmentKey Trend
Children & Adolescents ≤17Highest growth; regulatory clearance remains scarce
Adults 18–44Largest cohort; digital-native adoption and workplace stress exposure
Adults 45–64Growth tied to comorbidity management alongside chronic disease programmes
Seniors 65+Medicare coverage and loneliness interventions unlocking new demand


Age-cohort design differences are substantive rather than cosmetic. Adolescent products require guardian consent architecture and school-appropriate safeguarding, while senior products need accessibility engineering that most consumer teams have never built.

By Subscription Model

Sub-SegmentKey Trend
FreemiumDominant acquisition mechanism; conversion rates under continued pressure
Paid SubscriptionSteady consumer revenue base with persistent churn challenges
One-Time PurchaseDeclining share; limited to course-based and self-help products
Employer/Payer-SponsoredFastest-growing model; removes renewal friction entirely


Monetisation is migrating from the individual wallet to the institutional budget. Sponsored access delivers materially better retention because the user never faces a payment decision, and that dynamic explains most of the model-mix shift expected through 2035.




Share::
Request Free Sample
Download PDF ×

We do not share your information with anyone. However, we may send you emails based on your report interest from time to time. You may contact us at any time to opt-out.