Request Free Sample ×

Kindly complete the form below to receive a free sample of this Report

* Please use a valid business email

Leading companies partner with us for data-driven Insights

clients tt-cursor
Hero Background

Mexico Handheld Counter IED Market

ID: MRFR/AD/56145-HCR
128 Pages
Abbas Raut
Last Updated: February 06, 2026
Mexico Handheld Counter IED Market Size, Share, Industry Trend & Analysis Research Report By Application (Military, Homeland Security, Law Enforcement, Civilian), By Detection Technology (Electromagnetic Field Detection, Infrared Detection, Acoustic Detection, Chemical Detection), By Product Type (Portable Detectors, Handheld Scanners, Smartphone-Based Detectors), and By End-user (Government Agencies, Defense Contractors, Non-Governmental Organizations)-Forecast to 2035
Download PDF ×

We do not share your information with anyone. However, we may send you emails based on your report interest from time to time. You may contact us at any time to opt-out.

  1. 1 SECTION I: EXECUTIVE SUMMARY AND KEY HIGHLIGHTS
    1. 1.1 EXECUTIVE SUMMARY
      1. 1.1.1 Market Overview
      2. 1.1.2 Key Findings
      3. 1.1.3 Market Segmentation
      4. 1.1.4 Competitive Landscape
      5. 1.1.5 Challenges and Opportunities
      6. 1.1.6 Future Outlook
  2. 2 SECTION II: SCOPING, METHODOLOGY AND MARKET STRUCTURE
    1. 2.1 MARKET INTRODUCTION
      1. 2.1.1 Definition
      2. 2.1.2 Scope of the study
        1. 2.1.2.1 Research Objective
        2. 2.1.2.2 Assumption
        3. 2.1.2.3 Limitations
    2. 2.2 RESEARCH METHODOLOGY
      1. 2.2.1 Overview
      2. 2.2.2 Data Mining
      3. 2.2.3 Secondary Research
      4. 2.2.4 Primary Research
        1. 2.2.4.1 Primary Interviews and Information Gathering Process
        2. 2.2.4.2 Breakdown of Primary Respondents
      5. 2.2.5 Forecasting Model
      6. 2.2.6 Market Size Estimation
        1. 2.2.6.1 Bottom-Up Approach
        2. 2.2.6.2 Top-Down Approach
      7. 2.2.7 Data Triangulation
      8. 2.2.8 Validation
  3. 3 SECTION III: QUALITATIVE ANALYSIS
    1. 3.1 MARKET DYNAMICS
      1. 3.1.1 Overview
      2. 3.1.2 Drivers
      3. 3.1.3 Restraints
      4. 3.1.4 Opportunities
    2. 3.2 MARKET FACTOR ANALYSIS
      1. 3.2.1 Value chain Analysis
      2. 3.2.2 Porter's Five Forces Analysis
        1. 3.2.2.1 Bargaining Power of Suppliers
        2. 3.2.2.2 Bargaining Power of Buyers
        3. 3.2.2.3 Threat of New Entrants
        4. 3.2.2.4 Threat of Substitutes
        5. 3.2.2.5 Intensity of Rivalry
      3. 3.2.3 COVID-19 Impact Analysis
        1. 3.2.3.1 Market Impact Analysis
        2. 3.2.3.2 Regional Impact
        3. 3.2.3.3 Opportunity and Threat Analysis
  4. 4 SECTION IV: QUANTITATIVE ANALYSIS
    1. 4.1 Pharmaceutical, BY Application (USD Million)
      1. 4.1.1 Military
      2. 4.1.2 Homeland Security
      3. 4.1.3 Law Enforcement
      4. 4.1.4 Civilian
    2. 4.2 Pharmaceutical, BY Detection Technology (USD Million)
      1. 4.2.1 Electromagnetic Field Detection
      2. 4.2.2 Infrared Detection
      3. 4.2.3 Acoustic Detection
      4. 4.2.4 Chemical Detection
    3. 4.3 Pharmaceutical, BY Product Type (USD Million)
      1. 4.3.1 Portable Detectors
      2. 4.3.2 Handheld Scanners
      3. 4.3.3 Smartphone-Based Detectors
    4. 4.4 Pharmaceutical, BY End User (USD Million)
      1. 4.4.1 Government Agencies
      2. 4.4.2 Defense Contractors
      3. 4.4.3 Non-Governmental Organizations
  5. 5 SECTION V: COMPETITIVE ANALYSIS
    1. 5.1 Competitive Landscape
      1. 5.1.1 Overview
      2. 5.1.2 Competitive Analysis
      3. 5.1.3 Market share Analysis
      4. 5.1.4 Major Growth Strategy in the Pharmaceutical
      5. 5.1.5 Competitive Benchmarking
      6. 5.1.6 Leading Players in Terms of Number of Developments in the Pharmaceutical
      7. 5.1.7 Key developments and growth strategies
        1. 5.1.7.1 New Product Launch/Service Deployment
        2. 5.1.7.2 Merger & Acquisitions
        3. 5.1.7.3 Joint Ventures
      8. 5.1.8 Major Players Financial Matrix
        1. 5.1.8.1 Sales and Operating Income
        2. 5.1.8.2 Major Players R&D Expenditure. 2023
    2. 5.2 Company Profiles
      1. 5.2.1 FLIR Systems (US)
        1. 5.2.1.1 Financial Overview
        2. 5.2.1.2 Products Offered
        3. 5.2.1.3 Key Developments
        4. 5.2.1.4 SWOT Analysis
        5. 5.2.1.5 Key Strategies
      2. 5.2.2 L3Harris Technologies (US)
        1. 5.2.2.1 Financial Overview
        2. 5.2.2.2 Products Offered
        3. 5.2.2.3 Key Developments
        4. 5.2.2.4 SWOT Analysis
        5. 5.2.2.5 Key Strategies
      3. 5.2.3 Teledyne Technologies (US)
        1. 5.2.3.1 Financial Overview
        2. 5.2.3.2 Products Offered
        3. 5.2.3.3 Key Developments
        4. 5.2.3.4 SWOT Analysis
        5. 5.2.3.5 Key Strategies
      4. 5.2.4 Raytheon Technologies (US)
        1. 5.2.4.1 Financial Overview
        2. 5.2.4.2 Products Offered
        3. 5.2.4.3 Key Developments
        4. 5.2.4.4 SWOT Analysis
        5. 5.2.4.5 Key Strategies
      5. 5.2.5 Northrop Grumman (US)
        1. 5.2.5.1 Financial Overview
        2. 5.2.5.2 Products Offered
        3. 5.2.5.3 Key Developments
        4. 5.2.5.4 SWOT Analysis
        5. 5.2.5.5 Key Strategies
      6. 5.2.6 Thales Group (FR)
        1. 5.2.6.1 Financial Overview
        2. 5.2.6.2 Products Offered
        3. 5.2.6.3 Key Developments
        4. 5.2.6.4 SWOT Analysis
        5. 5.2.6.5 Key Strategies
      7. 5.2.7 BAE Systems (GB)
        1. 5.2.7.1 Financial Overview
        2. 5.2.7.2 Products Offered
        3. 5.2.7.3 Key Developments
        4. 5.2.7.4 SWOT Analysis
        5. 5.2.7.5 Key Strategies
      8. 5.2.8 Leonardo S.p.A. (IT)
        1. 5.2.8.1 Financial Overview
        2. 5.2.8.2 Products Offered
        3. 5.2.8.3 Key Developments
        4. 5.2.8.4 SWOT Analysis
        5. 5.2.8.5 Key Strategies
    3. 5.3 Appendix
      1. 5.3.1 References
      2. 5.3.2 Related Reports
  6. 6 LIST OF FIGURES
    1. 6.1 MARKET SYNOPSIS
    2. 6.2 MEXICO MARKET ANALYSIS BY APPLICATION
    3. 6.3 MEXICO MARKET ANALYSIS BY DETECTION TECHNOLOGY
    4. 6.4 MEXICO MARKET ANALYSIS BY PRODUCT TYPE
    5. 6.5 MEXICO MARKET ANALYSIS BY END USER
    6. 6.6 KEY BUYING CRITERIA OF PHARMACEUTICAL
    7. 6.7 RESEARCH PROCESS OF MRFR
    8. 6.8 DRO ANALYSIS OF PHARMACEUTICAL
    9. 6.9 DRIVERS IMPACT ANALYSIS: PHARMACEUTICAL
    10. 6.10 RESTRAINTS IMPACT ANALYSIS: PHARMACEUTICAL
    11. 6.11 SUPPLY / VALUE CHAIN: PHARMACEUTICAL
    12. 6.12 PHARMACEUTICAL, BY APPLICATION, 2024 (% SHARE)
    13. 6.13 PHARMACEUTICAL, BY APPLICATION, 2024 TO 2035 (USD Million)
    14. 6.14 PHARMACEUTICAL, BY DETECTION TECHNOLOGY, 2024 (% SHARE)
    15. 6.15 PHARMACEUTICAL, BY DETECTION TECHNOLOGY, 2024 TO 2035 (USD Million)
    16. 6.16 PHARMACEUTICAL, BY PRODUCT TYPE, 2024 (% SHARE)
    17. 6.17 PHARMACEUTICAL, BY PRODUCT TYPE, 2024 TO 2035 (USD Million)
    18. 6.18 PHARMACEUTICAL, BY END USER, 2024 (% SHARE)
    19. 6.19 PHARMACEUTICAL, BY END USER, 2024 TO 2035 (USD Million)
    20. 6.20 BENCHMARKING OF MAJOR COMPETITORS
  7. 7 LIST OF TABLES
    1. 7.1 LIST OF ASSUMPTIONS
  8. 7.1.1
    1. 7.2 Mexico MARKET SIZE ESTIMATES; FORECAST
      1. 7.2.1 BY APPLICATION, 2025-2035 (USD Million)
      2. 7.2.2 BY DETECTION TECHNOLOGY, 2025-2035 (USD Million)
      3. 7.2.3 BY PRODUCT TYPE, 2025-2035 (USD Million)
      4. 7.2.4 BY END USER, 2025-2035 (USD Million)
    2. 7.3 PRODUCT LAUNCH/PRODUCT DEVELOPMENT/APPROVAL
  9. 7.3.1
    1. 7.4 ACQUISITION/PARTNERSHIP
  10. 7.4.1

Mexico Pharmaceutical Market Segmentation

Pharmaceutical By Application (USD Million, 2025-2035)
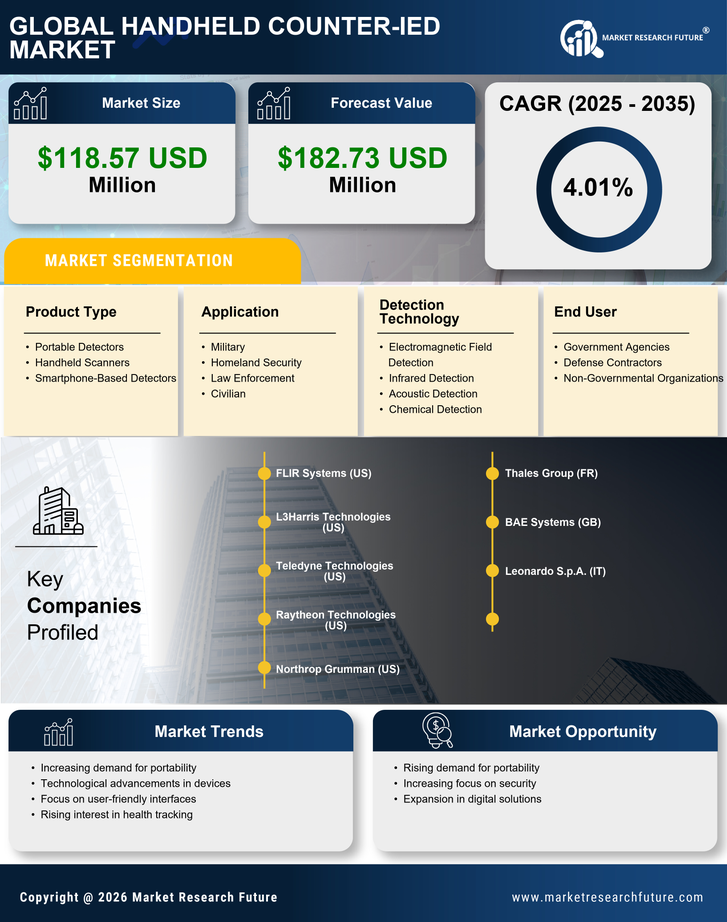
  • Military
  • Homeland Security
  • Law Enforcement
  • Civilian

Pharmaceutical By Detection Technology (USD Million, 2025-2035)

  • Electromagnetic Field Detection
  • Infrared Detection
  • Acoustic Detection
  • Chemical Detection

Pharmaceutical By Product Type (USD Million, 2025-2035)

  • Portable Detectors
  • Handheld Scanners
  • Smartphone-Based Detectors

Pharmaceutical By End User (USD Million, 2025-2035)

  • Government Agencies
  • Defense Contractors
  • Non-Governmental Organizations