Segmentation Quick Reference
| Dimension | Sub-Segments | Dominant Segment | Fastest Growing Segment |
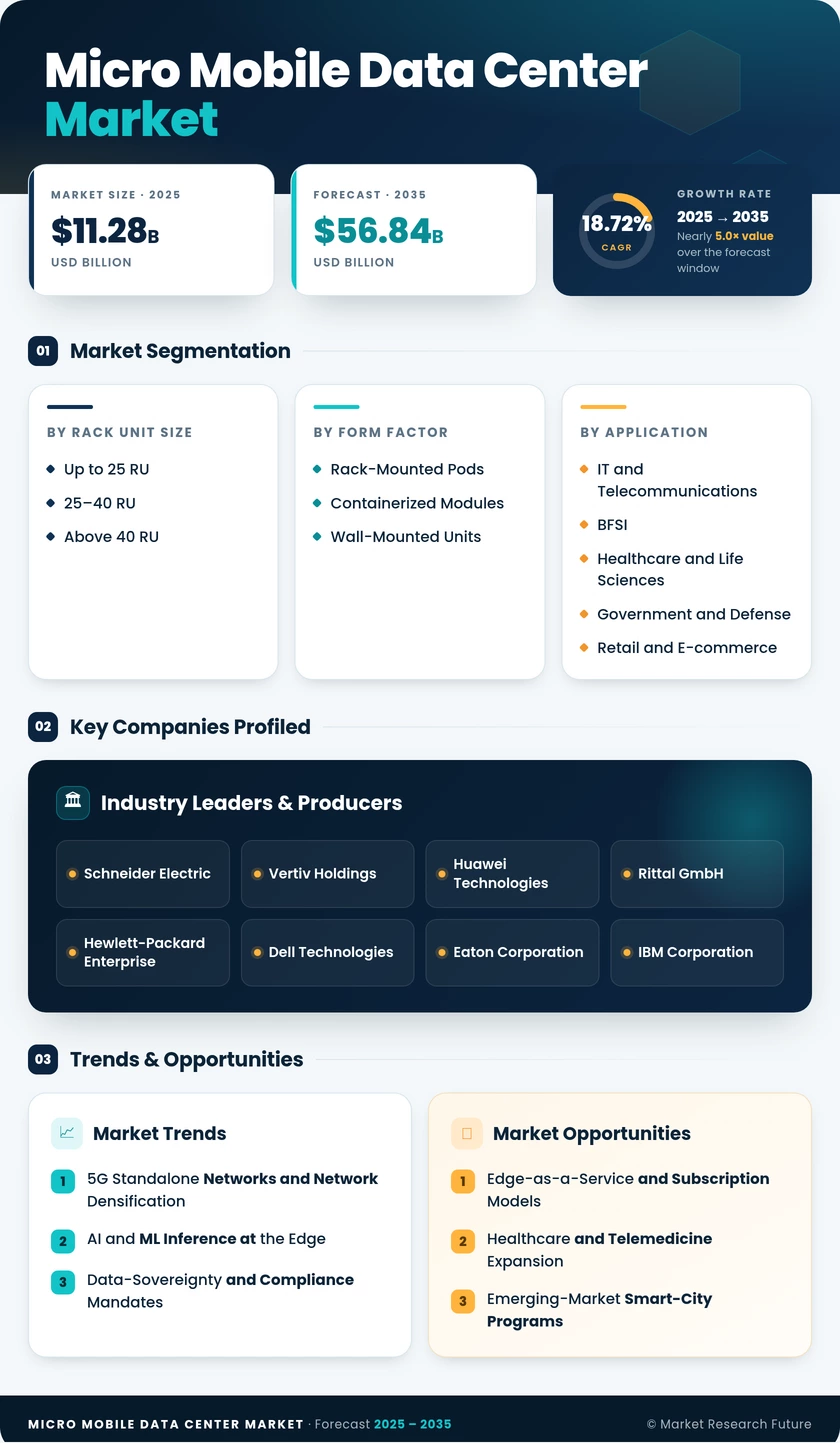
| Rack Unit Size | Up to 25 RU, 25–40 RU, Above 40 RU | 25–40 RU | Up to 25 RU |
| Form Factor | Rack-Mounted Pods, Containerized Modules, Wall-Mounted Units | Rack-Mounted Pods | Containerized Modules |
| Application | Edge Computing Nodes, Instant/Disaster Recovery, High-Density Networks | Edge Computing Nodes | High-Density Networks |
| Organization Size | Small and Medium Enterprises, Large Enterprises | Small and Medium Enterprises | Small and Medium Enterprises |
| End-User Industry | IT & Telecom, BFSI, Healthcare & Micro Mobile Data Center Market, Government & Defense, Retail & E-commerce, Energy & Utilities | IT and Telecommunications | Healthcare and Micro Mobile Data Center Market |
Market Segmentation Overview
By Rack Unit Size
| Sub-Segment | Key Trend |
| Up to 25 RU | Rising demand from retail branch offices and 5G small-cell co-locations requiring ultra-compact footprints |
| 25–40 RU | Workhorse tier for telecom edge and mixed IT/OT environments; balances density with transportability |
| Above 40 RU | Growing GPU-dense AI inference workloads are pushing per-rack power beyond 20 kW |
The 25–40 RU tier remains the volume leader as telecom operators standardize edge-site templates around mid-range rack configurations, while the above-40 RU category gains share as AI inference and high-performance computing migrate to the edge.
By Form Factor
| Sub-Segment | Key Trend |
| Rack-Mounted Pods | Indoor-first design for rapid retrofit of existing server rooms and branch offices |
| Containerized Modules | Ruggedized outdoor deployment; IP55/IP65-rated enclosures for harsh environments |
| Wall-Mounted Units | Space-constrained retail and SME locations; sub-6 kW power envelopes |
Containerized modules are the fastest-growing form factor, driven by military, disaster-response, and remote-industrial use cases that require fully self-contained portable data center units deployable within 48 hours.
By Application
| Sub-Segment | Key Trend |
| Edge Computing Nodes | Latency-sensitive IoT analytics and real-time AI inference at the network periphery |
| Instant / Disaster Recovery | Business-continuity compliance and rapid failover for mission-critical workloads |
| High-Density Networks | CDN edge caching, cloud gaming, and video-streaming infrastructure |
Edge computing nodes dominate by revenue as enterprises prioritize sub-10 ms response times, while high-density network applications grow fastest owing to surging video and gaming traffic.
By Organization Size
| Sub-Segment | Key Trend |
| Small and Medium Enterprises | Edge-as-a-service and subscription models remove capex barriers |
| Large Enterprises | Global standardization of modular micro data center templates across distributed sites |
SMEs account for the majority of new deployments as managed-service providers offer turnkey edge solutions that include hardware, software, connectivity, and 24/7 remote monitoring.
By End-User Industry
| Sub-Segment | Key Trend |
| IT and Telecommunications | 5G RAN virtualization and multi-access edge computing are driving bulk procurement |
| BFSI | Low-latency trading, fraud detection, and ATM-network edge processing |
| Healthcare and Micro Mobile Data Center Market | Real-time imaging, telemedicine, and AI-assisted diagnostics at the point of care |
| Government and Defense | Tactical edge deployments, sovereign cloud mandates, and classified-data processing |
| Retail and E-commerce | In-store analytics, dynamic pricing, and inventory optimization at the shelf level |
| Energy and Utilities | Smart-grid SCADA, remote pipeline monitoring, renewable-asset optimization |
IT and telecommunications remain the largest vertical, while healthcare is poised to be the fastest-growing end-user segment through 2035 as telemedicine adoption scales globally.