Segmentation Quick Reference
| Dimension | Sub-Segments | Dominant Segment | Fastest Growing Segment |
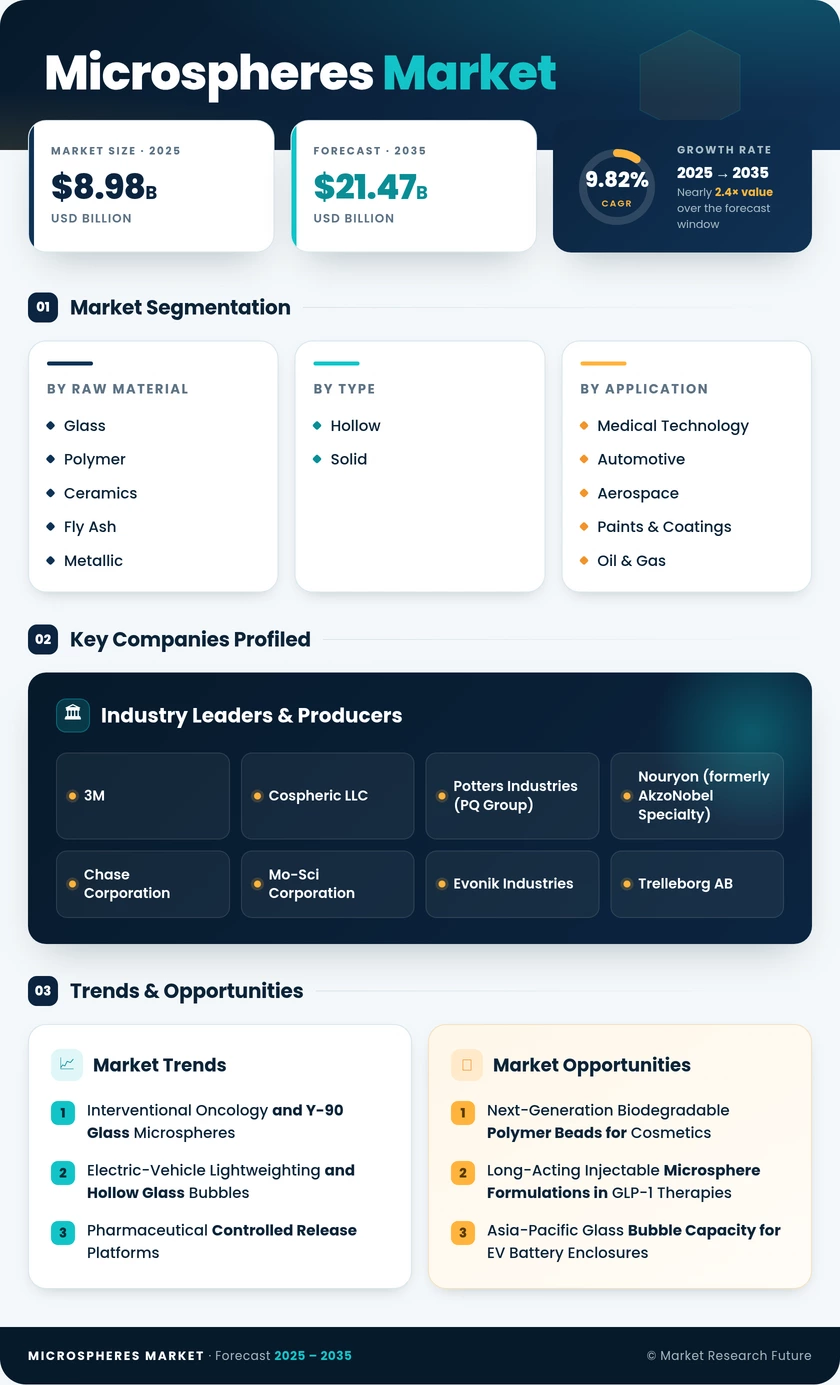
| By Raw Material | Glass, Polymer, Ceramics, Fly Ash, Metallic, Others | Glass | Glass |
| By Type | Hollow, Solid | Hollow | Hollow |
| By Application | Medical Microspheres Market, Automotive, Aerospace, Paints & Coatings, Oil & Gas, Cosmetics, Composites, Others | Medical Microspheres Market | Medical Microspheres Market |
| By Geography | North America, Europe, Asia-Pacific, South America, Middle East & Africa | North America | Asia-Pacific |
Market Segmentation Overview
By Raw Material
| Sub-Segment | Key Trend |
| Glass | Hollow glass bubbles expanding into EV battery enclosures and interventional oncology radioembolization |
| Polymer | PLGA-based biodegradable polymer beads are driving pharma-grade controlled release microspheres growth |
| Ceramics | High-temperature applications in aerospace turbine coatings and electronics encapsulants |
| Fly Ash | Cost-advantaged cenospheres in construction fillers; share declining versus synthetic alternatives |
| Metallic | Niche adoption in additive manufacturing and thermal spray applications |
| Others | Specialty silica and carbon microspheres for electronics and research applications |
Glass microspheres — particularly hollow borosilicate variants — anchor more than half of the global Microspheres Market revenue, leveraging versatility across weight-sensitive composites, oilfield drilling fluids, and FDA-cleared targeted drug delivery particles. Polymer grades are gaining momentum in pharmaceutical applications as injectable microsphere formulations for long-acting therapies expand clinical pipelines.
By Type
| Sub-Segment | Key Trend |
| Hollow | Dominant across automotive, aerospace, oil & gas; preferred for density reduction and thermal insulation |
| Solid | Specialized use in retroreflective coatings and matrix carriers for drug-loaded microparticles |
Hollow microspheres command over 70% of the global Microspheres Market by revenue, reflecting the cross-industry imperative for lightweight, high-strength filler materials. Solid variants serve precision optical and pharmaceutical niches where uniform sphericity and controlled porosity are more critical than density reduction.
By Application
| Sub-Segment | Key Trend |
| Medical Microspheres Market | Y-90 radioembolization and controlled-release microspheres for depot-injection drug delivery |
| Automotive | EV lightweighting programs are driving hollow glass microsphere adoption in structural composites |
| Aerospace | Syntactic foams and thermal protection systems requiring engineered microsphere grades |
| Paints & Coatings | Retroreflective road markings and thermal-insulation paint formulations |
| Oil & Gas | Drilling fluid density reduction and cementing applications |
| Cosmetics | Biodegradable polymer beads replacing banned polyethylene microbeads |
| Composites | Industrial syntactic foams for marine and construction end uses |
| Others | Electronics encapsulants, 3D printing fillers, and research-grade calibration beads |
Medical technology leads the Microspheres Market in revenue contribution, powered by interventional oncology and a rapidly growing pipeline of injectable microsphere formulations. Automotive is the fastest-rising volume segment as global EV adoption accelerates demand for hollow glass microspheres in battery enclosure and underbody composite applications.