Mineral Processing Agglomeration Binders Market Summary
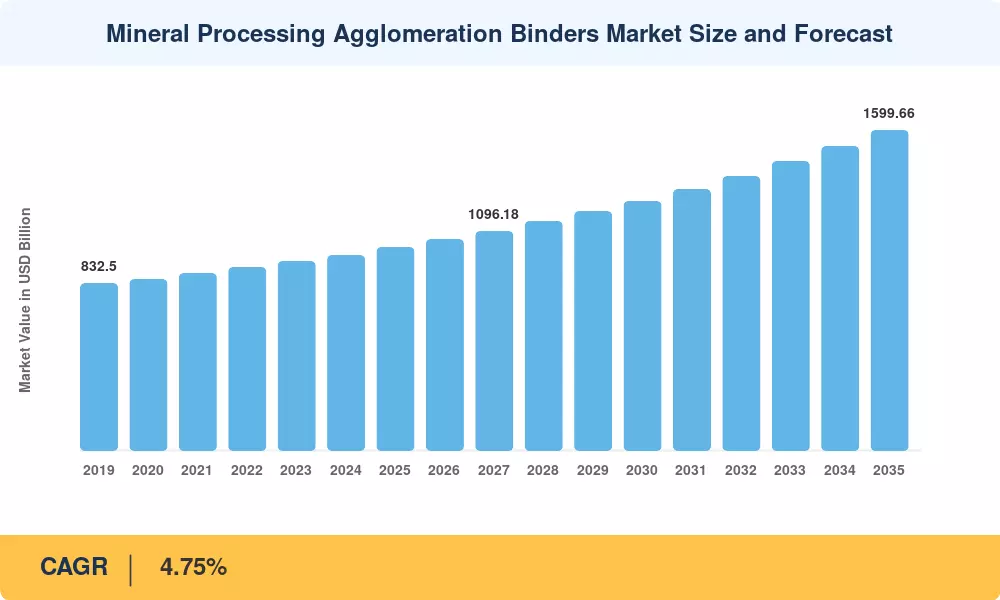
The global mineral processing agglomeration binders market was valued at USD 1,013.603 billion in 2025 and is projected to reach USD 1,599.661 billion by 2035, registering a compound annual growth rate (CAGR) of 4.75% during the 2026–2035 forecast period. Starting from an estimated USD 1,053.323 billion in 2026, the market is propelled by two structural forces: rising mining and mineral processing activities worldwide and the persistent need for improved material handling across beneficiation operations. Global capital expenditure in mining has trended upward since 2021, driven by the electrification of transport and the corresponding surge in demand for battery-grade minerals such as lithium, copper, and nickel. Government-backed mineral security initiatives across the United States, European Union, and India have further catalyzed upstream investments, generating sustained demand for high-performance agglomeration binders [1][2].
With a market share of USD 578.14 million in 2025, the inorganic binders category leads the industry thanks to the long-standing usage of bentonite and cement-based formulations in the pelletization of iron ore. At a CAGR of 5.72%, the polymer-based binders market is becoming the fastest-growing category, indicating a structural shift toward sophisticated formulations that provide excellent green and dry pellet strength while lowering impurity introduction. Abhitech Energycon's creation of the OB-1205 organic binder, which replaces bentonite in iron ore pelletization, reduces SiO₂ and Al2O₃ concentration, and supports low-carbon steelmaking goals, serves as an example of this shift [3]. A further indication of industry-wide convergence around next-generation mineral processing chemistries is Solenis's mid-2024 acquisition of BASF's Magnafloc® and Rheomax® mining flocculants portfolio [4].
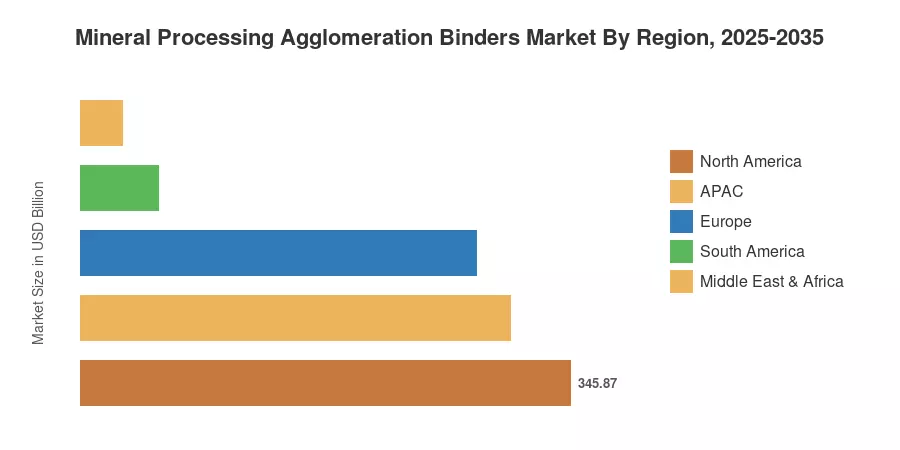
With a contribution of USD 303.49 million in 2025 and the highest regional CAGR of 5.25%, the Asia-Pacific region is the leading market, driven by massive iron ore and copper processing operations in China, India, and Australia. With a CAGR of 4.21%, North America is the fastest-growing region overall, thanks to the increase of lithium extraction in the western United States and Canada, as well as important minerals policy frameworks. With USD 279.73 million, Europe is the second-largest regional market, supported by sustainability-related procurement rules and green steel mandates. In the future, the market is anticipated to gain from the growth of heap leach and briquetting operations, the ongoing diversification of mineral supply chains, and the quickening use of polymer and organic binder technologies [5][6].
Key Report Takeaways
| Segment Dimension | Key Metric | Notes |
| By Ore Type — Dominant | Iron Ore: USD 560.12 Mn (2025) | Largest ore segment; driven by global steel demand |
| By Ore Type — Fastest Growing | Copper: 5.92% CAGR | Rising demand from electrification and EV supply chains |
| By Binders Type — Dominant | Inorganic Binders: USD 578.14 Mn (2025) | Bentonite and cement formulations remain the industry workhorse |
| By Binders Type — Fastest Growing | Polymer-Based Binders: 5.72% CAGR | Superior pellet quality and lower impurity transfer drive adoption |
| By Application — Dominant | Pelletization: USD 481.16 Mn (2025) | Iron ore pellet plants account for the largest binder consumption |
| By Application — Fastest Growing | Briquetting: 5.35% CAGR | Growing interest in waste-to-product agglomeration processes |
| By Region — Dominant | APAC: USD 303.49 Mn (2025) | China and India anchor demand through large-scale ore processing |
| By Region — Fastest Growing | North America: 4.21% CAGR | Critical minerals legislation and lithium project buildout |
| By Binders Type — Gold Ore | Gold: 5.47% CAGR | Heap leach binder demand in Africa and Latin America |
| Overall Market | CAGR 4.75% (2026–2035) | Steady expansion driven by mining capex and binder innovation |
Market Size and Forecast (2019–2035)
MRFR's market sizing methodology combines a bottom-up revenue aggregation from company financials, project-level mineral processing throughput data, and regional trade statistics with a top-down demand model calibrated against global crude ore production and agglomeration capacity utilization rates. Historical values (2019–2024) are validated against published industry data; the base year (2025) is estimated from trailing company disclosures and production surveys; and forecast values (2026–2035) are generated through econometric modeling of mining capex cycles, ore grade trends, and binder technology substitution curves [7].





















.webp?v=1787579943)
