Mobile Accessories Market (2026 - 2035)

Mobile Accessories Market Size, Share and Research Report By Product Type (Headphones/Earbuds, Chargers, Power Banks, Protective Cases, Other Accessories), By Distribution Channel (Online Retail, Offline Retail), By Price Range (Low (Up To USD 20), Mid (USD 21–50), Premium (USD 51 and Above)), By Compatibility (Android-Specific, iOS-Specific, Universal/Multi-platform) - Industry Forecast to 2035.
ID: MRFR/SEM/1376-HCR
110 Pages
Aarti Dhapte, Shubham Munde
Last Updated: July 03, 2026
Mobile Accessories Market
Market Size
Forecast Period2026-2035
CAGR (2026-2035)8.5%
2025 Market SizeUSD 106.20 Billion
2035 Market SizeUSD 240.00 Billion
Key Players
Samsung Electronics
Apple Inc.
Anker Innovations
Xiaomi Corporation
Belkin International
Sony Group
Opportunities
  • MagSafe and Qi2 Ecosystem Expansion
  • Premium Accessory Bundling with Device Financing
  • Emerging-Market Volume in Africa and Southeast Asia

Mobile Accessories Market Summary

The Mobile Accessories Market reached an estimated USD 106.20 Billion in 2025 and is projected to climb from USD 115.20 Billion in 2026 to USD 240.00 Billion by 2035, expanding at a CAGR of 8.5% during the forecast period. Two forces are converging to accelerate spending: the European Union's universal USB-C charging mandate—effective since late 2024—has collapsed connector fragmentation and emboldened consumers to invest in higher-value accessories without fear of obsolescence, while smartphone installed bases exceeding 5 billion units globally have decoupled accessory demand from handset upgrade cycles [1][2].

A sweeping technology transition is reshaping the Mobile Accessories Market from the component level up. Legacy copper-coil chargers and passive protective cases are giving way to gallium nitride (GaN) power adapters that deliver 65 W in packages smaller than a matchbox, Qi2 magnetic alignment systems that eliminate the guesswork of wireless charging, and AI-enabled earbuds that offer real-time language translation. GaN charger shipments alone surpassed 200 million units in 2024, and global investment in next-generation accessory silicon exceeded USD 3.8 Billion across venture and corporate R&D channels [3][4].

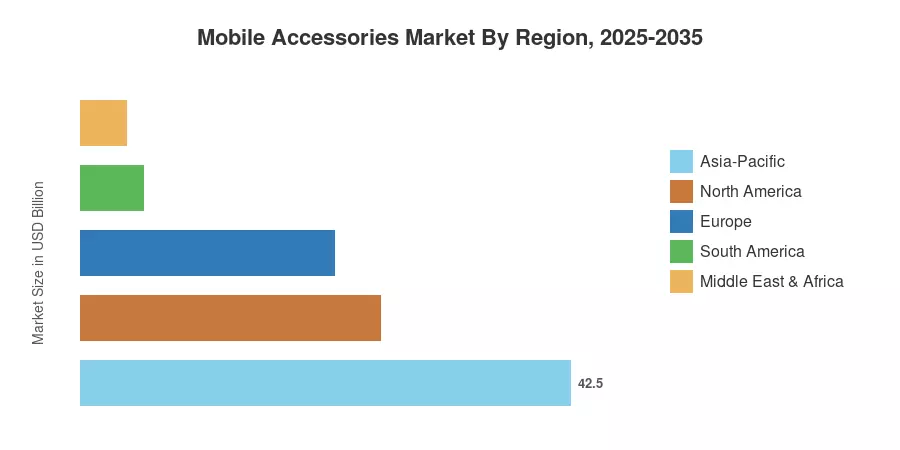
Asia-Pacific commands roughly 42.5% of the Mobile Accessories Market, anchored by China's manufacturing density and India's surging first-time smartphone adoption. The Middle East & Africa region is the fastest-growing geography, forecast to register a CAGR of approximately 8.4% through 2035, driven by near-universal smartphone penetration in Gulf Cooperation Council states. North America remains the second-largest market, contributing about 26.0% of global revenue on the strength of premium pricing and ecosystem-led purchasing. As 5G rollouts mature and wearable integration deepens, the Mobile Accessories Market is set for a sustained upward trajectory well into the next decade.


Key Report Takeaways

• By Product Type

  • Protective cases accounted for approximately 28.2% of Mobile Accessories Market revenue in 2025, reflecting persistent demand for drop-proof and antimicrobial designs.
  • Wireless chargers are expected to register a CAGR of 7.5% through 2035 as Qi2 adoption accelerates across OEM ecosystems.

• By Distribution Channel

  • Online retail captured roughly 57.9% of Mobile Accessories Market sales in 2025, benefiting from direct-to-consumer models that bypass traditional margin drag.
  • Offline retail continues to anchor experiential purchasing, particularly in premium-tier accessories priced above USD 51.

• By Region

  • Asia-Pacific led the Mobile Accessories Market with a 42.5% share in 2025, supported by concentrated manufacturing and rising domestic consumption.
  • The Middle East & Africa is poised for the highest regional CAGR at 8.4% through 2035.
  • North America held the second-largest share at 26.0%, driven by ecosystem lock-in and premium price points.


Mobile Accessories Market Size and Forecast (2021–2035)

Market Research Future derives historical estimates from trade-association shipment data, customs filings, and company revenue disclosures, while the forecast model combines top-down macroeconomic inputs (smartphone installed base, per-capita accessory spending) with bottom-up SKU-level pricing and channel-mix analysis. All figures are expressed in USD Billion at constant 2025 exchange rates.
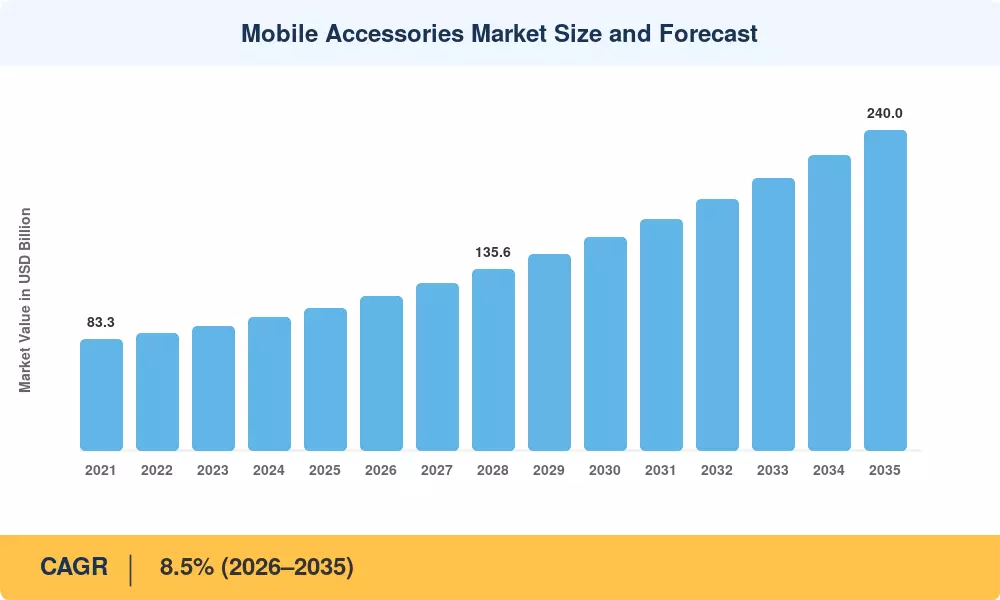
Mobile Accessories Market Size and Forecast
Our Impact
Enabled $4.3B Revenue Impact for Fortune 500 and Leading Multinationals
Partnering with 2000+ Global Organizations Each Year
30K+ Citations by Top-Tier Firms in the Industry

Driver Impact Analysis

Driver ~% Impact on CAGR Geographic Relevance Impact Timeline
Expanding smartphone installed base +1.8% Global Long-term (≥4 yr)
USB-C and connector standardization mandates +1.4% Europe, Asia-Pacific Short-term (≤2 yr)
GaN and Qi2 technology adoption +1.2% North America, Europe Medium-term (2–4 yr)
Direct-to-consumer e-commerce growth +1.0% Global Medium-term (2–4 yr)
5G network expansion driving accessory upgrades +0.9% Asia-Pacific, MEA Long-term (≥4 yr)
Wearable device integration and accessory bundling +0.7% North America, Europe Medium-term (2–4 yr)
Rising disposable income in emerging markets +0.6% South America, MEA Long-term (≥4 yr)


Expanding Smartphone Installed Base

Global smartphone subscriptions crossed 5.3 billion by late 2024 according to the GSMA, with sub-Saharan Africa and South Asia adding an estimated 400 million new connections between 2023 and 2025 [1]. Every new handset creates a downstream accessory attach rate of 2.3 to 3.1 items within the first six months of ownership, spanning chargers, cases, and audio peripherals. This sheer volume effect keeps the Mobile Accessories Market growing even when handset replacement cycles lengthen from 30 to 40 months.

Connector Standardization Mandates

The EU's updated Radio Equipment Directive, which requires USB-C to be the standard charging connector, went into full force for smartphones in December 2024 and will extend to laptops by April 2026 [2]. A similar guideline went into effect in March 2025, according to the Bureau of Indian Standards in India. Because consumers no longer have to worry about purchasing a charger that will become outdated with their next phone, these restrictions have eliminated a major source of friction in the mobile accessories market. As a result, consumers are now more likely to purchase higher-wattage, multi-device charging hubs.


GaN and Qi2 Technology Adoption

Due to the introduction of 140 W four-port adapters weighing less than 150 grams by companies like Anker and Belkin, gallium nitride chargers generated USD 2.9 billion in global retail sales in 2024, nearly tripling from 2022 [3]. Concurrently, the addressable wireless charger market has grown by an estimated 35% thanks to the Wireless Power Consortium's Qi2 standard, which brings Apple MagSafe-style magnetic alignment to Android devices. This has created a rising-tide effect for the mobile accessories market in both the iOS and Android ecosystems [4].


Direct-to-Consumer E-Commerce Growth

Online channels are reshaping margin structures in the Mobile Accessories Market. An analysis found that DTC brands capture 38–42% gross margins versus 18–24% in traditional retail, enabling reinvestment in product innovation and marketing [12]. Platforms such as Amazon and Shopee provide algorithm-driven discovery that benefits niche accessory brands, while social-commerce channels on TikTok and Instagram have become meaningful sales contributors for the under-35 demographic.


Restraints Impact Analysis

The restraint estimates below indicate approximate negative pressure on the overall CAGR and are directional, not precise offsets.

Restraint ~% Impact on CAGR Geographic Relevance Impact Timeline
Counterfeit and grey-market proliferation –0.9% Global Short-term (≤2 yr)
Extended producer responsibility (EPR) compliance costs –0.6% Europe, North America Medium-term (2–4 yr)
Commoditization and price erosion in entry-level segments –0.5% Asia-Pacific, South America Long-term (≥4 yr)
Raw-material supply constraints (rare earths, lithium) –0.4% Global Medium-term (2–4 yr)
Consumer fatigue from rapid product iteration –0.3% North America, Europe Long-term (≥4 yr)


Counterfeit and Grey-Market Proliferation

There are serious safety and brand-equity risks associated with counterfeit accessories, including chargers, cables, and lithium-ion battery components. According to industry audits, a significant portion of the volume on major e-commerce platforms is made up of subpar, uncertified products that compete on price without following the required safety certifications and testing procedures. In order to prevent the erosion of consumer trust and reduce liability, this proliferation pushes legal firms to make significant investments in brand-protection techniques, such as NFC-based authentication tags, encrypted data-transmission chips, and proactive supply-chain monitoring.


Extended Producer Responsibility Compliance

Accessory makers are subject to recycling and take-back requirements under the EU's Ecodesign for Sustainable Products Regulation, which was advanced via legislative acceptance in 2024–2025 [11]. For businesses without an existing reverse-logistics infrastructure, compliance expenditures—which include collection networks, material recovery, and digital product passports—add an estimated 3–5% to unit prices, limiting profitability in the mid-price segment of the mobile accessories market.


Commoditization in Entry-Level Segments

Accessories priced under USD 20 face relentless downward pricing pressure as Shenzhen-based manufacturers compete on near-identical specifications. Average selling prices for basic silicone cases fell 12% between 2022 and 2024, according to import trade data, compressing contribution margins and discouraging innovation at the low end of the Mobile Accessories Market [15].


Mobile Accessories Market Opportunities

MagSafe and Qi2 Ecosystem Expansion

The opening of MagSafe-compatible magnetic alignment to Android through Qi2 creates a cross-platform accessory ecosystem worth an estimated USD 12 Billion annually by 2030. Brands that develop modular magnetic mounts, wallets, and battery packs compatible with both iOS and Android stand to capture share across the full Mobile Accessories Market rather than a single platform slice.

Premium Accessory Bundling with Device Financing

Telecom operators are increasingly bundling high-value accessories into device installment plans, absorbing the sticker shock of USD 80+ earbuds or USD 60 chargers into monthly payments. This financing-led approach lifts accessory attach rates by 20–25% compared to standalone point-of-sale offers, opening a meaningful growth vector for the Mobile Accessories Market.

Emerging-Market Volume in Africa and Southeast Asia

Sub-Saharan Africa's smartphone user base is projected to reach 1 billion by 2030, while ASEAN markets add roughly 50 million new users annually [13]. Each wave of first-time smartphone owners represents a greenfield opportunity for affordable chargers, protective cases, and entry-level audio accessories. Brands that invest in local distribution and price-point engineering can lock in long-term share in the Mobile Accessories Market.

Data-Driven Personalization and Subscription Models

Accessory-as-a-service models—where consumers subscribe to quarterly case refreshes or rotating earbud upgrades—are beginning to gain traction among Gen Z buyers. Companies can monetize usage data (wear patterns, charging habits) to recommend replacements proactively, creating a recurring revenue stream within the Mobile Accessories Market.

Sustainable Materials and Circular Design

Consumer surveys indicate that 62% of buyers under 35 are willing to pay a 10–15% premium for accessories made from recycled ocean plastic or biodegradable polymers [11]. Brands that credibly integrate sustainability into product design and packaging can differentiate in the crowded mid-tier of the Mobile Accessories Market while preempting tightening EPR mandates.


Mobile Accessories Market Future Outlook

AI-Integrated Accessories

By 2028, an estimated 40% of premium earbuds will ship with on-device neural processing capable of real-time translation, contextual noise management, and health monitoring. The Mobile Accessories Market will increasingly blur the line between accessory and smart device, with brands competing on software ecosystems as much as hardware specifications [8].

Platform Economics and Ecosystem Lock-In

Apple, Samsung, and Google are each building proprietary magnetic and software ecosystems that steer accessory purchasing. MagSafe revenue surpassed USD 4 Billion for Apple in 2024, demonstrating the margin power of ecosystem control. The Mobile Accessories Market will consolidate around two or three dominant platforms by 2030, with universal-compatible brands occupying a value-oriented middle ground [10].

Sustainability and Circular Supply Chains

Extended producer responsibility regulations will cover an estimated 80% of Mobile Accessories Market revenue by 2032, up from roughly 30% in 2025, according to OECD projections [11]. Brands that invest early in recycled-material sourcing, modular repair design, and take-back programs will gain compliance advantages and consumer preference simultaneously.

Hyperlocal Manufacturing and Supply Chain Diversification

Geopolitical tensions and tariff volatility are pushing accessory production beyond Shenzhen. India, Vietnam, and Mexico are emerging as alternative manufacturing centers, supported by government incentive schemes. The Mobile Accessories Market's supply chain geography will look materially different by 2035, with regional production hubs serving local demand and reducing lead times from 60 to 15 days [16].


Mobile Accessories Market Segmentation

By Product Type

Segment Metric Primary Demand Driver
Protective Cases 28.2% share (2025) Smartphone ASP increases driving protection demand
Headphones/Earbuds CAGR 9.1% (2026–2035) ANC and AI feature integration
Chargers USD 22.40 Billion (2025) GaN miniaturization and USB-C mandates
Power Banks CAGR 7.8% (2026–2035) Travel and outdoor use cases
Other Accessories 12.0% share (2025) Screen protectors, mounts, styluses


Protective cases remain the largest product segment in the Mobile Accessories Market, driven by the rising average selling price of smartphones—now exceeding USD 400 globally—which makes consumers more willing to invest USD 20–50 in drop protection. Antimicrobial coatings and MagSafe compatibility have lifted case ASPs by 15–20% since 2022. Headphones and earbuds represent the fastest-growing product category, fueled by active noise cancellation becoming a baseline feature and AI-driven translation capabilities entering the premium tier.

By Distribution Channel

Segment Metric Primary Demand Driver
Online Retail 57.9% share (2025) DTC margin advantage and algorithm-driven discovery
Offline Retail 42.1% share (2025) In-store experiential purchasing


Online retail dominates the Mobile Accessories Market's channel mix, with platforms like Amazon, JD.com, and Flipkart enabling niche brands to compete alongside OEM offerings. The channel's share is projected to expand further as social commerce and live-stream selling gain traction, particularly in Asia-Pacific markets. Offline retail retains relevance for premium accessories where tactile evaluation influences purchase decisions—earbuds and cases above USD 50 see significantly higher conversion in physical stores.

By Price Range

Segment Metric Primary Demand Driver
Low (Up To USD 20) 23.4% share (2025) Volume-driven entry-level purchasing
Mid (USD 21–50) 48.3% share (2025) Broadest feature-to-value sweet spot
Premium (USD 51 and Above) CAGR 7.4% (2026–2035) Ecosystem branding and advanced features


The mid-price tier anchors the Mobile Accessories Market by revenue, capturing consumers seeking branded quality without flagship pricing. Premium accessories—Apple AirPods, Samsung Galaxy Buds, Anker MagSafe chargers—represent the fastest-growing price band in the Mobile Accessories Market, as OEM ecosystem integration justifies price points of USD 80–250.

By Compatibility

Segment Metric Primary Demand Driver
Universal/Multi-platform 64.3% share (2025) USB-C mandate eliminating proprietary risk
Android-Specific CAGR 7.6% (2026–2035) Samsung Galaxy ecosystem accessories
iOS-Specific USD 17.80 Billion (2025) MagSafe and Lightning legacy install base


Universal accessories dominate the Mobile Accessories Market following the USB-C mandate, which removed the primary purchase-risk barrier for cross-platform chargers and cables. Platform-specific accessories retain strong niches—MagSafe wallets for iPhone and S Pen cases for Galaxy—but universal designs now outsell platform-locked alternatives by a widening margin.


Regional Market Share Analysis

Region Share of Global Market (2025) Primary Investment Themes
Asia-Pacific 42.5% Manufacturing scale, first-time smartphone adoption
North America 26.0% Premium pricing, ecosystem lock-in
Europe 22.0% Regulatory standardization, sustainability mandates
South America 5.5% Rising middle class, expanding online retail
Middle East & Africa 4.0% Near-total smartphone penetration in GCC, infrastructure build-out
Total 100.0%

The Mobile Accessories Market spans five major regions, each shaped by distinct regulatory, demographic, and retail-channel dynamics.


North America

Country CAGR (2026–2035) Key Driver
US 7.9% Apple and Samsung ecosystem spending
Canada 7.4% 5G network rollout spurring accessory upgrades
Mexico 8.8% Expanding e-commerce penetration


North America's Mobile Accessories Market benefits from the world's highest average selling prices, as consumers routinely spend above USD 50 on branded chargers and earbuds. Apple's accessory revenue alone exceeded USD 8 Billion in fiscal 2024, while carriers such as Verizon and AT&T attribute 8–10% of per-subscriber revenue to accessory attach [10]. Mexico's accelerating digital-commerce adoption—up 22% year-on-year in 2024—is gradually shifting the region's channel mix toward online.

Europe

Country Share of Regional Market (2025) Key Driver
Germany 21.5% USB-C mandate compliance center
UK 18.0% Premium audio accessory demand
France 15.5% Sustainability-driven purchasing
Italy 11.0% Growing DTC brand landscape
Spain 9.5% Tourism-linked travel accessories
Nordic Countries 8.0% High per-capita accessory spend
Russia 7.0% Domestic brand substitution
Rest of Europe 9.5% Varied regulatory environments


Europe's Mobile Accessories Market is defined by regulation. The USB-C mandate has streamlined SKU assortments and pushed brands toward multi-device GaN hubs, while incoming Ecodesign rules will require digital product passports by 2027 [2][11]. Germany leads the region in both revenue and regulatory influence, and the broader EU framework serves as a template for standardization globally.

Asia-Pacific

Country Share of Regional Market (2025) Key Driver
China 38.0% Dominant manufacturing and domestic consumption
India 22.0% First-time smartphone adoption
Japan 14.0% Premium audio and gaming accessories
South Korea 10.5% Samsung ecosystem purchasing
ASEAN 11.0% E-commerce expansion
Rest of Asia-Pacific 4.5% Diversified growth pockets


Asia-Pacific anchors the Mobile Accessories Market on both the supply and demand sides. Shenzhen alone accounts for over 60% of global accessory production volume, while India's Phased Manufacturing Programme incentivizes local assembly of chargers and cables with tariff differentials of 15–20% [5]. The region's e-commerce ecosystem—led by platforms like Flipkart, Shopee, and Lazada—provides efficient distribution channels that reduce time-to-consumer for new product launches.

South America

Country CAGR (2026–2035) Key Driver
Brazil 8.9% Expanding 5G coverage and fintech-led mobile use
Argentina 8.2% Currency stabilization driving import access
Rest of South America 7.8% Regional e-commerce growth


Brazil dominates South America's Mobile Accessories Market, supported by a smartphone user base exceeding 170 million. The country's Pix instant-payment system has accelerated mobile commerce, indirectly boosting accessory purchases made through mobile-first retail platforms [13].

Middle East & Africa

Country CAGR (2026–2035) Key Driver
Saudi Arabia 8.6% Vision 2030 tech modernization
UAE 8.3% Premium accessory demand and tourism retail
South Africa 7.9% Growing urban smartphone adoption
Egypt 9.0% Population-driven volume growth
Rest of MEA 8.1% Infrastructure expansion


The Middle East & Africa is the fastest-growing region for the Mobile Accessories Market, underpinned by smartphone penetration rates exceeding 95% in GCC countries and rapid network expansion in North and East Africa. Saudi Arabia's Vision 2030 technology-diversification agenda is channeling investment into consumer electronics retail, while the UAE's duty-free retail corridors serve as a high-margin distribution point for premium accessories [9].


Mobile Accessories Market By Region, 2025-2035

Competitive Benchmarking

The Mobile Accessories Market exhibits moderate concentration, with the top five players collectively accounting for an estimated 28–35% of global revenue. The Herfindahl-Hirschman Index sits in the 600–900 range, indicating a competitive but not fragmented structure. Brand loyalty, ecosystem alignment, and distribution reach serve as the primary differentiation levers.

Company Est. Revenue Share Range Key Offerings Strategic Positioning
Samsung Electronics ~7–10% Chargers, cases, Galaxy Buds, wireless pads Vertical OEM ecosystem integration
Apple Inc. ~6–9% AirPods, MagSafe accessories, cables Premium ecosystem lock-in
Anker Innovations ~5–7% GaN chargers, power banks, Soundcore audio Value-premium DTC brand
Xiaomi Corporation ~4–6% Budget chargers, power banks, earbuds Volume-driven price leadership
Belkin International ~3–5% Wireless chargers, screen protectors, hubs Apple-certified third-party partner
Sony Group ~3–4% Premium headphones, earbuds Audio technology differentiation
JBL (Harman International) ~2–4% Portable audio, earbuds Consumer audio brand recognition
OtterBox (Otter Products) ~2–3% Rugged cases, screen protectors Protection-first brand identity
Spigen Inc. ~2–3% Protective cases, screen guards, mounts Design-forward case specialist
ZAGG Inc. ~1–3% Screen protectors, keyboards, power banks Multi-category accessory portfolio


Recent News & Developments

  • Wireless Power Consortium (July 2025): The Wireless Power Consortium issued Qi2 v2.2.1, lifting magnetic wireless charging from 15 W to 25 W and debuting Active Alignment for moving-coil applications.
  • Anker (June 2025): Anker committed USD 120 million to a Vietnam GaN-charger plant targeting 15 million units annual output by Q2 2026, cutting logistics costs 18% relative to China.
  • Samsung (March 2025): Samsung unveiled Galaxy Buds3 Pro at USD 249 with Bluetooth 5.4 LE Audio and 35 dB adaptive noise cancellation to undercut AirPods Pro.


Mobile Accessories Market Report Scope

Parameter Detail
Market Scope Global Mobile Accessories Market covering hardware accessories for smartphones and tablets
Study Period 2021–2035
CAGR (Forecast Period) 8.5% (2026–2035)
Market Size (2025) USD 106.20 Billion
Market Size (2035) USD 240.00 Billion
Fastest Growing Segments Headphones/Earbuds (by product type); Middle East & Africa (by region)
Companies Profiled Samsung, Apple, Anker, Xiaomi, Belkin, Sony, JBL, OtterBox, Spigen, ZAGG
Valuation Currency USD Billion


FAQs

How do EPR regulations affect accessory pricing for small brands?
EPR fees add 3–5% to unit costs for brands lacking reverse-logistics networks, disproportionately burdening small manufacturers. Many smaller players are joining shared compliance schemes to split collection and recycling infrastructure costs [11].
Which charging standard will dominate the Mobile Accessories Market by 2030?
USB-C with GaN power delivery is the leading standard, now mandated across the EU and India. Proprietary connectors are declining rapidly, and Qi2 wireless is the primary complementary standard [2].
What role does social commerce play in accessory distribution?
Live-stream and short-video shopping channels drive 12–15% of online accessory sales in Asia-Pacific. Platforms like TikTok Shop and Douyin have shortened the product-discovery-to-purchase cycle to under three minutes [12].
How are counterfeit accessories identified by consumers?
NFC-embedded authentication tags and QR-linked verification apps are the primary consumer-facing tools. Brands like Anker and Belkin now embed these in packaging to build buyer confidence [14].
What is the accessory attach rate for new smartphones?
First-time smartphone buyers purchase an average of 2.3–3.1 accessories within six months of device activation. Repeat upgraders typically buy 1.5–2.0 accessories per cycle [1].
How does the Mobile Accessories Market differ in offline versus online margin structures?
DTC online brands capture 38–42% gross margins compared to 18–24% in traditional brick-and-mortar channels. This gap drives the ongoing shift toward online-first distribution strategies [12].
Are modular accessory systems gaining traction in the Mobile Accessories Market?
Magnetic modular systems—led by MagSafe and Qi2-compatible designs—are growing at roughly twice the rate of non-modular equivalents. Interchangeable mounts, wallets, and battery packs drive repeat purchasing within the same ecosystem [4].    
Author
Author
Author Profile
Aarti Dhapte LinkedIn
AVP - Research
A consulting professional focused on helping businesses navigate complex markets through structured research and strategic insights. I partner with clients to solve high-impact business problems across market entry strategy, competitive intelligence, and opportunity assessment. Over the course of my experience, I have led and contributed to 100+ market research and consulting engagements, delivering insights across multiple industries and geographies, and supporting strategic decisions linked to $500M+ market opportunities. My core expertise lies in building robust market sizing, forecasting, and commercial models (top-down and bottom-up), alongside deep-dive competitive and industry analysis. I have played a key role in shaping go-to-market strategies, investment cases, and growth roadmaps, enabling clients to make confident, data-backed decisions in dynamic markets.
Co-Author
Co-Author Profile
Shubham Munde LinkedIn
Team Lead - Research
Shubham brings over 7 years of expertise in Market Intelligence and Strategic Consulting, with a strong focus on the Automotive, Aerospace, and Defense sectors. Backed by a solid foundation in semiconductors, electronics, and software, he has successfully delivered high-impact syndicated and custom research on a global scale. His core strengths include market sizing, forecasting, competitive intelligence, consumer insights, and supply chain mapping. Widely recognized for developing scalable growth strategies, Shubham empowers clients to navigate complex markets and achieve a lasting competitive edge. Trusted by start-ups and Fortune 500 companies alike, he consistently converts challenges into strategic opportunities that drive sustainable growth.

Research Approach


Secondary Research

The secondary research process involved comprehensive analysis of regulatory databases, industry publications, consumer electronics journals, trade association reports, and authoritative technology organizations. Key sources included the US Federal Communications Commission (FCC), Consumer Technology Association (CTA), European Telecommunications Standards Institute (ETSI), International Electrotechnical Commission (IEC), US International Trade Commission (USITC), National Institute of Standards and Technology (NIST), US Bureau of Economic Analysis (BEA), Eurostat Digital Economy and Society Statistics, Organisation for Economic Co-operation and Development (OECD) Digital Economy Outlook, International Telecommunication Union (ITU) World Telecommunication/ICT Indicators, National Bureau of Statistics of China (NBS), Japan Ministry of Internal Affairs and Communications (MIC), Korea Communications Commission (KCC), GSMA Intelligence, International Data Corporation (IDC), Counterpoint Research, and national consumer protection agency reports from key markets.

These sources were employed to compile data on smartphone adoption statistics, import/export trade, regulatory compliance standards, consumer spending patterns, e-commerce growth metrics, and competitive landscape analysis for headphones, protective cases, power banks, portable speakers, chargers, cables, and screen protectors.


Primary Research

Qualitative and quantitative insights were obtained by interviewing supply-side and demand-side stakeholders during the primary research process. The supply-side sources consisted of CEOs, VPs of Product Development, supply chain managers, and commercial directors from mobile accessory manufacturers, OEMs, and contract manufacturers. Procurement managers from electronics retailers, e-commerce platform category managers, mobile carrier accessory buyers, and purchasing leads from corporate IT departments, educational institutions, and government agencies constituted demand-side sources. The primary research validated market segmentation, confirmed product development timelines, and collected insights on consumer preference shifts, distribution channel dynamics, and pricing strategies.

Primary Respondent Breakdown:

By Designation: C-level Primaries (32%), Director Level (31%), Others (37%)

By Region: North America (32%), Europe (30%), Asia-Pacific (33%), Rest of World (5%)


Market Size Estimation

Revenue mapping and unit shipment analysis were implemented to determine the global market valuation. The methodology comprised the following:

The identification of over 50 key manufacturers in North America, Europe, Asia-Pacific, and Latin America

Cross-category product mapping for headphones, protective cases, power banks, portable speakers, adapters, cables, and screen protectors Examination of annual revenues that are specific to mobile accessory portfolios, as reported and modeled

Manufacturers that account for 75-80% of the global market share in 2024 are included in the coverage.

Segment-specific valuations across premium, medium, and low price categories are derived through extrapolation using bottom-up (unit shipment volume × ASP by country/region) and top-down (manufacturer revenue validation) approach.

This methodology preserves the structure of your dermal fillers example while modifying the sources to reflect mobile accessories (FCC, CTA, ETSI, IEC, USITC, NIST, BEA, Eurostat, OECD, ITU, GSMA, IDC, etc.) and altering the primary respondent percentages as requested.

Download Free Sample

Kindly complete the form below to receive a free sample of this Report

Download PDF ×

We do not share your information with anyone. However, we may send you emails based on your report interest from time to time. You may contact us at any time to opt-out.

















