Segmentation Quick Reference
| Dimension | Sub-Segments | Dominant Segment | Fastest Growing Segment |
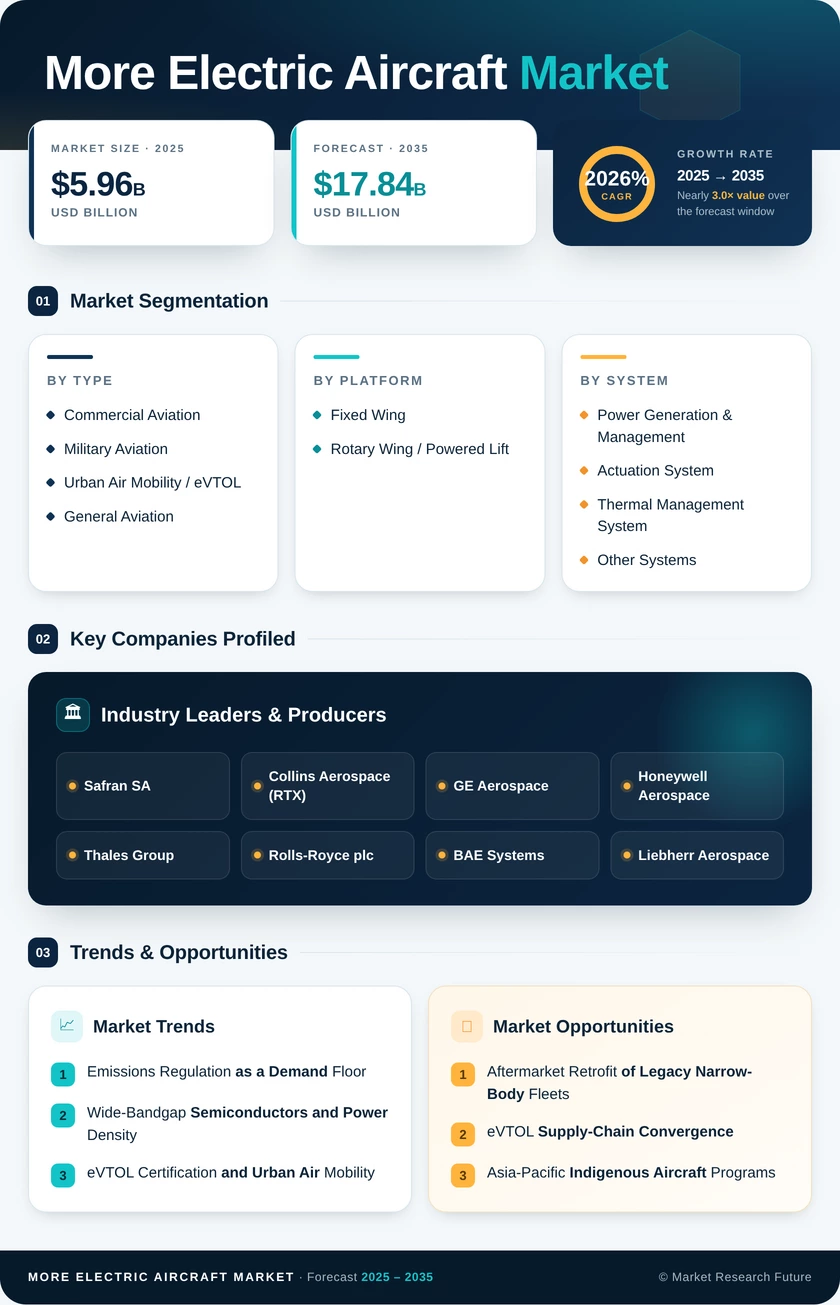
| Aircraft Type | Commercial Aviation, Military Aviation, Urban Air Mobility / eVTOL, General Aviation | Commercial Aviation | Urban Air Mobility / eVTOL |
| Platform | Fixed Wing, Rotary Wing / Powered Lift | Fixed Wing | Rotary Wing / Powered Lift |
| System | Power Generation & Management, Actuation System, Thermal Management System, Other Systems | Power Generation & Management | Actuation System |
| End User | OEM, Aftermarket | OEM | Aftermarket |
| Geography | North America, Europe, Asia-Pacific, South America, Middle East & Africa | North America | Asia-Pacific |
Market Segmentation Overview
By Aircraft Type
| Sub-Segment | Key Trend |
| Commercial Aviation | Wide-body bleed-less architectures and narrow-body electric environmental control adoption |
| Military Aviation | Sixth-generation fighter power demands exceeding 1 MW per engine |
| Urban Air Mobility / eVTOL | FAA powered-lift certification enabling commercial air-taxi operations |
| General Aviation | Electric trainer aircraft entering flight-school fleets |
Commercial aviation remains the revenue anchor, driven by mandatory electrification on new-build programs and growing aftermarket retrofit activity. Urban air mobility platforms represent the highest growth trajectory as certification milestones unlock production-scale deployment.
By Platform
| Sub-Segment | Key Trend |
| Fixed Wing | Progressive increase in onboard electric power from 250 kVA to 1+ MVA on next-generation types |
| Rotary Wing / Powered Lift | eVTOL and hybrid helicopter programs are driving distributed electric propulsion adoption |
Fixed-wing platforms dominate due to the sheer installed base of commercial and military jets undergoing electrification. Rotary-wing and powered-lift configurations grow faster as new entrants bring certified eVTOL and hybrid helicopter designs to market.
By System
| Sub-Segment | Key Trend |
| Power Generation & Management | Transition from constant-frequency generators to variable-frequency SiC-based systems |
| Actuation System | Hydraulic-to-electric actuator swap yielding 20–25% weight reduction per station |
| Thermal Management System | Two-phase cooling and vapor-cycle systems for megawatt-class heat loads |
| Other Systems | Electric taxiing, electric braking, LED lighting, and e-cabin systems |
Power generation and management hardware captures the largest share because every other electrified subsystem depends on upstream power conversion. Electromechanical actuation grows fastest as OEMs prioritize weight savings on primary flight controls.
By End User
| Sub-Segment | Key Trend |
| OEM | Factory-installed MEA systems on new-build aircraft programs |
| Aftermarket | STC-based retrofit kits for in-service fleet modernization |
OEM integration leads near-term revenue, but the aftermarket segment accelerates as airlines seek immediate fuel savings from legacy fleets without waiting for new-generation deliveries.