Nitric Acid Market

Key Players: Yara International, BASF SE, CF Industries, Eurochem Group, OCI N.V., LSB Industries, Grupa Azoty, Deepak Fertilizers (DFPCL)

Nitric Acid Market

Nitric Acid Market Research Report Information By Type (Dilute Nitric Acid, Concentrated Nitric Acid), By Application (Fertilizers, Nitrobenzene, Toluene Di-Isocyanate, Adipic Acid, Nitro Chlorobenzene and Others), By End Use Industry (Agrochemicals, Explosives, Chemical and Others) and By Region - Global Forecast to 2035
ID: MRFR/CnM/1626-CR
128 Pages
Chitranshi Jaiswal
Last Updated: June 05, 2026
 

Nitric Acid Market Summary

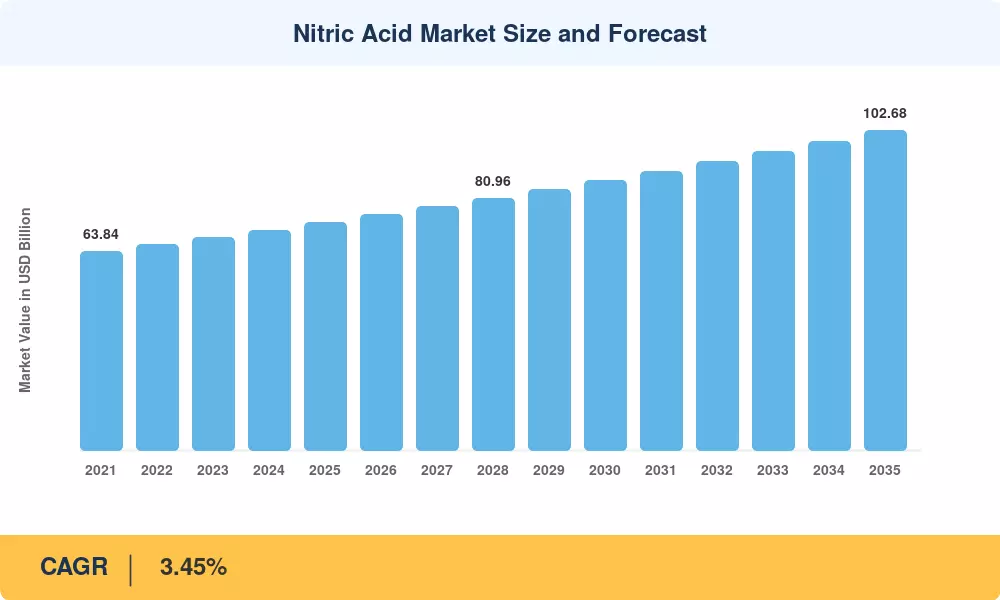
The Nitric Acid Market reached an estimated 73.12 million tons in 2025 and is projected to grow from 75.48 million tons in 2026 to 102.68 million tons by 2035, registering a CAGR of 3.45% during the forecast period. This expansion is underpinned by two converging forces: rising global fertilizer consumption driven by food-security mandates across South and Southeast Asia, and the European Union's Carbon Border Adjustment Mechanism (CBAM), which is redirecting capital toward low-carbon ammonium nitrate production facilities within EU borders [2]. Together, these catalysts are reshaping both the volume trajectory and the geographic investment mix of the Nitric Acid Market.

Production technique changes from generation to generation. Old single-pressure Ostwald facilities, many of which were built in the 1980s, are being replaced with dual-pressure and medium-pressure designs that reduce nitrogen oxide emissions by up to 90% and improve energy recovery. The European Commission’s Industrial Emissions Directive amendment (2024) requires all new acid plants to meet best-available-technique (BAT) standards by 2028, driving an estimated EUR 4.2 billion in total retrofit and greenfield investment throughout the continent [3]. At the same time, new-build plants are increasingly adopting catalytic abatement technologies based on tertiary N₂O breakdown, reducing the carbon intensity of each tonne of acid produced.

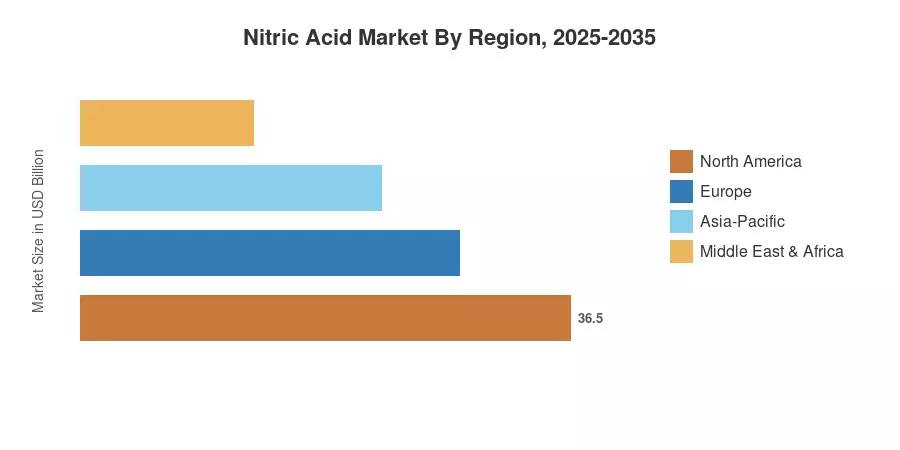
Asia-Pacific dominates the Nitric Acid Market and is the leading consuming region, holding over 63% of the global volume. The area is also the fastest expanding, with a CAGR of 3.49% through 2035, supported by India’s expansion of urea subsidies and China’s ongoing change from coal-based to natural-gas-based ammonia feedstock. Europe is the second largest market with a share of around 19%, followed by North America. With the tightening of decarbonization rules and the growing demand for agricultural chemical ingredients, the competition will be increasingly in favor of those producers who can ensure low-cost feedstock availability or have confirmed low-carbon certifications.

Key Report Takeaways

• By Concentration

  • Weak nitric acid captured 62% of the global Nitric Acid Market volume share in 2025, reflecting entrenched demand from fertilizer chemicals blending operations
  • Concentrated nitric acid is forecast to expand at a 3.92% CAGR through 2035, driven by rising polyamide 6,6 and industrial oxidizing agents applications
  • Fuming and red fuming grades account for less than 4% of total volume but serve critical aerospace and explosive manufacturing chemicals requirements

• By End-User Industry

  • Fertilizers dominated the Nitric Acid Market in 2025 with a 74% revenue share, anchored by ammonium nitrate production for calcium ammonium nitrate (CAN) blends
  • Explosives registered the fastest segment growth at a 4.25% CAGR, fueled by mining expansion across Asia-Pacific and Latin America
  • Chemical manufacturing accounted for USD 3.8 billion in 2025, with inorganic acid compounds and metal treatment chemicals driving specialty demand

• By Regional

  • Asia-Pacific accounted for 63% of the Nitric Acid Market size in 2025 and leads growth through 2035
  • Europe is advancing at a 2.91% CAGR, shaped by CBAM-driven domestic production shifts
  • North America contributed approximately 12% of global volume in 2025


Market Size and Forecast (2021–2035)

MRFR's market sizing integrates bottom-up production capacity audits across 42 countries with top-down demand modeling calibrated against trade-flow databases (UN Comtrade, ITC TradeMap) and validated through primary interviews with 85+ industry participants. Historical volumes (2021–2024) rely on published plant-level output data; forecast volumes (2026–2035) apply regression-adjusted demand elasticities for fertilizer chemicals, explosive manufacturing chemicals, and chemical processing acids end uses.

Nitric Acid Market Size and Forecast
Our Impact
Enabled $4.3B Revenue Impact for Fortune 500 and Leading Multinationals
Partnering with 2000+ Global Organizations Each Year
30K+ Citations by Top-Tier Firms in the Industry
 

Driver Impact Analysis

Driver ~% Impact on CAGR Geographic Relevance Impact Timeline
Global food-security mandates and fertilizer subsidies +0.85% Asia-Pacific, South America Short-term (≤2 yr)
CBAM and low-carbon production incentives +0.55% Europe Medium-term (2–4 yr)
Mining-sector expansion (gold, copper, lithium) +0.50% Asia-Pacific, South America Medium-term (2–4 yr)
Polyamide 6,6 demand in automotive lightweighting +0.40% North America, Europe Long-term (≥4 yr)
Infrastructure stimulus programs (road, tunnel blasting) +0.35% Asia-Pacific, MEA Short-term (≤2 yr)
BAT-compliant plant modernization capex +0.30% Europe, North America Medium-term (2–4 yr)
Electronics-grade acid for semiconductor fabrication +0.20% Asia-Pacific Long-term (≥4 yr)


Food-Security Mandates and Fertilizer Subsidies

India’s Department of Fertilizers initially budgeted INR 1.64 trillion for nutrient subsidies in FY 2024–25, a figure the Union Cabinet later expanded by over INR 244 billion to sustain stable domestic pricing. Concurrently, government initiatives across Bangladesh and Southeast Asia are extending support beyond traditional urea to complex NPK blends. These policy-driven demand floors firmly establish agricultural chemicals as the dominant volume driver for global nitrate production.

CBAM and Decarbonization Incentives

The European Union's Carbon Border Adjustment Mechanism (CBAM) successfully transitioned from its initial October 2023 reporting phase to full carbon-cost equalization on imported fertilizers in January 2026. European chemical facilities utilizing low-carbon ammonia feeds or certified nitrous oxide abatement technologies insulate themselves from these border taxes. This regulatory framework effectively reroutes international trade patterns away from carbon-intensive manufacturing regions toward compliant regional supply networks.

Mining-Sector Expansion

Data from the International Copper Study Group highlights a steady expansion in global mine production, driven by a wave of new extraction initiatives across major corridors. Australia, Chile, Peru, and Indonesia remain the primary geographical clusters for incremental industrial blasting demand. Because civil works and modern open-pit operations rely heavily on blasting-grade ammonium nitrate, the mining industry serves as the primary non-agricultural growth segment for processing acids.


Automotive Lightweighting via Polyamide 6,6

Concentrated nitric acid is the precursor to adipic acid, which feeds into polyamide 6,6 — a resin increasingly favored for under-hood and structural automotive components. OEM lightweighting targets (15–20% mass reduction by 2030) are lifting adipic acid demand by an estimated 4.5% per year, pulling concentrated-grade volumes higher and underpinning the premium end of the industrial acid chemicals value chain [12].


Restraints Impact Analysis

Restraint-impact percentages reflect downward pressure on the baseline CAGR and are directional estimates derived from cost-sensitivity and trade-disruption modeling.

Restraint ~% Impact on CAGR Geographic Relevance Impact Timeline
Natural-gas price volatility –0.45% Europe, South America Short-term (≤2 yr)
Environmental permitting and emission caps –0.30% Europe, North America Medium-term (2–4 yr)
Ammonia feedstock supply concentration –0.25% Global Long-term (≥4 yr)
Substitution risk from nano-urea and bio-stimulants –0.20% Asia-Pacific Medium-term (2–4 yr)
Geopolitical trade restrictions on precursor chemicals –0.15% Europe, Asia-Pacific Short-term (≤2 yr)


Natural-Gas Price Volatility

Ammonia remains the foundational chemical feedstock for the Ostwald process. Because natural gas constitutes the overwhelming majority of synthesis overhead, regional energy price shocks directly impact manufacturing margins. Extreme historical volatility in European TTF baseline pricing highlights this vulnerability. Consequently, manufacturing complexes situated across the US Gulf Coast and the Middle East retain a permanent structural cost advantage over entities relying on unhedged spot-market energy inputs.

Environmental Permitting and Emission Limits

Evolving environmental mandates under the European Union’s Industrial Emissions Directive and the United States Environmental Protection Agency’s New Source Performance Standards impose rigid limits on industrial emissions. Older processing units that cannot systematically integrate modern secondary or tertiary catalytic abatement systems face intense regulatory pressure. These strict, ongoing updates to international air quality rules continue to accelerate the structural phasedown of un-retrofitted chemical manufacturing assets globally.


Substitution Risk from Nano-Urea

The Indian Farmers Fertilizer Cooperative officially commercialized liquid nano-urea, introducing it into global agricultural supply chains as an efficient foliar alternative to traditional solid nitrogen inputs. Government initiatives actively encourage alternative fertilizer applications to optimize nutrient use efficiency and reduce raw import dependencies. These structural shifts in agricultural application methods alter domestic consumption habits, ultimately modifying baseline downstream industrial nitrate volume requirements over time.


Nitric Acid Market Opportunities

Green Ammonia-Fed Acid Plants

Evaluations by international renewable energy bodies confirm that localized green ammonia production costs depend primarily on scaling regional electrolyzer capacity and accessing low-cost renewable power. Nitric acid manufacturing facilities co-located alongside major renewable energy infrastructure corridors—notably within parts of the Middle East, South America, and Australia—position themselves strategically. These geographical alignments allow producers to manufacture low-carbon fertilizer chemicals capable of complying with evolving cross-border carbon border adjustment mechanisms.


Technical Ammonium Nitrate for Critical-Mineral Mining

Comprehensive assessments by the International Energy Agency emphasize that global decarbonization policies are accelerating the demand for critical transition materials, including lithium and copper. Modern open-pit extraction operations and infrastructural developments require substantial volumes of blasting-grade materials to clear overburdens. This sustained expansion in global critical mineral mining activities acts as a major, long-term industrial pull factor for manufacturers of explosive chemical compounds.


Electronics-Grade Specialty Acids

Global semiconductor fabrication facilities utilize ultra-high-purity nitric acid formulations as vital chemical agents for silicon wafer cleaning and precision metal etching processes. Ongoing international investments in domestic microchip fabrication infrastructure continue to expand the physical footprint of high-technology manufacturing centers globally. This infrastructure expansion yields a resilient, high-value demand segment for specialized chemical purifications within the industrial processing acids value chain.


Emerging-Market Capacity Build-Out

Sub-Saharan Africa and Southeast Asia import over 80% of their nitric acid requirements, exposing end users to freight-cost volatility and supply disruptions [14]. Domestic plant construction in Nigeria, Tanzania, and Vietnam — supported by multilateral development financing — can close this import-dependency gap while tapping fast-growing local demand for agricultural chemical ingredients


Nitric Acid Market Future Outlook

Decarbonization and Green Ammonia Integration

Assessments by international renewable energy organizations confirm that global green ammonia capacity expansion depends fundamentally on scaling regional electrolyzer arrays and accessing low-cost renewable power. Nitric acid production assets that proactively integrate green ammonia feedstocks align with emerging international cross-border carbon cost equalization frameworks. This regulatory alignment separates the market into conventional carbon-intensive streams and verified low-carbon alternatives capable of commanding environmental regulatory advantages.

AI-Driven Process Optimization

The deployment of digital twins and advanced automation controls enables chemical manufacturing facilities to continuously monitor and adjust internal catalytic conditions within the Ostwald process. These real-time industrial software solutions optimize internal temperature distribution patterns and help monitor nitrogen oxide transformation loops. By refining automated process parameters, chemical plants reduce operational variability and emissions intensity while maximizing raw chemical feedstock utilization over long-term production periods.


Electrification Supercycle and Critical-Minerals Pull-Through

The International Energy Agency’s critical minerals documentation highlights that global clean energy transitions require massive, sustained capital investments to expand the extraction of copper, lithium, nickel, and rare earth elements. Developing these major, modern open-pit mining operations necessitates substantial volumes of industrial blasting agents to move deep overburdens safely. This structural mineral expansion acts as a primary, long-term non-agricultural volume driver for industrial nitrate processing chemicals.


Nitric Acid Market Segmentation

By Concentration

Segment Key Metric Primary Demand Driver
Weak Nitric Acid 62% volume share (2025) Fertilizer-grade AN and CAN blending
Concentrated Nitric Acid 3.92% CAGR (2026–2035) Adipic acid for polyamide 6,6; industrial oxidizing agents
Fuming / Red Fuming Nitric Acid USD 0.6 billion (2025) Aerospace propellant; specialty defense applications


Weak nitric acid — typically 50–65% concentration — remains the volume backbone of the Nitric Acid Market because nearly three-quarters of global output feeds directly into ammonium nitrate production for fertilizer chemicals and explosive applications. Production economics favor weak acid: single-pressure plants achieve lower capital cost per installed ton, and downstream CAN and AN granulation processes are optimized for dilute acid feed.

Concentrated nitric acid (above 65% and up to 98%) is the faster-moving segment, propelled by adipic acid demand from automotive OEMs pursuing lightweighting through polyamide 6,6 adoption. Chemical processing acids applications — including nitration of toluene for TDI production and organic synthesis intermediates — further support concentrated-grade volume growth. This segment increasingly attracts specialty acid products investment as purity specifications tighten for semiconductor and pharmaceutical end uses.

By End-User Industry

Segment Key Metric Primary Demand Driver
Fertilisers 74% revenue share (2025) Government subsidy programs; CAN and AN blending for agricultural chemical ingredients
Chemical Manufacturing 3.55% CAGR (2026–2035) Adipic acid, TDI, nitrobenzene production
Explosives 4.25% CAGR (2026–2035) Mining expansion; infrastructure tunneling
Aerospace USD 0.4 billion (2025) Propellant-grade oxidizers; defense procurement
Inks/Pigments/Dyes 2.80% CAGR (2026–2035) Organic pigment nitration; packaging-ink demand
Other End-User Industries USD 0.8 billion (2025) Metal treatment chemicals; electronics cleaning


Fertilizers anchor the Nitric Acid Market across every major region. Ammonium nitrate production and calcium ammonium nitrate blending consume the majority of global weak-acid output, with demand trajectories tracking population growth, dietary shifts toward protein-intensive agriculture, and government subsidy frameworks. India, China, Brazil, and Indonesia collectively drive over 55% of fertilizer-grade acid consumption.

Explosives represent the fastest-growing end-user segment, with mining-grade ammonium nitrate demand rising in lockstep with the global electrification supercycle. Open-pit copper, lithium, and gold mines require 15,000–40,000 tons of AN per year for blasting operations, and the pipeline of permitted mine developments through 2030 supports sustained incremental demand for explosive manufacturing chemicals within the Nitric Acid Market.


Regional Market Share Analysis

Region Key Metric Primary Investment Themes
Asia-Pacific 63% market share (2025) Fertilizer subsidies; mining-grade ammonium nitrate production; new gas-based capacity
Europe 3.49% CAGR (2026–2035) CBAM compliance; BAT retrofits; low-carbon CAN production
North America 12% market share (2025) Shale-gas cost advantage; polyamide feedstock; metal treatment chemicals
South America 2.85% CAGR (2026–2035) Mining-driven explosives demand; agricultural expansion
Middle East & Africa USD 1.9 billion (2025) Feedstock-advantaged greenfield plants; import substitution
Total 73.12 Million Tons (2025)

The Nitric Acid Market exhibits a highly concentrated regional structure, with Asia-Pacific and Europe collectively accounting for over 80% of global production and consumption. Regional dynamics are increasingly shaped by feedstock economics, carbon-pricing mechanisms, and agricultural policy frameworks.


North America

Country Key Metric Key Driver
US 78% of regional volume Shale-gas feedstock advantage; adipic acid and chemical processing acids demand
Canada 2.95% CAGR Mining-grade AN for oil-sands and potash operations
Mexico USD 0.4 billion Import-reliant; growing fertilizer chemicals consumption


The United States benefits from Henry Hub natural gas, roughly one-third of European landed costs, giving Gulf Coast acid producers a durable margin cushion. LSB Industries and El Dorado Chemical operate integrated ammonia-to-acid complexes that supply both agricultural chemical ingredients and industrial oxidizing agents to downstream customers. Canada's potash-mining sector in Saskatchewan is a steady consumer of technical-grade ammonium nitrate. At the same time, Mexico's reliance on imports creates opportunities for cross-border supply partnerships within the broader Nitric Acid Market.

Europe

Country Key Metric Key Driver
Germany 22% of the regional share BASF/Yara adipic acid integration; BAT compliance investment
UK 2.78% CAGR Specialty acid products for pharmaceutical intermediates
France USD 1.1 billion Nuclear-powered low-carbon ammonia feed advantage
Italy 3.05% CAGR Explosives for tunnel and infrastructure construction
Spain 8% of regional share CAN blending for Mediterranean agriculture
Nordic Countries 2.65% CAGR Yara's low-emission flagship plants
Russia 18% of regional volume Low-cost gas; export-oriented capacity
Rest of Europe USD 0.9 billion Poland, Czech Republic plant expansions


Europe's acid industry is bifurcating between western producers investing EUR 4+ billion in emission abatement and eastern/Russian facilities prioritizing cost competitiveness. CBAM is accelerating this divergence: from 2026, imported CAN and AN will face carbon-cost adjustments that effectively price out high-emission suppliers, reshaping trade flows within the Nitric Acid Market.

Asia-Pacific

Country Key Metric Key Driver
China 42% of regional volume Coal-to-gas feedstock transition; CAN and AN export growth
India 4.15% CAGR Fertilizer subsidy expansion; new-build acid plants in Gujarat
Japan USD 1.3 billion Electronics-grade specialty acid products; metal treatment chemicals
South Korea 3.28% CAGR Semiconductor-fab ultra-high-purity acid demand
ASEAN 3.95% CAGR Indonesian mining; Vietnamese agricultural chemical ingredients
Rest of Asia-Pacific USD 0.7 billion Bangladesh and Pakistan's fertilizer-grade demand


Asia-Pacific's dominance in the Nitric Acid Market stems from the region's dual role as both the world's largest fertilizer consumer and its most active mining-investment destination. China alone produces over 25 million tons of nitric acid annually. However, environmental crackdowns on coal-based ammonia plants are forcing consolidation toward gas-fed, integrated complexes in Shandong and Inner Mongolia.

South America

Country Key Metric Key Driver
Brazil 58% of regional share Soybean/corn fertilizer demand; mining explosives
Argentina 2.70% CAGR Lithium mining in Jujuy and Salta provinces
Rest of South America USD 0.3 billion Chile and Peru copper-mine blasting AN demand


Brazil's agribusiness sector — the world's largest soybean exporter — underpins steady demand for nitrate-based fertilizer chemicals, while Argentina's emerging lithium-triangle mining operations are generating incremental, explosive manufacturing chemicals consumption across the Nitric Acid Market.

Middle East & Africa

Country Key Metric Key Driver
Saudi Arabia 35% of regional share Feedstock-advantaged ammonia; Ma'aden integration
UAE 3.35% CAGR Industrial diversification; chemical processing acids
South Africa USD 0.5 billion Mining-grade AN for gold and platinum operations
Egypt 3.15% CAGR Fertilizer demand for Nile Delta agriculture
Rest of MEA USD 0.3 billion Sub-Saharan import-substitution opportunity


Saudi Arabia and the UAE leverage gas prices below USD 2/MMBtu to produce ammonia and downstream inorganic acid compounds at globally competitive costs. South Africa's mining sector remains the region's largest single consumer of blasting-grade ammonium nitrate. At the same time, Egyptian demand for nitric acid is tied directly to government-backed agricultural reclamation projects along the New Delta corridor.


Nitric Acid Market By Region, 2025-2035
 

Competitive Benchmarking

The Nitric Acid Market is characterized by a medium concentration with the five-firm concentration ratio (CR5) approximated at 35-42 % for the worldwide volume. The Herfindahl-Hirschman Index (HHI) ranges from 800 to 1,200, which suggests a fragmented tail of regional and single plant operators and integrated international chemical businesses. Competition is about access to feedstock, logistics to end customers and increasingly verifiable credentials for low carbon production.


Company Est. Revenue Share Range Key Offerings Strategic Positioning
Yara International ~8–11% Fertilizer-grade AN/CAN; low-carbon acid production Vertically integrated; CBAM-ready European capacity
BASF SE ~6–9% Concentrated acid for adipic acid; chemical processing acids Integrated Verbund model; polyamide value chain
CF Industries ~5–8% Weak acid; ammonium nitrate production US shale-gas cost advantage; blue-ammonia projects
Eurochem Group ~4–7% Fertilizer chemicals; CAN blending Russian feedstock advantage; global distribution
OCI N.V. ~3–6% Industrial acid chemicals; specialty grades Dual-basin (US/Europe) production footprint
LSB Industries ~2–4% AN for mining; industrial oxidizing agents Focused US producer; carbon-capture integration
Grupa Azoty ~2–4% CAN; fertilizer-grade acid Central European positioning; EU subsidy access
Deepak Fertilizers (DFPCL) ~2–3% Technical AN; mining-grade chemicals India's largest private-sector nitric acid producer
Ostchem (DMCC) ~2–3% Bulk acid; ammonium nitrate production Ukraine-based; CIS market supply
Sasol Limited ~1–3% Explosive manufacturing chemicals; mining-grade AN South African mining-sector integration


Recent News & Developments

Chambal Fertilisers and Chemicals Limited (2026): In June 2026, the company officially commenced production of weak nitric acid at its expanded Gadepan facility in Rajasthan, establishing the vital chemical intermediate step required for its technical ammonium nitrate project.

Deepak Chem Tech Limited (2025): In December 2025, this wholly-owned subsidiary of Deepak Nitrite successfully launched commercial operations at its new, INR 515 crore nitric acid plant in Nandesari, Gujarat, to secure internal supply chain integration.

CF Industries Holdings, Inc. (2025): In October 2025, the company completed the installation of advanced greenhouse gas abatement systems at its Verdigris Nitric Acid complex, mitigating over 600,000 tons of carbon-equivalent emissions annually.


Nitric Acid Market Report Scope

Parameter Detail
Market Scope Global nitric acid production, consumption, and trade by concentration, end-user industry, and geography
Study Period 2021–2035
Historical Period 2021–2024
Base Year 2025
Forecast Period 2026–2035
CAGR (2026–2035) 3.45%
Market Size (2025) 73.12 Million Tons
Market Size (2035) 102.68 Million Tons
Fastest Growing Segment Explosives (by end-user); Concentrated Nitric Acid (by concentration)
Companies Profiled 10 (Yara, BASF, CF Industries, Eurochem, OCI, LSB Industries, Grupa Azoty, DFPCL, Ostchem, Sasol)
Valuation Unit Volume (Million Tons) and USD Million


FAQs

How does natural-gas feedstock pricing affect nitric acid plant-gate margins?

Ammonia serves as the primary chemical feedstock for manufacturing industrial nitric acid. Because ammonia production costs align closely with regional natural gas pricing, fluctuations in energy baseline markets directly dictate the variable cost structure of downstream acid manufacturing. Consequently, sustained energy price volatility compresses or expands plant-gate margins for inorganic acid producers lacking long-term, indexed supply security agreements.


What purity grades distinguish electronics-grade acid from fertilizer-grade product?

Electronics-grade nitric acid requires specialized sub-parts-per-billion metallic impurity limits to ensure material compatibility during silicon wafer cleaning and microchip etching procedures. Achieving this ultra-high-purity grade necessitates dedicated clean-room distillation columns, specialized fluoropolymer storage systems, and integration with ultra-pure water loops. These intensive purification requirements differentiate high-purity electronics chemicals from standard bulk-grade agricultural products.


How does CBAM specifically impact cross-border nitric acid trade flows?

CBAM imposes a carbon-cost surcharge on imported nitrogen fertilizers starting in 2026, effectively pricing out high-emission producers. European buyers increasingly favor domestically produced low-carbon CAN [2].

What capital cost benchmarks apply to a greenfield weak-acid plant today?

Developing a greenfield dual-pressure weak nitric acid manufacturing asset demands significant capital allocation for engineering, procurement, and construction phases.

Total installed costs vary regionally based on available site utilities, localized logistics, and required emissions-abatement systems. Incorporating selective catalytic reduction units and advanced greenhouse gas decomposition systems remains a primary driver of modern asset design expenses

.

How are spent-acid recovery systems changing procurement patterns for metal-finishing end users?

Integrating closed-loop spent-acid recovery systems allows metal-finishing and stainless-steel pickling facilities to process waste streams and reclaim active chemical fractions systematically. This technological shift lowers the baseline volume requirements for fresh acid chemical procurement.

By recycling processing solutions internally, industrial operations mitigate disposal liabilities while stabilizing their chemical input supply chains against market disruptions.


FAQs

What is the current valuation of the Nitric Acid Market as of 2024?

The Nitric Acid Market was valued at 32.94 USD Billion in 2024.

What is the projected market valuation for the Nitric Acid Market in 2035?

The market is projected to reach 49.19 USD Billion by 2035.

What is the expected CAGR for the Nitric Acid Market during the forecast period 2025 - 2035?

The expected CAGR for the Nitric Acid Market during 2025 - 2035 is 3.71%.

Which companies are considered key players in the Nitric Acid Market?

Key players in the Nitric Acid Market include Yara International, CF Industries, Nutrien, BASF, Linde, Air Products and Chemicals, SABIC, OCI Nitrogen, and Koch Industries.

What are the main types of nitric acid and their market valuations?

The market valuations for nitric acid types are 12.0 to 18.0 USD Billion for Dilute Nitric Acid and 20.94 to 31.19 USD Billion for Concentrated Nitric Acid.

What applications drive the demand for nitric acid?

Key applications include Fertilizers (12.0 to 18.0 USD Billion), Nitrobenzene (5.0 to 7.5 USD Billion), and Toluene Di-Isocyanate (4.0 to 6.0 USD Billion).

What are the end-use segments for nitric acid and their respective valuations?

End-use segments include Agrochemicals (10.0 to 15.0 USD Billion), Explosives (8.0 to 12.0 USD Billion), and Chemicals (9.0 to 14.0 USD Billion).

How does the nitric acid market's growth compare across different applications?

The growth appears robust across applications, with Fertilizers leading, followed by Nitrobenzene and Toluene Di-Isocyanate.

What factors are influencing the growth of the Nitric Acid Market?

Factors influencing growth include increasing demand in agrochemicals and explosives, alongside advancements in chemical manufacturing.

What is the potential for future growth in the Nitric Acid Market?

The market may experience substantial growth, driven by rising applications in various industries and a projected valuation increase by 2035.
Author
Author
Author Profile
Chitranshi Jaiswal LinkedIn
Team Lead - Research
Chitranshi is a Team Leader in the Chemicals & Materials (CnM) and Energy & Power (EnP) domains, with 6+ years of experience in market research. She leads and mentors teams to deliver cross-domain projects that equip clients with actionable insights and growth strategies. She is skilled in market estimation, forecasting, competitive benchmarking, and both primary & secondary research, enabling her to turn complex data into decision-ready insights. An engineer and MBA professional, she combines technical expertise with strategic acumen to solve dynamic market challenges. Chitranshi has successfully managed projects that support market entry, investment planning, and competitive positioning, while building strong client relationships. Certified in Advanced Excel & Power BI she leverages data-driven approaches to ensure accuracy, clarity, and impactful outcomes.
Download Free Sample

Kindly complete the form below to receive a free sample of this Report

Download PDF ×

We do not share your information with anyone. However, we may send you emails based on your report interest from time to time. You may contact us at any time to opt-out.