Segmentation Quick Reference
| Dimension | Sub-Segments | Dominant Segment | Fastest Growing Segment |
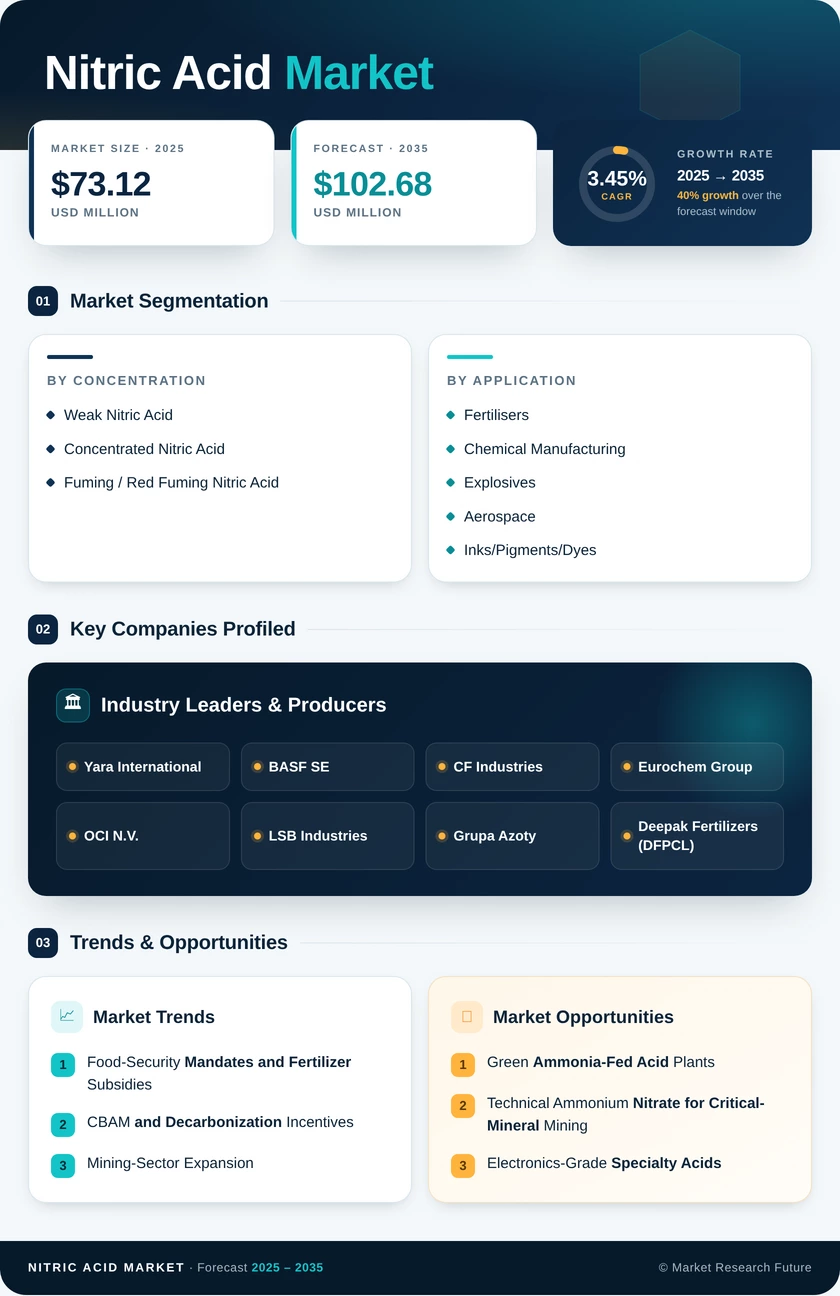
| By Concentration | Weak Nitric Acid; Concentrated Nitric Acid; Fuming / Red Fuming | Weak Nitric Acid (62% share, 2025) | Concentrated Nitric Acid (3.92% CAGR) |
| By End-User Industry | Fertilisers; Chemical Manufacturing; Explosives; Aerospace; Inks/Pigments/Dyes; Other End-User Industries | Fertilizers (74% revenue share, 2025) | Explosives (4.25% CAGR) |
| By Geography | Asia-Pacific; North America; Europe; South America; Middle East & Africa | Asia-Pacific (63% share, 2025) | Asia-Pacific (3.49% CAGR) |
Market Segmentation Overview
By Concentration
| Sub-Segment | Key Trend |
| Weak Nitric Acid | Volume-dominant; anchored by ammonium nitrate production for fertilizer and explosives applications |
| Concentrated Nitric Acid | Fastest growth driven by adipic acid demand for polyamide 6,6 and semiconductor-grade chemical processing |
| Fuming / Red Fuming Nitric Acid | Niche aerospace and defense propellant applications; stable but low-volume demand |
Weak nitric acid continues to serve as the primary building block for global ammonium nitrate production, while concentrated grades are capturing incremental share as downstream polyamide and electronics applications expand. Fuming grades maintain strategic importance for defense procurement but represent a negligible fraction of total market volume.
By End-User Industry
| Sub-Segment | Key Trend |
| Fertilisers | Largest segment: driven by food-security policies and government subsidy programs for CAN/AN blending |
| Chemical Manufacturing | Steady growth via adipic acid, TDI, and nitrobenzene production for automotive and construction chemicals |
| Explosives | Fastest-growing segment; underpinned by copper, lithium, and gold mining expansion globally |
| Aerospace | Stable niche demand for propellant-grade oxidizers in defense and space-launch applications |
| Inks/Pigments/Dyes | Moderate growth tied to organic-pigment nitration and packaging-ink formulation demand |
| Other End-User Industries | Includes metal treatment, electronics cleaning, and pharmaceutical intermediates |
Fertilizer end use dominates the Nitric Acid Market on both a volume and revenue basis, reflecting the essential role of nitrate-based nutrients in global food production. Explosives represent the highest-growth opportunity as critical-mineral mining investment accelerates through 2035, while chemical manufacturing provides a premium-margin outlet for concentrated-grade acid.
By Region
| Sub-Segment | Key Trend |
| Asia-Pacific | Dominant region; led by China and India across fertilizer, mining, and chemical manufacturing demand |
| Europe | CBAM-driven shift toward low-carbon domestic production; BAT-compliant plant modernization underway |
| North America | Shale-gas feedstock advantage supports competitive acid production; polyamide value chain integration. |
| South America | Mining-led explosives demand in Brazil, Chile, Peru; agricultural fertilizer consumption growth |
| Middle East & Africa | Feedstock-advantaged greenfield capacity in Saudi Arabia and the UAE; import substitution in Sub-Saharan Africa |
Asia-Pacific's dominance reflects its position as the world's largest fertilizer consumer and most active mining-investment destination, while Europe's regulatory environment under CBAM is reshaping trade flows and production economics across the Nitric Acid Market.