Offshore Wind Energy Market (2026 - 2035)

Offshore Wind Energy Market Research Report By Foundation Technology (Monopile, Jacket, Floating (Semi-Submersible), Gravity-Based & Other), By Component (Turbines, Substructures & Foundations, Electrical Infrastructure, Installation & Logistics, Operations & Maintenance), By End User (Utilities & Independent Power Producers, Industrial & Corporate Offtakers, Government & State Entities) and By Regional (North America, Europe, South America, Asia Pacific, Middle East and Africa) - Forecast to 2035
ID: MRFR/EnP/27036-HCR
111 Pages
Priya Nagrale
Last Updated: August 24, 2026
Offshore Wind Energy Market
Market Size
Forecast Period2026-2035
CAGR (2026-2035)11.8%
2025 Market SizeUSD 62.4 Billion
2035 Market SizeUSD 189.7 Billion
Key Players
Siemens Gamesa Renewable Energy
Vestas Wind Systems
Ørsted
Mingyang Smart Energy
GE Vernova
RWE
Opportunities
  • Floating Platforms Unlock Deep-Water Coastlines
  • Offshore Hydrogen Coupling
  • Emerging Market Entry Points

Offshore Wind Energy Market Summary

The Offshore Wind Energy Market closed 2025 at roughly USD 62.4 billion and opens the forecast window at USD 68.9 billion in 2026, climbing to USD 189.7 billion by 2035 at a 11.8% CAGR. Two catalysts anchor that trajectory. The European Union's REPowerEU framework locked in a 2030 target exceeding 110 GW of installed offshore capacity, while the U.S. Inflation Reduction Act extended investment tax credits worth up to 30% of qualifying project capital cost through 2032 [1][3]. Neither is aspirational language; both translate directly into signed power purchase agreements and steel in the water. The Offshore Wind Energy Market therefore behaves less like a speculative clean-tech segment and more like regulated infrastructure with a visible order book.

Turbine platforms have changed underneath the industry. Fixed-bottom monopiles carrying 6–8 MW machines — the workhorse of 2015–2020 — are giving way to 15–18 MW direct-drive units and, increasingly, semi-submersible floating substructures capable of operating in water beyond 60 metres. Global investment in offshore wind reached approximately USD 78 billion in 2024, with floating platforms absorbing a rising share of engineering spend [5][9].

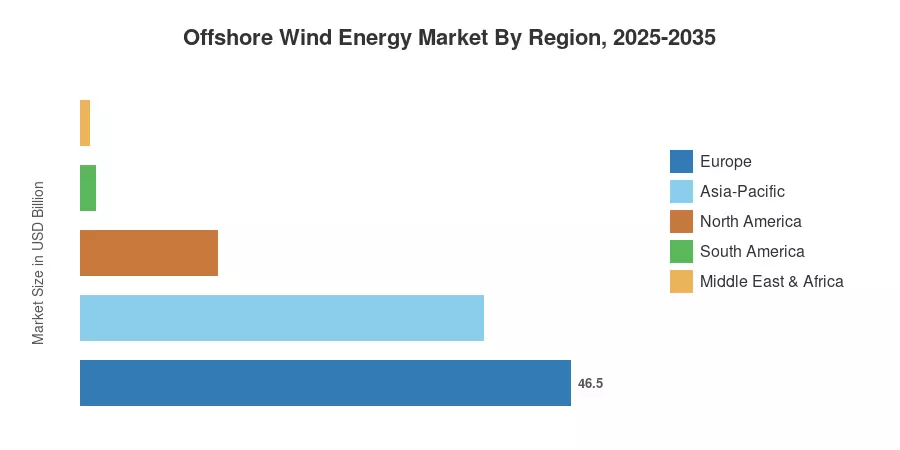
Europe still commands 46.5% of global value, built on three decades of North Sea learning curves. Asia-Pacific grows fastest at 13.6% annually as China, Taiwan, Japan and South Korea convert auction pipelines into construction. North America ranks third, propelled by state-level procurement mandates in New York, New Jersey and Massachusetts. The next decade belongs to whoever solves installation vessel scarcity first.


Key Report Takeaways

• By Foundation Type

  • Fixed-bottom foundations retain 84.2% of Offshore Wind Energy Market value in 2025, reflecting mature supply chains and bankable EPC contracts
  • Floating substructures post the steepest expansion at 24.5% CAGR through 2035 as deep-water leases open off California, Scotland and Japan


• By Turbine Capacity

  • Turbines above 15 MW capacity generate approximately USD 21.3 billion in 2026 order intake

• By Application

  • Utility-scale independent power producers account for 71.5% of installed project ownership
  • Corporate PPA-backed capacity within the Offshore Wind Energy Market grows at 16.2% CAGR as data centre operators contract directly
  • Operations and maintenance services reach USD 14.8 billion annually by 2030

• By Region

  • Europe holds a 46.5% share, anchored by the United Kingdom, Germany, and the Netherlands
  • Asia-Pacific expands at 13.6% CAGR, the fastest of any region
  • North America contributes roughly USD 8.1 billion in 2025 revenue


Market Size and Forecast (2021–2035)

Figures below reconcile bottom-up project pipeline modelling — capacity commissioned per year multiplied by regional capex intensity — against top-down financial disclosures from turbine OEMs, developers and installation contractors. Currency effects are normalised to constant 2025 US dollars. Historical years draw on IRENA capacity statistics and WindEurope commissioning records [2][4].
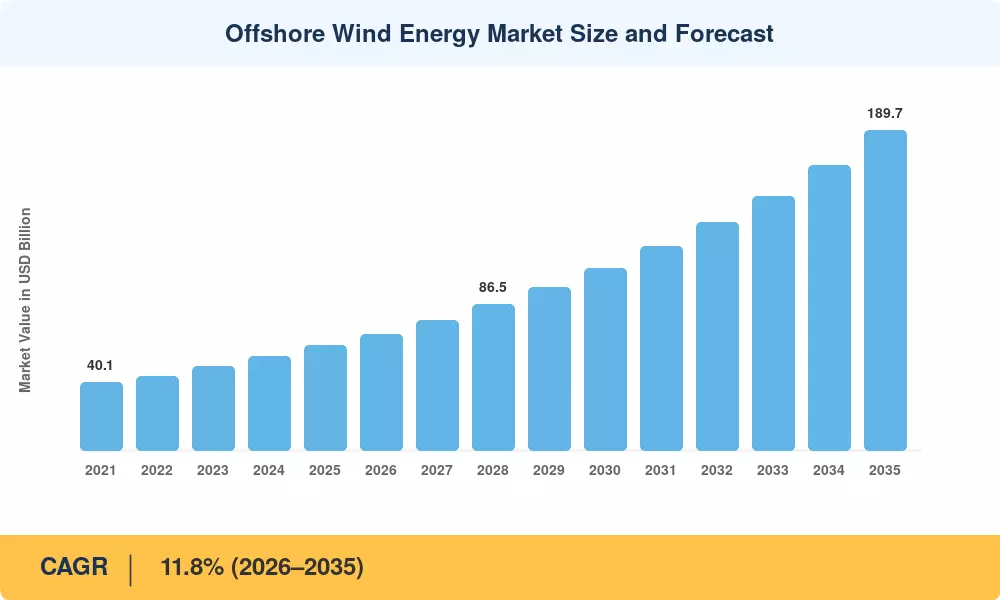
Offshore Wind Energy Market Size and Forecast
Our Impact
Enabled $4.3B Revenue Impact for Fortune 500 and Leading Multinationals
Partnering with 2000+ Global Organizations Each Year
30K+ Citations by Top-Tier Firms in the Industry

Driver Impact Analysis

Driver ~% Impact on CAGR Geographic Relevance Impact Timeline
National decarbonisation mandates 2.6 Global Long-term (≥4 yr)
Turbine capacity scaling and LCOE decline 2.1 Europe, APAC Medium-term (2–4 yr)
Tax credit and subsidy regimes 1.8 North America, Europe Short-term (≤2 yr)
Corporate and data centre PPA demand 1.5 North America, Europe Medium-term (2–4 yr)
Grid interconnection investment 1.3 Global Long-term (≥4 yr)
Floating platform commercialisation 1.2 APAC, Europe Long-term (≥4 yr)
Port and vessel infrastructure buildout 0.9 Global Medium-term (2–4 yr)


Policy Mandates Convert Ambition Into Contracted Capacity

Governments are now issuing contracts instead of targets. The UK's Contracts for Difference Allocation Round de-risks over GBP 20 billion of committed capital over the course of recent rounds by guaranteeing strike prices linked to inflation over 15-year terms [3]. Similar 30-year occupancy rights are granted at auctions under Japan's Sea Area Utilization Act, which makes project funding bankable at commercial spreads. Years before turbines are built, developers price these instruments into equity models.


Corporate Offtake Reshapes the Buyer Base

The monopoly on offtake is no longer held by utilities. In 2024–2025, hyperscale computer operators signed multi-gigawatt renewable contracts, and offshore wind's high capacity factor—typically 45–55% compared to about 25% for onshore solar—makes it exceptionally appealing for facilities needing reliable 24-hour supply [12]. Strike prices above merchant benchmarks are supported by this premium.


Grid Investment Removes the Binding Constraint

Transmission has become the industry's chokepoint. The European Commission estimates that meeting 2030 offshore goals requires roughly EUR 584 billion of grid investment across the decade, including multi-terminal HVDC interconnectors linking national systems [1][8]. Where that capital arrives, curtailment risk falls, and project returns firm up.


Restraints Impact Analysis

Restraint ~% Drag on CAGR Geographic Relevance Impact Timeline
Installation vessel scarcity 1.4 Global Short-term (≤2 yr)
Interest rate and capex inflation 1.2 North America, Europe Short-term (≤2 yr)
Permitting and consenting delays 1.0 North America, APAC Medium-term (2–4 yr)
Grid connection queue congestion 0.8 Europe, North America Medium-term (2–4 yr)
Supply chain concentration risk 0.6 Global Long-term (≥4 yr)


Vessels Set the Physical Ceiling

At current hub heights, fewer than 15 vessels globally are capable of installing 15 MW-class turbines, while newbuild wind turbine installation vessels have lead times of three years and cost between USD 350 and USD 500 million [11]. Between 2022 and 2025, charter rates for capable units nearly doubled. Projects that have reserved slots move forward; those that don't have a complete construction season face higher funding.


Capital Costs Broke Legacy Bid Assumptions

In 2023–2024, fixed-price offtake agreements clashed with double-digit capex inflation and higher benchmark rates, leading several developers to write down or cancel U.S. East Coast projects. One impairment that was made public totaled USD 4 billion [10]. In response, regulators permitted inflation indexation in following solicitations. This is a structural correction, but it requires multiple auction cycles to be implemented.


Permitting Timelines Outlast Political Cycles

Federal environmental review in the United States has historically consumed four to seven years per lease area, spanning fishery consultation, marine mammal assessment, and military airspace coordination [6]. Similar durations apply in parts of Asia-Pacific. Every additional year of pre-construction review raises development cost and exposes projects to changes in the governing administration.


Offshore Wind Energy Market Opportunities

Floating Platforms Unlock Deep-Water Coastlines

Roughly 80% of global offshore wind resource sits in water deeper than 60 metres, beyond fixed-bottom economics. Semi-submersible and tension-leg designs open the entire U.S. West Coast, most of Japan, and the Mediterranean. Commercial-scale floating arrays are expected to move from tens to thousands of megawatts during the forecast window.

Offshore Hydrogen Coupling

Dedicated offshore capacity feeding electrolysers sidesteps grid queues entirely. Pilot projects in the Netherlands and Germany are testing in-array hydrogen production with pipeline export, converting a curtailment liability into a saleable molecule [1].

Emerging Market Entry Points

Vietnam, India, Brazil and Morocco all hold strong coastal wind resources with limited installed capacity. India's National Offshore Wind Policy and Brazil's 2025 offshore legal framework establish the licensing certainty that developers require before committing survey capital.

Data-Driven Service Revenue

Turbine telemetry has become a monetisable asset. Predictive maintenance platforms trained on fleet-wide vibration and SCADA data reduce unplanned downtime materially, and OEMs increasingly sell availability guarantees rather than spare parts. Long-term service agreements now represent a meaningful recurring revenue line.

Repowering the First Generation

Early North Sea arrays commissioned between 2005 and 2012 approach end of design life during the forecast period. Replacing 3 MW machines with modern units on existing consented sites delivers new capacity without new permitting risk.


Offshore Wind Energy Market Future Outlook

Autonomous Inspection and Predictive Operations

Crew transfer to a turbine 80 kilometres offshore costs thousands of dollars per visit. Autonomous drones, crawling blade robots and resident subsea vehicles now handle a growing share of inspection work, and machine-learning models flag gearbox degradation weeks before failure. Operators report meaningful reductions in unplanned downtime, which directly lifts capacity factor and project net present value [12].

Transmission Becomes a Separate Asset Class

Ownership is unbundling. Offshore transmission owner regimes in the UK, and similar structures emerging in the U.S. Atlantic, allow dedicated infrastructure investors to buy export cables and substations at regulated returns while developers focus capital on generation. The International Energy Agency projects global grid investment must roughly double from current levels to meet 2030 renewable targets [2][8].

Electrification Supercycle Pulls Demand Forward

Electricity demand growth has resumed after two flat decades in advanced economies, driven by data centres, heat pumps and vehicle charging. The International Energy Agency expects data centre consumption alone to more than double by 2030 [2]. Offshore wind's scale and capacity factor make it one of the few technologies capable of absorbing gigawatt-block demand additions.

Circularity and Reporting Discipline

Blade recycling has moved from research to procurement requirement. Several European tenders now score bidders on end-of-life plans and embodied carbon, and thermoplastic and chemically recyclable blade resins are entering commercial production. Corporate sustainability disclosure regimes give offtakers a direct reason to pay for verified low-carbon supply chains [4].


Offshore Wind Energy Market Segmentation

By Foundation Technology

The Offshore Wind Energy Market splits most fundamentally along water depth economics.

Segment Metric Primary Demand Driver
Monopile 58.5% share Shallow North Sea and Chinese coastal sites
Jacket 18.4% share Deeper fixed-bottom and larger turbine loads
Floating (semi-submersible) 24.5% CAGR Deep-water leases in Japan, Scotland, California
Gravity-based and other USD 2.1 B (2025) Site-specific seabed conditions


Monopiles dominate because they are simple, fast to install, and supported by a manufacturing base capable of rolling 10-metre-diameter sections. Their limitation is depth: beyond roughly 45 metres, steel tonnage rises faster than energy yield. Jackets fill the intermediate band and are gaining share as 18 MW turbines impose loads that monopiles struggle to carry economically. Floating substructures remain a small revenue slice today but attract disproportionate engineering investment because they address the majority of the world's untapped resource.

By Component

Segment Metric Primary Demand Driver
Turbines 44.0% share Capacity scaling and OEM order backlog
Substructures and foundations USD 14.9 B (2025) Steel fabrication and depth requirements
Electrical infrastructure 12.5% CAGR HVDC export and interconnection buildout
Installation and logistics 15.0% share Vessel charter and port staging costs
Operations and maintenance 13.8% CAGR Growing installed fleet under service contract


Turbines command the largest single share, but the fastest value migration is toward electrical infrastructure and long-term service. As the installed base ages, recurring O&M revenue compounds independently of new commissioning — a structural shift that makes revenue less cyclical than the construction pipeline alone would suggest.

By End User

Segment Metric Primary Demand Driver
Utilities and IPPs 71.5% share Regulated offtake and balance sheet capacity
Industrial and corporate offtakers 16.2% CAGR Data centre and manufacturing PPAs
Government and state entities USD 6.8 B (2025) National energy security programmes


Utilities and independent power producers still develop and own most capacity because offshore projects demand balance sheets few corporates possess. Direct corporate participation grows fastest, however, typically through virtual PPAs and minority equity stakes rather than outright development.


Regional Market Share Analysis

Region 2025 Share (%) Primary Investment Themes
Europe 46.5 Grid interconnection, floating pilots, repowering
Asia-Pacific 38.2 Auction rollout, domestic supply chain, typhoon-rated design
North America 13.0 State procurement, port upgrades, transmission
South America 1.4 Regulatory framework establishment
Middle East & Africa 0.9 Feasibility studies, desalination coupling
Total 100.0

The Offshore Wind Energy Market remains geographically concentrated, though the centre of gravity is shifting eastward as Asian auction pipelines mature.


Europe

Country Share of Region (%) Key Driver
United Kingdom 31.5 Contracts for Difference allocation rounds
Germany 22.0 70 GW by 2045 statutory target
Netherlands 15.5 Tender-based zero-subsidy awards
Denmark 9.0 Energy island development
Rest of Europe 22.0 Poland and France pipeline activation


Europe's advantage is institutional memory. Three decades of North Sea operations produced standardised consenting, mature O&M ports and a service vessel fleet that no other region matches. Poland's Baltic programme and France's Atlantic tenders now extend that base geographically, while Denmark's energy island concept tests whether artificial hubs can aggregate multi-gigawatt clusters into single interconnection points [1][4].

Asia-Pacific

Country 2025 Value (USD B) Key Driver
China 17.2 Provincial capacity allocation
Taiwan 2.4 Round 3 grid connection awards
Japan 1.9 Sea Area Utilisation Act auctions
South Korea 1.1 Renewable Portfolio Standard obligations
Rest of Asia-Pacific 1.2 Vietnam and India early-stage pipeline


China alone commissions more offshore capacity annually than the rest of the world combined, supported by a vertically integrated domestic supply chain that has driven turbine prices well below Western benchmarks [7]. Taiwan pioneered localisation mandates that seeded an Asian component base. Japan's typhoon and seismic conditions demand engineering variants unavailable in European catalogues, creating a distinct design niche.

North America

Country CAGR 2026–2035 (%) Key Driver
United States 15.4 State offtake solicitations and tax credits
Canada 11.0 Nova Scotia licensing framework
Mexico 8.2 Early feasibility assessment


American growth starts from a small base and depends heavily on state-level procurement holding firm through federal policy shifts. New York, New Jersey, Massachusetts, and Maryland have collectively contracted several gigawatts, and port investments at New Bedford and Portsmouth create the staging capacity that earlier rounds lacked [3][6]. Nova Scotia's licensing regime targets 5 GW of offering by 2030.

South America

Country Share of Region (%) Key Driver
Brazil 78.0 2025 offshore regulatory framework
Colombia 14.0 Caribbean coast resource assessment
Rest of South America 8.0 Exploratory surveying


Brazil's coastline carries exceptional capacity factors, and the recently enacted offshore licensing law resolved the tenure question that had frozen dozens of environmental applications. Hydrogen export ambitions to Europe give several proposed projects a second revenue thesis beyond domestic power sales [13].

Middle East & Africa

Country CAGR 2026–2035 (%) Key Driver
Morocco 17.5 European export interconnection studies
South Africa 12.0 Coastal resource mapping
Rest of MEA 9.5 Desalination power coupling


This region remains pre-commercial. Morocco's proximity to Iberian grid infrastructure makes cross-Mediterranean export the most credible near-term thesis, while Gulf states evaluate offshore capacity primarily as a power source for large-scale desalination rather than for grid supply [13].


Offshore Wind Energy Market By Region, 2025-2035

Competitive Benchmarking

Concentration is high at the turbine layer and moderate at the development layer. Estimated HHI for turbine supply sits near 2,100 — a concentrated market by antitrust convention — with the top five OEMs holding roughly 80% of installed nameplate capacity. Development and ownership are considerably more fragmented, with the top five developers controlling an estimated 40–45% of operating capacity. Vertical integration is rising as OEMs move into service and developers acquire installation assets.

Company Est. Revenue Share Range Key Offerings for Offshore Wind Energy Market Strategic Positioning
Siemens Gamesa Renewable Energy ~13–17% Direct-drive turbines, service agreements Western turbine share leader
Vestas Wind Systems ~10–14% V236 platform, long-term service Scale and reliability focus
Ørsted ~8–12% Project development, ownership, O&M Largest pure-play developer
Mingyang Smart Energy ~7–10% Large-rotor and floating turbines Cost-led Asian expansion
GE Vernova ~5–8% Haliade-X platform, grid equipment Turbines plus transmission
RWE ~5–8% Development and generation portfolio Diversified utility developer
Iberdrola ~4–7% Project origination and operations Multi-region development
Goldwind ~4–7% Offshore turbine supply Domestic Chinese volume base
Prysmian Group ~3–5% Submarine and HVDC cables Electrical infrastructure specialist
Van Oord ~2–4% Installation vessels, EPC marine Marine contracting depth


Recent News & Developments

  • European Commission (March 2023): Adopted the Net-Zero Industry Act proposal setting domestic manufacturing benchmarks, giving European component suppliers a policy shield against import competition [1]
  • Ørsted (November 2023): Announced discontinuation of two U.S. East Coast projects with impairments exceeding USD 4 billion, resetting industry expectations on fixed-price offtake risk [10]
  • U.S. Bureau of Ocean Energy Management (February 2024): Completed Central Atlantic lease auction, expanding federally leased acreage available for future solicitations [6]
  • Vestas (May 2024): Confirmed serial production readiness for its 15 MW-class offshore platform, shortening delivery lead times for European projects [5]
  • Japan METI (December 2024): Awarded Round 3 sea area occupancy rights, extending the national pipeline toward the 10 GW-by-2030 objective [13]
  • UK Government (September 2025): Raised administrative strike prices in its allocation round after a prior undersubscribed auction, restoring developer bid participation [3]
  • Prysmian (June 2025): Expanded HVDC submarine cable capacity with a new European plant, addressing a documented interconnection bottleneck [8]
  • Brazil ANEEL (April 2025): Published implementing rules under the national offshore framework, unlocking previously stalled environmental licensing applications [13]


Offshore Wind Energy Market Report Scope

Parameter Detail
Market Scope Global offshore wind generation assets, turbines, foundations, electrical infrastructure, installation services and O&M
Study Period 2021–2035 (Historical 2021–2024; Base Year 2025; Forecast 2026–2035)
CAGR 11.8% (2026–2035)
Market Size Checkpoints USD 62.4 B (2025); USD 68.9 B (2026); USD 108.1 B (2030); USD 189.7 B (2035)
Fastest Growing Segments Floating substructures; electrical infrastructure; corporate offtake
Companies Profiled Siemens Gamesa, Vestas, Ørsted, Mingyang, GE Vernova, RWE, Iberdrola, Goldwind, Prysmian, Van Oord
Valuation Currency Constant 2025 USD

FAQs

How should an investor evaluate contractor counterparty risk in the Offshore Wind Energy Market?
Examine the contractor's committed vessel slots and fabrication yard bookings, not just its balance sheet. Marine EPC firms with owned installation assets carry materially lower schedule risk than those relying on spot charters [11].
What procurement structure protects buyers against capex inflation?
Inflation-indexed offtake agreements, now standard in the UK and several U.S. solicitations, shift commodity risk away from the developer. Fixed nominal strike prices proved unworkable during the 2022–2024 cost cycle [3][10].
How do fixed-bottom and floating technologies compare on procurement lead time?
Floating substructures can be fabricated in conventional shipyards and towed out fully assembled, avoiding scarce heavy-lift vessels. That advantage partly offsets their higher unit cost and shorter track record [9].
What regulatory nuance most often delays projects in the Offshore Wind Energy Market?
Marine spatial conflicts — fisheries, shipping lanes and military exercise areas — cause more delay than environmental objections. Early stakeholder engagement during site selection materially shortens consenting timelines [6].
Are used or repowered turbine components a viable procurement option?
Secondary markets for nacelles and blades remain thin because certification and warranty transfer are unresolved. Most repowering projects install new machines on existing consented sites instead [4].
What integration challenge should grid operators anticipate in the Offshore Wind Energy Market?
High-penetration offshore inflows create localised voltage and inertia issues at landfall points. Grid-forming inverters and synchronous condensers are increasingly specified in connection agreements [8][15].
Which emerging use case deserves attention beyond grid supply?
Direct-coupled offshore hydrogen production bypasses interconnection queues entirely, converting curtailed energy into an exportable commodity. European pilot projects will determine commercial viability by the late 2020s [1].    
Author
Author
Author Profile
Priya Nagrale LinkedIn
Senior Research Analyst
With an experience of over five years in market research industry (Chemicals & Materials domain), I gather and analyze market data from diverse sources to produce results, which are then presented back to a client. Also, provide recommendations based on the findings. As a Senior Research Analyst, I perform quality checks (QC) for market estimations, QC for reports, and handle queries and work extensively on client customizations. Also, handle the responsibilities of client proposals, report planning, report finalization, and execution

Research Approach


Secondary Research

The secondary research process involved comprehensive analysis of regulatory databases, peer-reviewed energy journals, technical publications, and authoritative energy organizations. Key sources included the International Energy Agency (IEA), International Renewable Energy Agency (IRENA), Global Wind Energy Council (GWEC), WindEurope, National Renewable Energy Laboratory (NREL), US Department of Energy (DOE) - Wind Energy Technologies Office, Bureau of Ocean Energy Management (BOEM), European Commission - Directorate-General for Energy, UK Department for Energy Security and Net Zero, German Federal Maritime and Hydrographic Agency (BSH), China National Energy Administration (NEA), Japan Ministry of Economy, Trade and Industry (METI), International Electrotechnical Commission (IEC) - TC 88 Wind Energy Generation Systems, DNV Energy Systems Reports, Wood Mackenzie Energy Research, BloombergNEF, International Maritime Organization (IMO), European Investment Bank (EIB) Energy Lending Reports, and national energy ministry reports from key offshore wind markets. These sources were used to collect installed capacity statistics, regulatory approval data, grid connection metrics, water depth project distributions, foundation technology adoption rates, turbine capacity trends, and market landscape analysis for monopile, jacket, tripile, and gravity-based foundation systems, as well as voltage level infrastructure (33 kV, 66 kV, 132 kV, 220 kV, 400 kV) and grid connection architectures.


Primary Research

In order to gather both qualitative and quantitative insights, supply-side and demand-side stakeholders were interviewed during the primary research process. CEOs, chief technology officers, heads of offshore engineering, vice presidents of project development, regulatory affairs directors, and commercial leads from offshore wind turbine producers, foundation builders, operators of offshore installation vessels, cable suppliers, and wind farm developers were among the supply-side sources. Chief investment officers from utility firms, grid operators, managers of offshore wind projects, procurement leads from energy majors, and policy advisers from energy ministries were examples of demand-side sources.

Primary research validated market segmentation across turbine capacity tiers (Up to 3 MW, 3-6 MW, 6-10 MW, Above 10 MW), confirmed water depth project pipelines (Shallow 0-50m, Transitional 50-200m, Deep >200m), verified foundation technology preferences, assessed voltage level infrastructure requirements, and gathered insights on grid connection strategies, levelized cost of energy (LCOE) trajectories, auction pricing dynamics, and supply chain bottlenecks.

Primary Respondent Breakdown:

By Designation: C-level Primaries (28%), Director Level (35%), Others (37%)

By Region: North America (28%), Europe (32%), Asia-Pacific (35%), Rest of World (5%)


Market Size Estimation

Global market valuation was derived through capacity installation mapping and revenue analysis across the value chain. The methodology included:

Identification of 60+ key stakeholders across turbine OEMs, foundation suppliers, cable manufacturers, installation vessel operators, and project developers in North America, Europe, Asia-Pacific, and emerging markets

Technology mapping across turbine capacity segments (Up to 3 MW, 3-6 MW, 6-10 MW, Above 10 MW), water depth categories (Shallow, Transitional, Deep), foundation types (Monopile, Jacket, Tripile, Gravity-based), voltage levels (33 kV through 400 kV), and grid connection configurations

Analysis of reported and modeled annual revenues specific to offshore wind portfolios, including turbine supply, foundation fabrication, offshore installation, and O&M services

Coverage of manufacturers and developers representing 75-80% of global installed capacity and pipeline projects as of 2024

Extrapolation using bottom-up (installed capacity × CapEx/OpEx by country and water depth) and top-down (developer and OEM revenue validation) approaches to derive segment-specific valuations, incorporating capacity factor variations, foundation cost differentials by depth, and grid connection infrastructure investments

Download Free Sample

Kindly complete the form below to receive a free sample of this Report

* Please use a valid business email

Download PDF ×

We do not share your information with anyone. However, we may send you emails based on your report interest from time to time. You may contact us at any time to opt-out.
















