Optical Emission Spectroscopy Market Summary
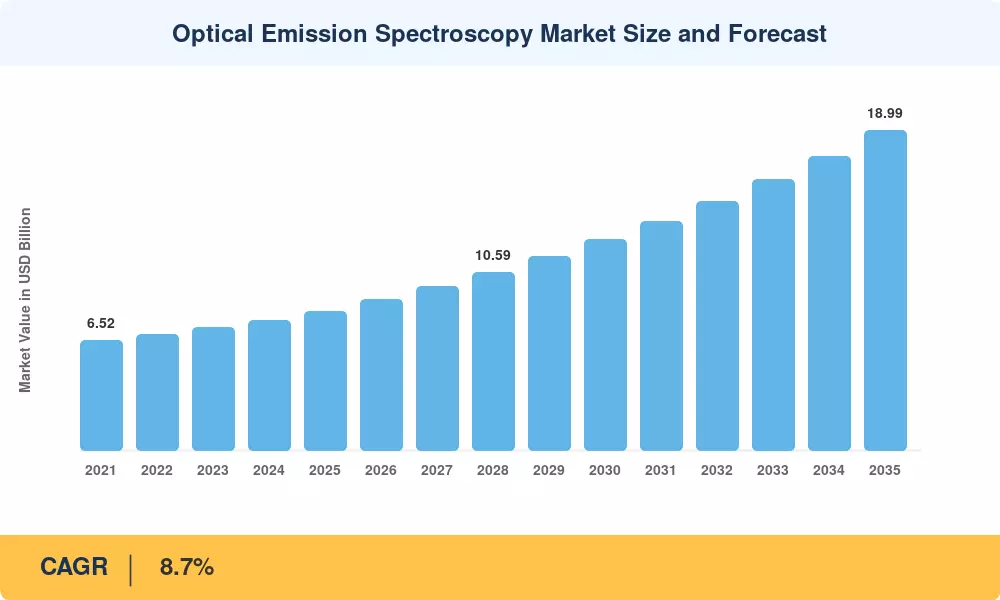
The Optical Emission Spectroscopy Market reached an estimated USD 8.24 Billion in 2025 and is projected to climb from USD 8.96 Billion in 2026 to USD 18.99 Billion by 2035, expanding at an 8.7% CAGR across the forecast window. Tightening quality-assurance mandates in metals processing, combined with accelerating capital expenditure on smart manufacturing lines across Asia and North America, have established a durable demand baseline for advanced elemental-analysis platforms [1][2].
A generational technology shift is reshaping the Optical Emission Spectroscopy Market. Legacy wet-chemistry methods and single-channel analyzers are giving way to high-resolution ICP-OES systems capable of detecting impurities at part-per-trillion levels. Semiconductor fabs alone are expected to spend more than USD 130 Billion on equipment upgrades through 2030 [3], and a meaningful share of that budget flows toward purity-verification instrumentation. Circular-economy legislation in the EU and North America has doubled the importance of real-time alloy identification in scrap-metal recycling streams, pushing adoption of portable spectrometers beyond the laboratory [4].
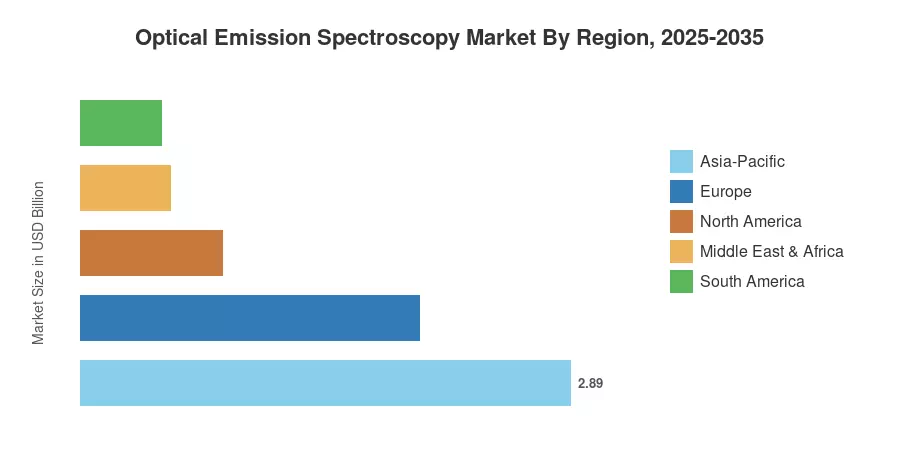
Asia-Pacific commands roughly 35.1% of the Optical Emission Spectroscopy Market, driven by China's foundry capacity and India's expanding automotive sector. North America is the fastest-growing region, posting a projected 10.2% CAGR through 2035 as reshoring incentives and EV battery-material verification fuel instrumentation demand. Europe holds the second-largest share at 24.3%, with strict REACH compliance requirements sustaining replacement cycles for aging spectrometer fleets.
Key Report Takeaways
• By Component
- Equipment accounted for 72.0% of the Optical Emission Spectroscopy Market in 2024, reflecting the capital-intensive nature of high-precision spectrometers.
- Services are forecast to register an 11.1% CAGR through 2035, led by calibration, maintenance, and method-development contracts.
• By Technique
- Arc/Spark OES held a 51.3% revenue share in 2024, anchored by its dominance in metal composition analysis across foundries.
- ICP-OES is projected to grow at a 10.5% CAGR, fueled by semiconductor and environmental testing requirements.
• By Region
- Asia-Pacific led the Optical Emission Spectroscopy Market with a 35.1% share in 2024.
- North America is expected to advance at a 10.2% CAGR through 2035, the fastest among all regions.
Optical Emission Spectroscopy Market Size and Forecast (2021–2035)
Market sizing relies on bottom-up revenue analysis of equipment shipments, software licenses, and service contracts across 28 countries, cross-validated against customs trade data and manufacturer filings. Historical figures are actual; forecast values apply the calibrated 8.7% CAGR.