Segmentation Quick Reference
| Dimension | Sub-Segments | Dominant Segment | Fastest Growing Segment |
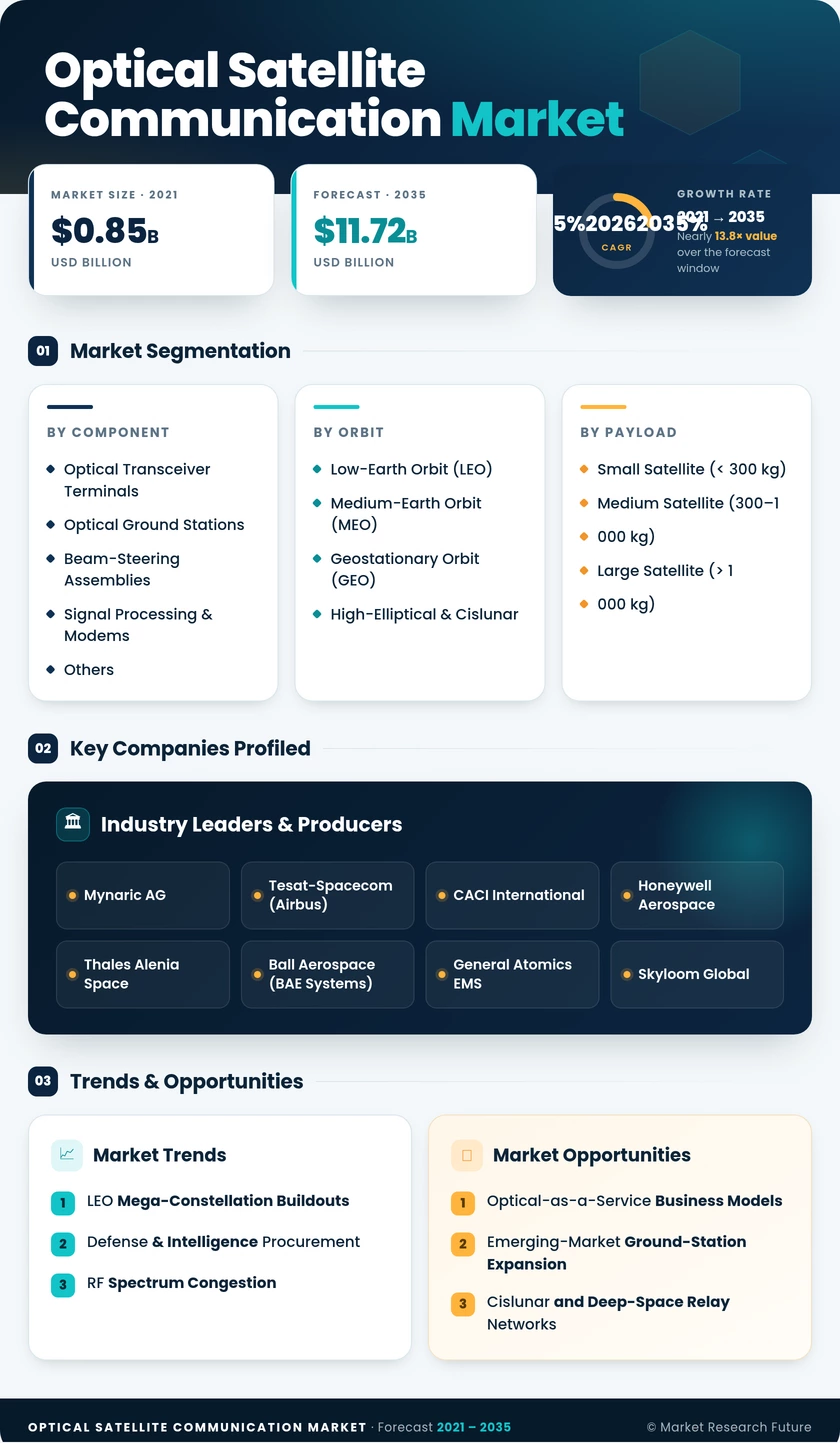
| Component | Optical Transceiver Terminals, Optical Ground Stations, Beam-Steering Assemblies, Signal Processing & Modems, Others | Optical Transceiver Terminals | Beam-Steering Assemblies |
| Orbit | Low-Earth Orbit (LEO), Medium-Earth Orbit (MEO), Geostationary Orbit (GEO), High-Elliptical & Cislunar | Low-Earth Orbit (LEO) | High-Elliptical & Cislunar |
| Payload | Small Satellite (< 300 kg), Medium Satellite (300–1,000 kg), Large Satellite (> 1,000 kg) | Small Satellite | Medium Satellite |
| End-User | Government & Defense, Commercial Telecommunications, Academic & Scientific, Others | Government & Defense | Academic & Scientific |
| Geography | North America, Europe, Asia-Pacific, South America, Middle East & Africa | North America | Asia-Pacific |
Market Segmentation Overview
By Component
| Sub-Segment | Key Trend |
| Optical Transceiver Terminals | Volume procurement driven by LEO mega-constellation deployment schedules |
| Optical Ground Stations | Site-diversity expansion across multiple climate zones to mitigate atmospheric attenuation |
| Beam-Steering Assemblies | MEMS and piezoelectric actuator innovations enabling sub-microradian pointing accuracy |
| Signal Processing & Modems | Transition to coherent detection and higher-order modulation for 100+ Gbps throughput |
| Others (Cabling, Mounts, Thermal) | Thermal management subsystems gaining importance for high-power GEO relay terminals |
Component segmentation reflects the hardware supply chain supporting laser communication payloads. Optical transceiver terminals account for the largest revenue share and drive qualification cycles for the broader ecosystem, while beam-steering assemblies represent the fastest-growing sub-segment as adaptive-optics requirements intensify.
By Orbit
| Sub-Segment | Key Trend |
| Low-Earth Orbit (LEO) | Dominant by unit volume; Starlink, Kuiper, and Lightspeed constellations drive demand |
| Medium-Earth Orbit (MEO) | Navigation-augmentation and regional-relay missions expanding laser payload adoption |
| Geostationary Orbit (GEO) | Relay-hub positioning for always-on LEO-to-ground data paths |
| High-Elliptical & Cislunar | Artemis and lunar relay missions creating premium-margin opportunities |
Orbit segmentation captures the deployment altitude driving terminal specifications and link-budget requirements. LEO dominates volume while cislunar and high-elliptical orbits represent emerging frontiers for optical relay infrastructure.
By Payload
| Sub-Segment | Key Trend |
| Small Satellite (< 300 kg) | CubeSat and microsatellite constellations deploying compact laser terminals at scale |
| Medium Satellite (300–1,000 kg) | Defense and commercial imaging buses integrating higher-power optical payloads |
| Large Satellite (> 1,000 kg) | Flagship GEO relay and deep-space missions requiring large-aperture optical systems |
Payload segmentation aligns with spacecraft bus classification, determining the size, weight, and power envelope available for optical communication hardware. Small satellites lead by unit count, but medium satellites are gaining share as defense programs demand higher-throughput terminals.
By End-User
| Sub-Segment | Key Trend |
| Government & Defense | Sovereign communication hardening and ISR data relay drive majority procurement |
| Commercial Telecommunications | Broadband constellation operators transitioning from RF to optical inter-satellite trunks |
| Academic & Scientific | Earth-observation and deep-space research missions requiring high-data-rate downlinks |
| Others (Civil, Humanitarian) | Disaster-response and humanitarian connectivity programs exploring optical relay solutions |
End-user segmentation reflects the buyer landscape. Government and defense programs dominate current spending, while commercial telecommunications and academic users are accelerating adoption as laser terminal costs decrease and interoperability standards mature.
By Geography
| Sub-Segment | Key Trend |
| North America | Pentagon procurement and Silicon Valley investment anchor the largest regional market |
| Europe | EDRS heritage, IRIS² constellation, and EuroQCI initiative sustain institutional demand |
| Asia-Pacific | China's 100 Gbps demos, India's ISRO roadmap, and Japan's LUCAS mission drive fastest growth |
| South America | Ground-station site diversity and broadband backhaul create emerging opportunities |
| Middle East & Africa | Smart-city backhaul, defense modernization, and relay hosting expand nascent demand |
Geographic segmentation highlights regional investment drivers and growth trajectories. North America leads in absolute market size, while Asia-Pacific posts the highest CAGR as national space agencies and commercial operators accelerate optical payload deployment.