Orthodontic Supplies Market Summary
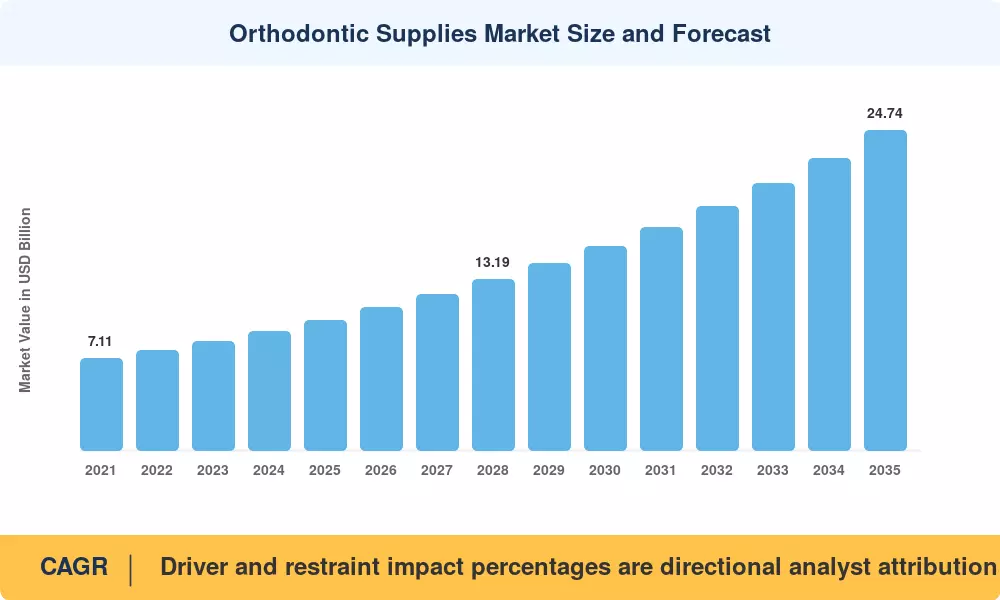
The Orthodontic Supplies Market closed 2025 at USD 10.07 billion and enters the forecast window at USD 11.02 billion in 2026, reaching USD 24.74 billion by 2035 at a 9.4% CAGR. Two catalysts anchor that trajectory. The U.S. Centers for Medicare & Medicaid Services expanded pediatric dental benchmark coverage across 34 state Medicaid programs between 2023 and 2025, pulling roughly 4.1 million additional adolescents into screening pathways [1]. India's Ayushman Bharat network, meanwhile, added dental service lines at more than 1,600 health and wellness centres [2].
Practice workflows are being rebuilt from the chair outward. Alginate impressions, plaster models, and hand-bent wires are giving way to intraoral scanning, cloud treatment planning, and chairside resin printing. Align Technology alone reported cumulative capital deployment above USD 1.2 billion in digital platform and manufacturing capacity through 2024 [3]. Heat-activated nickel-titanium archwires and self-ligating brackets now ship as standard inventory rather than premium upgrades.
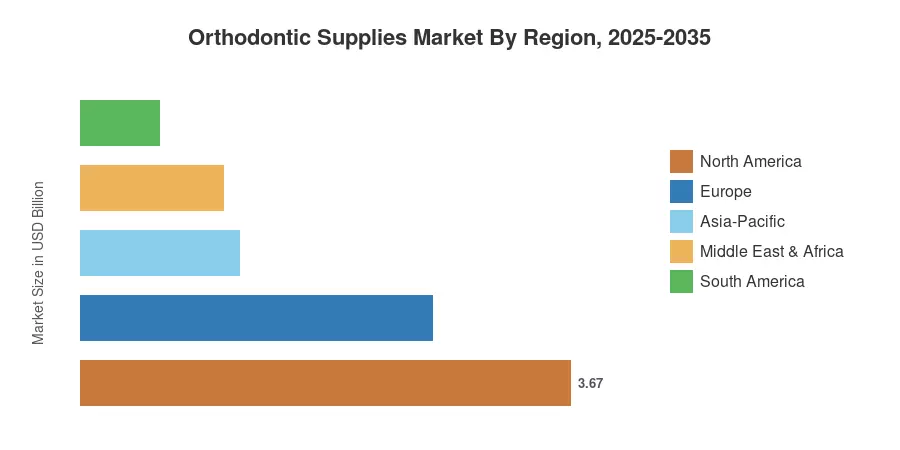
North America holds 36.4% of the Orthodontic Supplies Market on the strength of insurance penetration and dense specialist supply. Asia-Pacific compounds fastest at 11.8%, propelled by China's aligner manufacturing base and India's clinic buildout. Europe follows at 26.2%, where MDR-compliant ceramic systems command premium pricing. The next decade belongs to whoever industrialises personalisation at scale.
Key Report Takeaways
• By Product Type
- Clear aligners post the strongest expansion in the Orthodontic Supplies Market at a 12.6% CAGR through 2035, overtaking fixed appliances on value.
- Brackets retain 24.6% of global revenue, sustained by self-ligating and ceramic upgrade cycles.
- Retainers contribute 10.8% share, buoyed by lifetime retention protocols now standard in most treatment plans.
• By Patient Group
- Teenagers account for 46.5% of demand, the single largest cohort in the Orthodontic Supplies Market.
- Adults grow at 11.4% CAGR as aesthetic and pre-restorative alignment cases multiply.
• By End User
- Dental clinics deliver 61.3% of consumption, with hospital orthodontics concentrated in craniofacial and cleft programmes.
• By Region
- North America commands a 36.4% share, led by U.S. group practice purchasing.
- Asia-Pacific advances at 11.8% CAGR, the fastest of any region.
- Middle East & Africa reaches USD 0.47 billion in 2025, small but structurally underserved.
Market Size and Forecast (2021–2035)
Estimates blend bottom-up shipment modelling across nine product categories with top-down triangulation against audited filings from twelve listed suppliers, national dental association procedure registries, and customs-level trade data for orthodontic appliances. Base-year values were reconciled against practice-level consumable spend surveys covering more than 3,400 clinics.





















.webp?v=1787579628)
