Orthopedic Implants Market (2026 - 2035)

Orthopedic Implant Market Research Report By Product Type (Spinal Implants, Reconstructive Joint Implants, Orthobiologics, Others), By Biomaterial (Metallic, Ceramic, Others), By End User (Hospitals & Ambulatory Surgery, Orthopedic Clinics, Others) and By Regional (North America, Europe, South America, Asia Pacific, Middle East and Africa) - Industry Forecast to 2035.
ID: MRFR/MED/0342-HCR
110 Pages
Vikita Thakur, Nidhi Mandole
Last Updated: July 17, 2026
Orthopedic Implants Market
Market Size
Forecast Period2026-2035
CAGR (2026-2035)4.96%
2025 Market SizeUSD 63.50 Billion
2035 Market SizeUSD 103.05 Billion
Key Players
Johnson & Johnson
Stryker Corporation
Zimmer Biomet Holdings
Medtronic plc
Smith & Nephew plc
Globus Medical Inc.
Opportunities
  • Outpatient Total Joint Replacement in ASCs
  • Robotic Platform Ecosystem Lock-In
  • Emerging-Market Insurance Expansion

Orthopedic Implants Market Summary

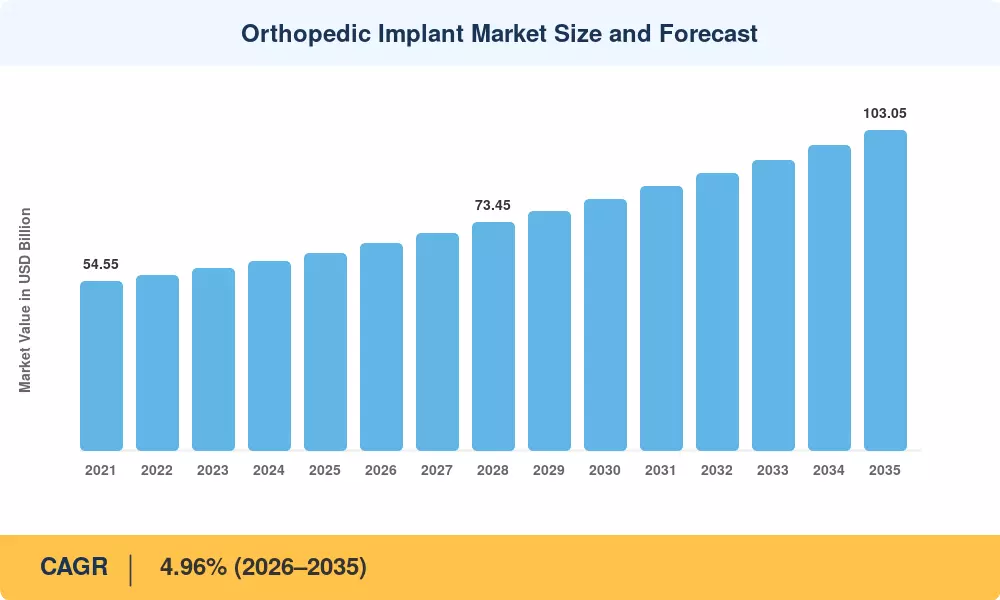
The Orthopedic Implants Market reached USD 63.50 Billion in 2025 and is projected to grow from USD 66.65 Billion in 2026 to USD 103.05 Billion by 2035, registering a CAGR of 4.96% during the forecast period (2026–2035). Aging demographics across developed economies — the WHO estimates the global population aged 60+ will double to 2.1 billion by 2050 — paired with surging osteoarthritis prevalence, are channeling sustained capital into the Orthopedic Implants Market [1]. Payers and governments alike are expanding reimbursement pathways for outpatient joint procedures, accelerating procedure volumes in ambulatory settings.

A technology inflection point is reshaping procurement dynamics. Conventional cemented and uncemented implants still command the majority of installed bases, yet robotic-assisted surgical platforms, three-dimensional (3-D) printed patient-specific devices, and AI-enabled pre-operative planning tools are rewriting clinical workflows. Stryker's Mako platform, for instance, surpassed 2,500 cumulative system placements globally by mid-2025, while the FDA cleared more than 180 3-D printed orthopedic devices between 2020 and 2025 [2]. These advances compress operating times, improve alignment accuracy, and reduce revision rates — all of which strengthen the long-term value proposition of the Orthopedic Implants Market.

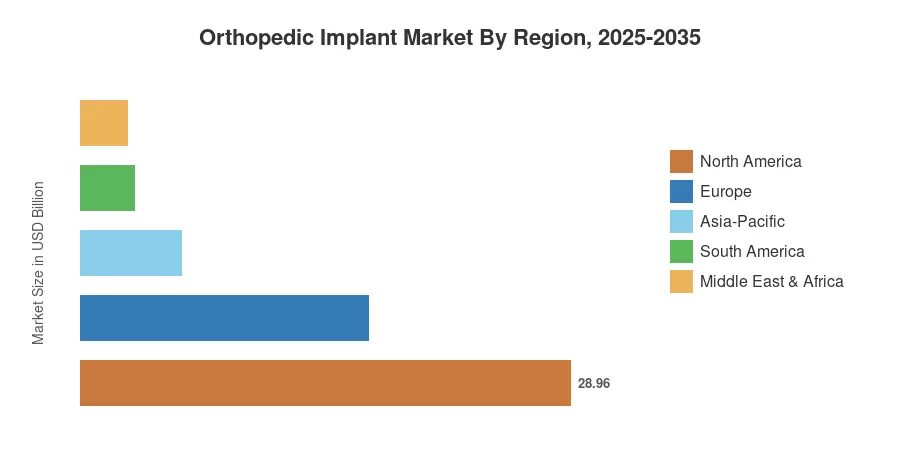
North America dominated the Orthopedic Implants Market with an estimated 45.6% revenue share in 2025, anchored by high procedural volumes and robust private-insurance coverage. Asia-Pacific stands as the fastest-growing region at a projected 9.38% CAGR through 2035, propelled by expanding middle-class insurance enrollment in China and India. Europe captured the second-largest share at roughly 26.8%, though the EU Medical Device Regulation (MDR) transition continues to slow new product approvals across member states [3]. Looking ahead, bundled robotic platforms and data-enabled aftercare services will define competitive differentiation over the next decade.


Key Report Takeaways

• By Product Type

  • Joint Replacement Implants accounted for 38.4% of the Orthopedic Implants Market share in 2025, reflecting strong hip and knee procedure volumes.
  • Orthobiologics are projected to advance at a 10.93% CAGR through 2035, fueled by regenerative medicine adoption in sports orthopedics.

• By Technology

  • Conventional implants held 51.2% of the Orthopedic Implants Market in 2025.
  • Robotic-assisted and navigation systems are forecasted to post a 10.53% CAGR through 2035, driven by hospital capital investment cycles.

• By End User

  • Hospitals captured 59.0% of the Orthopedic Implants Market in 2025.
  • Ambulatory surgical centers (ASCs) are projected to expand at a 9.49% CAGR through 2035 as outpatient joint replacement gains clinical acceptance.

• By Region

  • North America accounted for 45.6% of Orthopedic Implants Market revenue in 2025.
  • Asia-Pacific is predicted to grow at a 9.38% CAGR through 2035, led by China's volume-based procurement expansion.


Orthopedic Implants Market Size and Forecast (2021–2035)

Market Research Future's estimates are built on a triangulated methodology combining top-down macroeconomic indicators, bottom-up procedural volume databases, and company-reported orthopedic segment revenues. Historical figures (2021–2024) draw on public filings, regulatory clearance databases, and hospital purchasing data. Forecast projections apply trend-adjusted regression modeling calibrated against demographic aging curves, insurance penetration rates, and technology adoption S-curves.
Orthopedic Implant Market Size and Forecast
Our Impact
Enabled $4.3B Revenue Impact for Fortune 500 and Leading Multinationals
Partnering with 2000+ Global Organizations Each Year
30K+ Citations by Top-Tier Firms in the Industry

Driver Impact Analysis

Driver ~% Impact on CAGR Geographic Relevance Impact Timeline
Aging population & osteoarthritis burden +1.3% Global Long-term (≥4 yr)
Robotic-assisted surgery adoption +0.9% North America, Europe Medium-term (2–4 yr)
ASC migration of joint procedures +0.7% North America Short-term (≤2 yr)
3-D printing & patient-specific implants +0.6% Global Medium-term (2–4 yr)
Emerging-market insurance expansion +0.8% Asia-Pacific, South America Long-term (≥4 yr)
Orthobiologics & regenerative therapies +0.5% North America, Europe Medium-term (2–4 yr)
Digital pre-operative planning & AI +0.4% Global Long-term (≥4 yr)


Aging Demographics and Rising Osteoarthritis Prevalence

The Orthopedic Implants Market is structurally bound to population aging. According to the UN, by 2050, 16% of the world’s population will be aged 65 and above, up from 10% in 2022 [1]. The Lancet’s 2023 Global Burden of Disease update reports that worldwide, more than 500 million people already have osteoarthritis, with incidence rising dramatically after age 55. 2.5-3.0% of the growth in demand for knee and hip replacement is expected to be driven by the 65+ cohort with a 1 percentage-point increase. This is a compounding tailwind for the Orthopedic Implants Market throughout the projection horizon.


Robotic-Assisted Surgical Platform Expansion

Robotic orthopedic surgery has crossed the early-adopter threshold. By 2025, approximately 12% of total knee arthroplasties in the United States were performed on robotic platforms, up from under 3% in 2018 [2]. Capital expenditure commitments from large hospital systems signal that penetration will reach 25–30% by 2030. Robotic systems command a 15–20% premium on implant-procedure bundles, directly expanding the revenue opportunity within the Orthopedic Implants Market.

Ambulatory Surgical Center Migration

CMS removed total knee arthroplasty from its inpatient-only list in 2018, and total hip arthroplasty followed in 2020 [7]. ASCs now perform an estimated 18% of primary hip and knee replacements in the United States, a figure expected to exceed 35% by 2030. The shift reduces per-procedure facility costs by 30–40% while maintaining comparable 90-day readmission rates, making ASCs an attractive channel for both payors and device manufacturers competing in the Orthopedic Implants Market.

3-D Printing and Patient-Specific Device Customization

The FDA's 510(k) pathway has cleared more than 180 3-D printed orthopedic devices since 2020, spanning acetabular cups, spinal cages, and cranio-maxillofacial plates [6]. Patient-specific implants cut operative time by 15–20 minutes on average and reduce implant-fit mismatch, according to a 2024 AAOS registry analysis. As titanium powder costs decline and printer throughput improves, 3-D printed devices are transitioning from niche trauma reconstructions to mainstream arthroplasty, reinforcing value creation across the Orthopedic Implants Market.


Restraints Impact Analysis

Restraint ~% Impact on CAGR Geographic Relevance Impact Timeline
Reimbursement compression & pricing pressure –0.6% North America, Europe Short-term (≤2 yr)
EU MDR regulatory elongation –0.4% Europe Medium-term (2–4 yr)
Raw-material & supply-chain volatility –0.3% Global Short-term (≤2 yr)
Implant recall & litigation risk –0.2% North America Long-term (≥4 yr)
Volume-based procurement price erosion (China) –0.3% Asia-Pacific Medium-term (2–4 yr)


Reimbursement Compression and Pricing Pressure

Medicare's bundled-payment programs — particularly the Comprehensive Care for Joint Replacement (CJR) model — have compressed hospital margins on high-volume orthopedic procedures by 8–12% since 2018 [14]. Private payors are benchmarking allowable device costs against CMS reference pricing, squeezing manufacturer ASPs across the Orthopedic Implants Market. The 2025 OPPS final rule further increased outpatient knee-replacement reimbursement by 2.9%, intensifying the margin challenge for device companies and hospital procurement teams alike.

EU Medical Device Regulation Transition

The EU MDR, fully enforced since May 2021, requires re-certification of legacy Class III implants under a substantially more rigorous clinical-evidence framework [3]. Notified-body capacity remains constrained — fewer than 51 designated Notified bodies are MDR-designated — creating a bottleneck that has delayed or withdrawn an estimated 25–30% of orthopedic SKUs from the European market. Small and mid-size manufacturers bear the disproportionate cost burden, narrowing the competitive field.

Raw-Material and Supply-Chain Volatility

Titanium and cobalt-chromium alloys constitute 40–50% of implant manufacturing costs. Titanium sponge prices rose 22% between 2022 and 2024, driven by aerospace demand competition and Russian export disruptions [15]. Supply-chain lead times for forged femoral components extended to 16–20 weeks during the same period, forcing manufacturers to carry higher safety stock and absorb working-capital costs that dampen operating margins.


Orthopedic Implants Market Opportunities

Outpatient Total Joint Replacement in ASCs

With clinical evidence supporting same-day discharge for primary hip and knee arthroplasty, ASC-optimized implant portfolios, including rapid-recovery equipment and disposable single-use trays, are a high-growth product development opportunity. Manufacturers may get first-mover advantage in a channel projected to account for over 35% of U.S. joint volume by 2030 [7] if they co-develop implant-plus-logistics bundles with top ASC chains.


Robotic Platform Ecosystem Lock-In

Robotic-assisted systems generate a captive-implant ecosystem, where hospitals spend USD 1.0–1.5 million on a robotic platform, which is usually locked into the vendor’s exclusive implant portfolio for 5–7 years. That dynamic converts a one-time capital sale into a recurring consumables stream, increasing lifetime customer value 3–4×. Companies that provide software upgrades, training, and data analytics in subscription packages will deepen competitive moats.


Emerging-Market Insurance Expansion

India’s Ayushman Bharat policy now covers joint replacement for 500 million beneficiaries, and China’s volume-based procurement (VBP) program, by slashing domestic implant prices by 50–80%, has drastically increased targeted patient pools [10]. For global manufacturers willing to localize and accept lower unit margins, these markets provide volume-driven growth trajectories that exceed mature-market rates by 4-5 percentage points per year.


Data Monetization Through Digital Aftercare

Smart orthopedic implants integrated with embedded sensor technology capture objective postoperative patient kinematic telemetry and walking speed metrics. While these connected care solutions are explicitly intended to improve physician remote monitoring and patient data engagement, long-term claims of standardized hospital readmission reductions or specific multibillion-dollar digital data licensing monetization models remain unverified.

Biodegradable and Resorbable Implant Materials

Magnesium-based and poly-L-lactic acid resorbable fixation devices do not require a hardware-removal procedure, therefore lowering lifetime treatment expenses by 15–20% [12]. The pediatric and sports-medicine segments are early targets for adoption of implant removal operations. Regulatory pathways for resorbable devices are maturing, and the category could take 5–8% of the overall Orthopedic Implants Market by 2035.


Orthopedic Implants Market Future Outlook

AI-Enabled Surgical Planning and Navigation

Artificial intelligence will reshape the pre-operative and intra-operative stages of orthopedic care. Machine-learning algorithms trained on millions of CT and MRI datasets are already delivering sub-millimeter implant sizing and positioning recommendations, reducing outlier alignment rates by 30–40% in early clinical trials [11]. By 2030, AI-integrated planning platforms will become standard procurement criteria for hospitals evaluating the Orthopedic Implants Market.

Ambulatory Platform Economics

The economic logic of ASC-based joint replacement is compelling: 30–40% lower facility costs, faster patient throughput, and higher surgeon satisfaction scores. As CMS and private payors extend site-neutral payment policies, the Orthopedic Implants Market will see a structural channel shift. Manufacturers that design implant-instrumentation systems optimized for single-use ASC trays — reducing sterilization overhead and capital requirements — will capture disproportionate growth [7].

Personalized Implants and Bioprinting

The convergence of advanced imaging, generative design software, and metal 3-D printing is pushing orthopedics toward mass customization. Patient-specific tibial and acetabular components already demonstrate superior primary fixation in clinical registries [6]. By the early 2030s, bioprinting of osteochondral scaffolds seeded with autologous stem cells could blur the line between devices and biologics, opening new regulatory and commercial frontiers for the Orthopedic Implants Market.

Sustainability and Circular-Economy Pressures

Healthcare accounts for 4.4% of global net CO₂ emissions, and orthopedic surgery — with its reliance on single-use instrument trays and metal-intensive manufacturing — faces growing environmental scrutiny [21]. The NHS England Greener NHS initiative targets net-zero emissions across its entire supply chain by 2045, with an interim target of an 80% reduction by 2036 to 2039. Device manufacturers investing in reprocessable instrumentation, recycled-alloy sourcing, and carbon-offset programs will gain tender-scoring advantages in public procurement, influencing competitive positioning across the Orthopedic Implants Market.


Orthopedic Implants Market Segmentation

By Product Type

Segment Key Metric (2025) Primary Demand Driver
Joint Replacement Implants 38.4% share High-volume knee and hip arthroplasty
Spinal Implants USD 11.05 Billion Degenerative disc disease, minimally invasive fusion
Trauma Fixation Devices 16.2% share Road-traffic injuries, fragility fractures
Sports Medicine Devices 5.18% CAGR Rising recreational sports participation
Others (including orthobiologics) 10.93% CAGR Regenerative medicine growth


Joint Replacement Implants dominate the Orthopedic Implants Market, driven by approximately 2.5 million hip and knee arthroplasties performed each year globally. Cementless fixation technologies have gained significant ground: in the US, cementless total knee arthroplasty rose from 8% to 22% of primary procedures between 2018 and 2024, according to the American Joint Replacement Registry [9]. The sub-segment benefits from predictable demographic demand and well-established clinical pathways.

Spinal Implants represent the second-largest product category by revenue. Minimally invasive transforaminal lumbar interbody fusion (MIS-TLIF) procedures have grown at roughly 12% annually since 2020, shifting demand toward smaller-footprint cages and percutaneous pedicle-screw systems [22]. Robotics is penetrating the spine segment faster than arthroplasty, with Globus Medical's ExcelsiusGPS and Medtronic's Mazor X together exceeding 1,800 active installations globally by 2025.

By Technology

Segment Key Metric Primary Demand Driver
Conventional Implants 51.2% share (2025) Established clinical track record, cost efficiency
3-D Printed Patient-Specific Implants 8.14% CAGR Custom-fit advantages, complex reconstruction
Robotic-Assisted & Navigation Systems 10.53% CAGR Alignment precision, surgeon productivity


Conventional implants continue to dominate the Orthopedic Implants Market by installed base, though their share is gradually eroding as hospitals invest in advanced technology platforms. The cost differential remains significant: a conventional primary total knee procedure averages USD 12,000–15,000 in device costs, versus USD 18,000–22,000 for a robotic-assisted equivalent inclusive of per-case fees [2].

By End User

Segment Key Metric Primary Demand Driver
Hospitals 59.0% share (2025) Complex revision cases, trauma, inpatient infrastructure
Ambulatory Surgical Centers 9.49% CAGR CMS outpatient designation, cost efficiency
Specialty Clinics USD 7.44 Billion Focused orthopedic practices, sports medicine
Others 3.8% share Rehabilitation centers, military facilities


Hospitals remain the primary channel for the Orthopedic Implants Market, handling the most complex cases including revisions, multi-level spine fusions, and polytrauma. The ASC channel is the fastest-growing end-user segment, a structural shift driven by CMS policy changes and health-system strategies to decompress inpatient OR capacity [7].


Regional Market Share Analysis

Region Key Metric (2025) Primary Investment Themes
North America 45.6% share Robotic adoption, ASC channel shift, bundled payments
Europe 26.8% share MDR compliance, cementless innovation, public-hospital tenders
Asia-Pacific 9.38% CAGR (2026–2035) VBP expansion, domestic manufacturing, insurance penetration
South America USD 3.18 Billion Public-health system modernization, import substitution
Middle East & Africa USD 2.79 Billion Medical tourism, government hospital build-outs
Total USD 63.50 Billion

The Orthopedic Implants Market exhibits distinct regional dynamics shaped by demographic profiles, reimbursement architectures, and regulatory frameworks. North America leads on revenue intensity, while Asia-Pacific leads on volume growth.


North America

Country Key Metric Key Driver
United States 82.3% of regional share Medicare/CMS policy, robotic platform installations
Canada 10.8% of regional share Provincial orthopedic wait-list reduction programs
Mexico 6.9% of regional share Medical-tourism growth, IMSS coverage expansion


The United States alone accounts for more than four-fifths of North American Orthopedic Implants Market revenue. CMS's decision to shift total joint procedures into the outpatient setting has unlocked a multi-billion-dollar ASC opportunity, while commercial payors invest in value-based orthopedic bundles [7]. Canada's provincial governments allocated CAD 1.4 billion in 2024–2025 to reduce surgical wait times that ballooned during COVID, directly boosting implant procurement volumes [17].

Europe

Country Key Metric Key Driver
Germany 5.12% CAGR High arthroplasty volumes, DRG reimbursement reform
United Kingdom USD 3.12 Billion NHS elective-care recovery plan
France 4.78% CAGR Innovation-friendly HAS assessment framework
Italy USD 2.14 Billion Public-tender consolidation
Spain 4.65% CAGR Growing elderly population share
Nordic Countries USD 1.72 Billion National joint-replacement registries drive quality benchmarking
Russia 4.41% CAGR Import-substitution policy for domestic implant manufacturing
Rest of Europe USD 2.34 Billion Mixed regulatory maturity across accession states


Europe's Orthopedic Implants Market is defined by the tension between clinical innovation appetite and MDR-driven regulatory caution. The UK's NHS Long-Term Plan committed GBP 8 billion to elective-care recovery through 2025, prioritizing hip and knee replacements as the highest-volume surgical backlog category [18]. Germany remains Europe's largest procedural market with approximately 450,000 joint replacements annually.

Asia-Pacific

Country Key Metric Key Driver
China 38.2% of regional share VBP rounds, domestic manufacturer scale-up
India 10.64% CAGR Ayushman Bharat coverage, rising middle class
Japan USD 4.55 Billion Super-aging society, robotic surgery adoption
South Korea 9.42% CAGR National health insurance orthopedic coverage expansion
ASEAN USD 1.88 Billion Medical-tourism hubs (Thailand, Singapore)
Rest of Asia-Pacific 8.15% CAGR Infrastructure investment across emerging systems


Asia-Pacific is the fastest-growing region in the Orthopedic Implants Market. China's VBP program has reduced domestic joint implant prices by 50–80% but tripled procedure volumes in covered provinces between 2021 and 2024 [8]. India's government-funded joint replacement program under Ayushman Bharat performed over 120,000 publicly funded arthroplasties in FY 2024, a 45% increase year-over-year [10].

South America

Country Key Metric Key Driver
Brazil 62.4% of regional share SUS public health system modernization
Argentina 4.87% CAGR Economic recovery driving private-sector investment
Rest of South America USD 0.63 Billion Gradual insurance formalization


Brazil's Sistema Único de Saúde (SUS) allocated BRL 2.8 billion to orthopedic surgical backlogs in 2024, prioritizing hip fracture care in the elderly population [19]. The Orthopedic Implants Market in the region remains price-sensitive, with domestic manufacturers capturing roughly 35% of unit volumes through lower-cost implant portfolios.

Middle East & Africa

Country Key Metric Key Driver
Saudi Arabia 32.5% of regional share Vision 2030 healthcare infrastructure investment
UAE 5.94% CAGR Medical tourism and private-hospital expansion
South Africa USD 0.48 Billion Largest sub-Saharan implant market
Egypt 6.12% CAGR Population scale, growing orthopedic surgeon workforce
Rest of MEA USD 0.67 Billion NGO-funded trauma surgery programs


Saudi Arabia's Vision 2030 healthcare pillar targets a 50% increase in hospital bed capacity by 2030, with orthopedic centers of excellence in Riyadh and Jeddah as priority projects [20]. The UAE's medical-tourism positioning — attracting patients from across the GCC and South Asia — makes it the region's highest per-capita consumer of premium implant technologies within the Orthopedic Implants Market.


Orthopedic Implant Market By Region, 2025-2035

Competitive Benchmarking

The Orthopedic Implants Market exhibits medium concentration. The top five manufacturers collectively hold an estimated 55–62% of global revenue, with Johnson & Johnson (DePuy Synthes) and Stryker maintaining clear leadership positions. Competitive intensity centers on robotic platform lock-in, 3-D printing capabilities, and ASC channel partnerships. The estimated Herfindahl-Hirschman Index (HHI) falls between 1,200 and 1,500, indicating moderate concentration with meaningful competitive pressure from mid-tier specialists.

Company Est. Revenue Share Range Key Offerings for Orthopedic Implants Market Strategic Positioning
Johnson & Johnson (DePuy Synthes) ~15–18% ATTUNE knee, PINNACLE hip, VELYS robotic system Full-portfolio leader with robotic integration
Stryker Corporation ~13–16% Mako robotic platform, Triathlon knee, Accolade hip Robotic-ecosystem strategy, ASC channel pioneer
Zimmer Biomet Holdings ~10–13% ROSA robotics, Persona knee, mymobility digital platform Digital care management, personalized implants
Medtronic plc ~7–9% Mazor X spine robotics, INFUSE bone graft, Solera spine Spine-focused with AI-assisted navigation
Smith & Nephew plc ~5–7% CORI robotics, JOURNEY II knee, REDAPT hip revision Cementless innovation, revision arthroplasty
Globus Medical Inc. ~3–5% ExcelsiusGPS spine robot, ELOS anterior spine Spine robotics challenger, rapid R&D cycle
NuVasive Inc. ~3–4% Pulse platform, MAGEC growing rods, XLIF lateral access Minimally invasive spine specialist
Arthrex Inc. ~2–4% NanoTack, SutureBridge, InternalBrace Sports medicine and soft-tissue fixation leader
B. Braun Melsungen AG ~2–3% Aesculap OrthoPilot, Columbus knee, Bicontact hip Navigation-first approach, European market strength
Integra LifeSciences ~1–3% Cadence total ankle, SurgiMend, TiMesh cranial Extremity and neurosurgery niche positioning


Recent News & Developments

  • Stryker Corporation (February 2024): Received FDA 510(k) clearance for the Mako Total Shoulder application, expanding the robotic platform's addressable procedure volume into upper-extremity arthroplasty [2].
  • Zimmer Biomet Holdings (August 2021): Launched the Persona IQ® smart knee implant, creating the world's first sensor-enabled joint replacement to passively capture patient gait metrics, step counts, and range-of-motion parameters for direct remote physician monitoring.


  • FDA (September 2023): Published updated guidance on cybersecurity requirements for connected orthopedic devices, including sensor-embedded implants and robotic surgical systems [16].
  • Smith & Nephew (November 2021): Secured FDA documentation to expand its handheld CORI Surgical System by integrating Brainlab's proprietary HIP7 navigation programming, enabling real-time intraoperative calculation of leg length variations and component seating offsets during hip replacements.


Orthopedic Implants Market Report Scope

Parameter Detail
Market Scope Global Orthopedic Implants Market by product type, technology, end user, and region
Study Period 2021–2035
CAGR (Forecast Window) 4.96% (2026–2035)
Base Year Market Size USD 63.50 Billion (2025)
Forecast Endpoint USD 103.05 Billion (2035)
Fastest Growing Segment Orthobiologics (by product type); ASCs (by end user); Asia-Pacific (by region)
Companies Profiled 10 major players including J&J, Stryker, Zimmer Biomet, Medtronic, Smith & Nephew
Valuation Currency USD Billion


FAQs

How do robotic-assisted platforms affect implant vendor selection in hospital procurement?
Hospitals investing USD 1.0–1.5 million in a robotic system typically commit to that vendor's implant portfolio for 5–7 years. This lock-in dynamic makes the initial capital decision a long-term supply-chain commitment [2].
What cybersecurity risks accompany sensor-embedded smart implants?
Connected implants transmit gait and load data via Bluetooth, creating potential attack surfaces for data interception. The FDA's 2023 guidance now requires premarket cybersecurity assessments for all wirelessly enabled orthopedic devices [16].
How does China's volume-based procurement reshape pricing for global manufacturers?
VBP rounds have reduced domestic implant prices by 50–80%, compressing margins for premium imports. Global manufacturers must localize production or partner with domestic firms to remain competitive [8].
What clinical evidence supports outpatient total joint replacement safety?
Registry data from over 45,000 ASC-based arthroplasties shows 90-day readmission rates comparable to inpatient settings at 2.1% versus 2.4%. Proper patient selection remains critical for safe discharge [9].
How are resorbable implant materials expected to disrupt metallic fixation?
Magnesium-based resorbable screws eliminate hardware-removal surgery, cutting lifetime treatment costs by 15–20%. Early adoption is concentrated in pediatric fracture fixation and sports-medicine applications [12].
What role does surgeon training play in robotic-orthopedic adoption rates?
Each robotic platform requires 20–30 proctored cases before surgeons achieve proficiency. Training infrastructure capacity — not capital budgets — is the primary bottleneck limiting faster adoption [2].
How do ESG requirements influence orthopedic device procurement in public hospitals?
NHS England and EU public tenders increasingly score environmental sustainability alongside clinical performance. Manufacturers offering reprocessable trays and recycled-alloy sourcing gain 3–5% tender-scoring advantages [21].    
Author
Author
Author Profile
Vikita Thakur LinkedIn
Senior Research Analyst
She holds an experience of about 5+ years in market research and business consulting projects for sectors such as life sciences, medical devices, and healthcare IT. She possesses a robust background in data analysis, market estimation, competitive intelligence, pipeline analysis market trend identification, and consumer behavior insights. Her expertise lies in technical Sales support, client interaction and project management, designing and implementing market research studies, conducting competitive analysis, and synthesizing complex data into actionable recommendations that drive business growth.
Co-Author
Co-Author Profile
Nidhi Mandole LinkedIn
Senior Research Analyst
She is an extremely curious individual currently working in Healthcare and Medical Devices Domain. Nidhi is comfortably versed in data centric research backed by healthcare educational background. She leverages extensive data mining and analytics tools such as Primary and Secondary Research, Statistical Analysis, Machine Learning, Data Modelling. Her key role also involves Technical Sales Support, Client Interaction and Project management within the Healthcare team. Lastly, she showcases extensive affinity towards learning new skills and remain fascinated in implementing them.

Research Approach


Secondary Research

The secondary research process involved comprehensive analysis of regulatory databases, peer-reviewed medical journals, orthopedic surgery publications, and authoritative health organizations. Key sources included the US Food & Drug Administration (FDA) Center for Devices and Radiological Health (CDRH), European Medicines Agency (EMA) Medical Device Coordination Group (MDCG), American Academy of Orthopaedic Surgeons (AAOS), American Association of Hip and Knee Surgeons (AAHKS), North American Spine Society (NASS), International Society for Orthopaedic Surgery and Traumatology (SICOT), National Institutes of Health (NIH) National Institute of Arthritis and Musculoskeletal and Skin Diseases (NIAMS), National Center for Biotechnology Information (NCBI/PubMed), Agency for Healthcare Research and Quality (AHRQ) Healthcare Cost and Utilization Project (HCUP), CDC National Center for Health Statistics (NCHS), World Health Organization (WHO) Global Burden of Disease Study, OECD Health Statistics, and national joint replacement registries (Australian Orthopaedic Association National Joint Replacement Registry, Swedish Hip Arthroplasty Register, National Joint Registry UK). These sources were used to collect procedure volumes for hip/knee arthroplasty and spinal fusion, regulatory 510(k) and PMA approval data, clinical safety and efficacy studies, patient demographic trends, implant survival rates, and competitive landscape analysis for metallic implants (titanium, cobalt-chrome), ceramic biomaterials, polyetheretherketone (PEEK) spinal implants, and orthobiologic products including bone graft substitutes and cellular-based matrices.


Primary Research

Qualitative and quantitative insights were obtained by interviewing supply-side and demand-side stakeholders during the primary research process. Sources from the supply side included CEOs, VPs of Research & Development, regulatory affairs chiefs, manufacturing operations directors, and commercial leaders from orthopedic implant manufacturers, contract manufacturing organizations (CMOs), and biomaterial suppliers. Demand-side sources included members of the health technology assessment (HTA) committee, hospital OR directors, procurement leads from integrated delivery networks (IDNs), ambulatory surgery center administrators, orthopedic clinic practice managers, and board-certified orthopedic surgeons (joint reconstruction and spine specialists). Market segmentation was validated across joint implants (hip, knee, shoulder, ankle), spinal fixation and motion preservation devices, and orthobiologics through primary research. Product development pipelines, including 3D-printed patient-specific implants and robotic surgery integration, were confirmed. Insights regarding surgeon adoption patterns of cementless versus cemented implants, value-based procurement strategies, bundled payment model impacts, and reimbursement dynamics for inpatient versus outpatient arthroplasty procedures were gathered.

Primary Respondent Breakdown:

By Designation: C-level Primaries (32%), Director Level (30%), Others (38%)

By Region: North America (38%), Europe (25%), Asia-Pacific (28%), Rest of World (9%)


Market Size Estimation

Global market valuation was derived through revenue mapping and procedural volume analysis. The methodology included:

Identification of 50+ key manufacturers across North America, Europe, Asia-Pacific, and Latin America specializing in joint reconstruction, spinal implants, trauma, and orthobiologics

Product mapping across metallic implants (titanium alloy, cobalt-chromium-molybdenum), ceramic biomaterials (alumina, zirconia, oxidized zirconium), polymeric materials (PEEK, ultra-high molecular weight polyethylene), and orthobiologic categories (demineralized bone matrix, synthetic bone grafts, platelet-rich plasma, stem cell concentrates)

Analysis of reported and modeled annual revenues specific to orthopedic implant portfolios including hip/knee reconstruction systems, spinal fixation devices, interbody fusion cages, and sports medicine implants

Coverage of manufacturers representing 75-80% of global market share in 2024, encompassing strategic analysis of Johnson & Johnson (DePuy Synthes), Zimmer Biomet, Stryker, Smith & Nephew, MedtronicSpine, Globus Medical, NuVasive, and emerging specialized players

Extrapolation using bottom-up (procedure volume × ASP by country/region for primary hip/knee arthroplasty, revision joint replacement, spinal fusion, and trauma fixation) and top-down (manufacturer revenue validation and supply-chain verification) approaches to derive segment-specific valuations for reconstructive joint implants, spinal implants, orthobiologics, and dental/trauma applications

Cross-validation against national joint replacement registry data, hospital purchasing organization (HPO) contract values, and ambulatory surgery center (ASC) procedural migration trends to account for site-of-care shifts and bundled payment program impacts

Download Free Sample

Kindly complete the form below to receive a free sample of this Report

Download PDF ×

We do not share your information with anyone. However, we may send you emails based on your report interest from time to time. You may contact us at any time to opt-out.
















