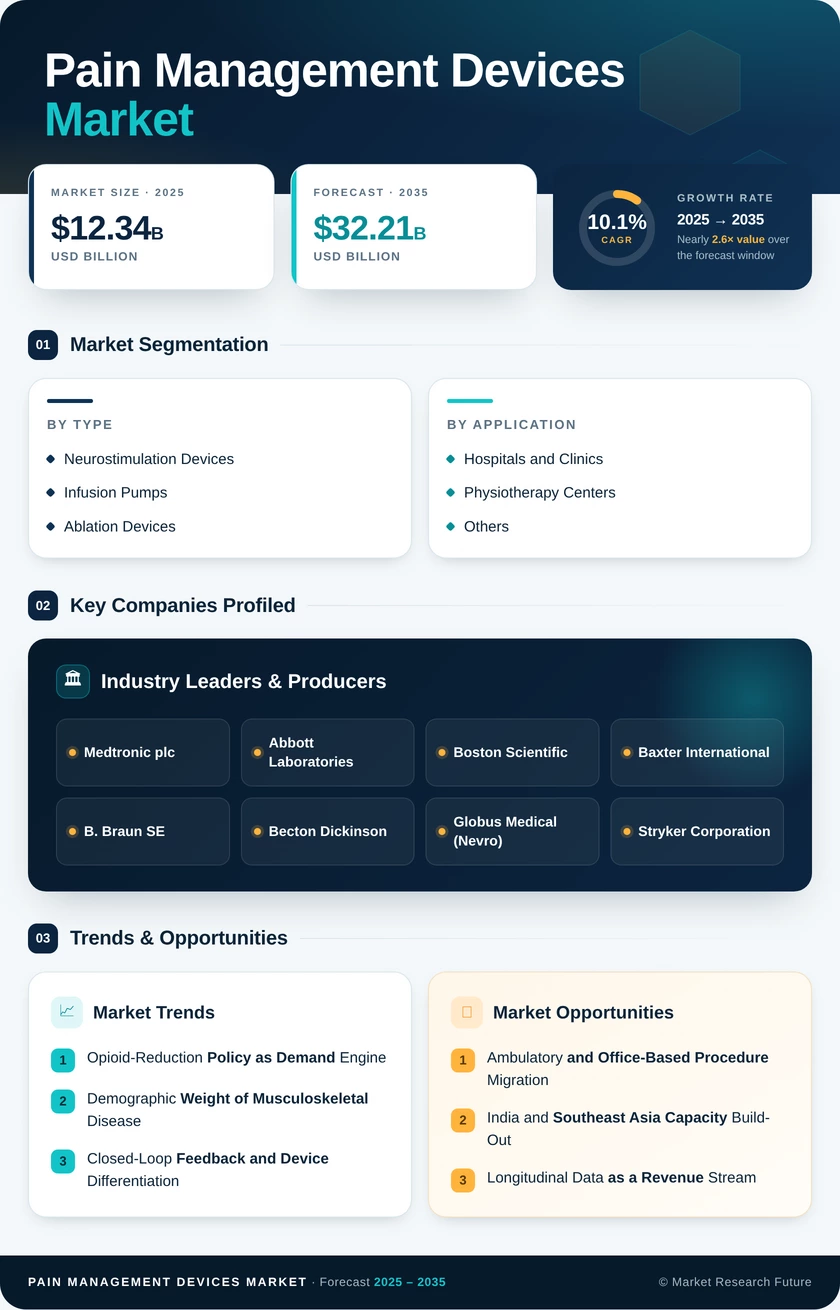
Pain management devices Market (2026 - 2035)

Pain Management Devices Market Research Report: Size, Share, Trend Analysis By Device Type (Stimulators, Analgesics Delivery Devices, Cryotherapy Devices, Radiofrequency Ablation Devices), By Therapeutic Area (Chronic Pain, Acute Pain, Postoperative Pain, Cancer Pain), By End Users (Hospitals, Home Care Settings, Ambulatory Surgical Centers, Physical Therapy Clinics), By Technology (Transcutaneous Electrical Nerve Stimulator, Intrathecal Drug Delivery Systems, Cryoablation Technology, Radiofrequency Technology) and By Regional (North America, Europe, South America, Asia Pacific, Middle East and Africa) - Growth Outlook & Industry Forecast Till 2035

Forecast Period
2026-2035
CAGR
10.1%
2025 Market Size
USD 12.34 Billion
2035 Market Size
USD 32.21 Billion
Healthcare ● Updated August 2026 Report ID: MRFR/HC/0975-HCR | Pages: 200 | Author: Nidhi Mandole, Rahul Gotadki
  1. 1 Market Overview |
    1. 1.1 Study Assumptions & Market Definition |
    2. 1.2 Scope of the Study |
    3. 1.3 Research Methodology
  2. 2 Market Summary & Key Report Takeaways |
    1. 2.1 By Product Type |
    2. 2.2 By Application |
    3. 2.3 By Geography
  3. 3 Global Market Size & Forecast (2021–2035) |
    1. 3.1 Historical Market Size (2021–2025) |
    2. 3.2 Current & Forecast Market Size (2026–2035) |
    3. 3.3 Market Size by Revenue (USD Billion) |
    4. 3.4 Year-over-Year Growth Analysis
  4. 4 Market Drivers Analysis |
    1. 4.1 Opioid-Reduction Policy as Demand Engine |
    2. 4.2 Demographic Weight of Musculoskeletal Disease |
    3. 4.3 Closed-Loop Feedback and Device Differentiation |
    4. 4.4 Reimbursement Clarity in Interventional Procedures
  5. 5 Market Restraints Analysis |
    1. 5.1 Cost Barriers Outside High-Income Systems |
    2. 5.2 Regulatory Recertification Drag in Europe |
    3. 5.3 Revision Burden and Clinical Confidence
  6. 6 Market Opportunity Analysis |
    1. 6.1 Ambulatory and Office-Based Procedure Migration |
    2. 6.2 India and Southeast Asia Capacity Build-Out |
    3. 6.3 Longitudinal Data as a Revenue Stream |
    4. 6.4 Cancer Pain and Intrathecal Delivery Expansion |
    5. 6.5 Non-Invasive and Wearable Adjuncts |
    6. 6.6 Industry Value Chain Analysis |
    7. 6.7 Porter's Five Forces Analysis
  7. 7 Regional Analysis |
    1. 7.1 North America | |
      1. 7.1.1 US | |
      2. 7.1.2 Canada | |
      3. 7.1.3 Mexico |
    2. 7.2 Europe | |
      1. 7.2.1 Germany | |
      2. 7.2.2 UK | |
      3. 7.2.3 France | |
      4. 7.2.4 Italy | |
      5. 7.2.5 Spain | |
      6. 7.2.6 Nordic Countries | |
      7. 7.2.7 Russia | |
      8. 7.2.8 Rest of Europe |
    3. 7.3 Asia-Pacific | |
      1. 7.3.1 China | |
      2. 7.3.2 India | |
      3. 7.3.3 Japan | |
      4. 7.3.4 South Korea | |
      5. 7.3.5 ASEAN | |
      6. 7.3.6 Rest of Asia-Pacific |
    4. 7.4 South America | |
      1. 7.4.1 Brazil | |
      2. 7.4.2 Argentina | |
      3. 7.4.3 Rest of South America |
    5. 7.5 Middle East & Africa | |
      1. 7.5.1 Saudi Arabia | |
      2. 7.5.2 UAE | |
      3. 7.5.3 South Africa | |
      4. 7.5.4 Egypt | |
      5. 7.5.5 Rest of MEA
  8. 8 Future Outlook (2026–2035) |
    1. 8.1 Algorithmic Therapy Management |
    2. 8.2 Outcomes-Linked Commercial Models |
    3. 8.3 Miniaturization and Battery Economics |
    4. 8.4 Evidence Standardization and Guideline Convergence
  9. 9 Market Segmentation Analysis |
    1. 9.1 By Product Type | |
      1. 9.1.1 Neurostimulation Devices | |
      2. 9.1.2 Infusion Pumps | |
      3. 9.1.3 Ablation Devices |
    2. 9.2 By Application | |
      1. 9.2.1 Musculoskeletal | |
      2. 9.2.2 Neuropathic Pain | |
      3. 9.2.3 Cancer Pain | |
      4. 9.2.4 Facial Pain & Migraine | |
      5. 9.2.5 Others |
    3. 9.3 By End-User | |
      1. 9.3.1 Hospitals and Clinics | |
      2. 9.3.2 Physiotherapy Centers | |
      3. 9.3.3 Others
  10. 10 Competitive Landscape |
    1. 10.1 Market Share Analysis (2026) |
    2. 10.2 Competitive Benchmarking Matrix |
    3. 10.3 Company Profiles | |
      1. 10.3.1 Medtronic plc | |
      2. 10.3.2 Abbott Laboratories | |
      3. 10.3.3 Boston Scientific Corporation | |
      4. 10.3.4 Baxter International Inc. | |
      5. 10.3.5 B. Braun SE | |
      6. 10.3.6 Becton Dickinson and Company | |
      7. 10.3.7 Globus Medical (Nevro) | |
      8. 10.3.8 Stryker Corporation | |
      9. 10.3.9 Avanos Medical | |
      10. 10.3.10 ICU Medical | |
      11. 10.3.11 Saluda Medical
  11. 11 Recent Developments & News
  12. 12 Report Scope & Methodology |
    1. 12.1 Study Period & Base Year |
    2. 12.2 Data Sources & Citations |
    3. 12.3 Abbreviations
  13. 13 Detailed Sources and Citations
  14. 14 Frequently Asked Questions (FAQs)
  15. 15 LIST OF TABLES |
  16. TABLE 1 Global Pain Management Devices Market Size & Forecast, by Revenue (USD Billion), 2021–2035 |
  17. TABLE 2 Global Pain Management Devices Market – Year-over-Year Growth Analysis, 2021–2035 |
  18. TABLE 3 Driver Impact Analysis Matrix, 2026–2035 |
  19. TABLE 4 Restraint Impact Analysis Matrix, 2026–2035 |
  20. TABLE 5 Global Market Size, by Product Type, 2021–2035 (USD Billion) |
  21. TABLE 6 Global Market Size, by Application, 2021–2035 (USD Billion) |
  22. TABLE 7 Global Market Size, by End-User, 2021–2035 (USD Billion) |
  23. TABLE 8 Global Market Size, by Region, 2021–2035 (USD Billion) |
  24. TABLE 9 North America Market Size, by Country, 2021–2035 (USD Billion) |
  25. TABLE 10 Europe Market Size, by Country, 2021–2035 (USD Billion) |
  26. TABLE 11 Asia-Pacific Market Size, by Country, 2021–2035 (USD Billion) |
  27. TABLE 12 South America Market Size, by Country, 2021–2035 (USD Billion) |
  28. TABLE 13 Middle East & Africa Market Size, by Country, 2021–2035 (USD Billion) |
  29. TABLE 14 North America Market Size, by Product Type, 2021–2035 (USD Billion) |
  30. TABLE 15 North America Market Size, by Application, 2021–2035 (USD Billion) |
  31. TABLE 16 North America Market Size, by End-User, 2021–2035 (USD Billion) |
  32. TABLE 17 Europe Market Size, by Product Type, 2021–2035 (USD Billion) |
  33. TABLE 18 Europe Market Size, by Application, 2021–2035 (USD Billion) |
  34. TABLE 19 Europe Market Size, by End-User, 2021–2035 (USD Billion) |
  35. TABLE 20 Asia-Pacific Market Size, by Product Type, 2021–2035 (USD Billion) |
  36. TABLE 21 Asia-Pacific Market Size, by Application, 2021–2035 (USD Billion) |
  37. TABLE 22 Asia-Pacific Market Size, by End-User, 2021–2035 (USD Billion) |
  38. TABLE 23 South America Market Size, by Product Type, 2021–2035 (USD Billion) |
  39. TABLE 24 South America Market Size, by Application, 2021–2035 (USD Billion) |
  40. TABLE 25 South America Market Size, by End-User, 2021–2035 (USD Billion) |
  41. TABLE 26 Middle East & Africa Market Size, by Product Type, 2021–2035 (USD Billion) |
  42. TABLE 27 Middle East & Africa Market Size, by Application, 2021–2035 (USD Billion) |
  43. TABLE 28 Middle East & Africa Market Size, by End-User, 2021–2035 (USD Billion) |
  44. TABLE 29 US Market Size, by Product Type and Application, 2021–2035 (USD Billion) |
  45. TABLE 30 Germany Market Size, by Product Type and Application, 2021–2035 (USD Billion) |
  46. TABLE 31 China Market Size, by Product Type and Application, 2021–2035 (USD Billion) |
  47. TABLE 32 India Market Size, by Product Type and Application, 2021–2035 (USD Billion) |
  48. TABLE 33 Japan Market Size, by Product Type and Application, 2021–2035 (USD Billion) |
  49. TABLE 34 Brazil Market Size, by Product Type and Application, 2021–2035 (USD Billion) |
  50. TABLE 35 Saudi Arabia Market Size, by Product Type and Application, 2021–2035 (USD Billion) |
  51. TABLE 36 Competitive Benchmarking Matrix, 2026 |
  52. TABLE 37 Company Profiles – Key Players |
  53. TABLE 38 Recent Developments & Strategic Announcements, 2023–2025 |
  54. TABLE 39 Report Scope & Methodology Summary |
  55. TABLE 40 Detailed Sources and Citations Index
  56. 16 LIST OF FIGURES |
  57. FIGURE 1 Market Dynamics – Drivers, Restraints and Opportunities Snapshot |
  58. FIGURE 2 Industry Value Chain Analysis |
  59. FIGURE 3 Porter's Five Forces Analysis |
  60. FIGURE 4 Global Market Size Trend, 2021–2035 (USD Billion) |
  61. FIGURE 5 Year-over-Year Growth Trajectory, 2022–2035 (%) |
  62. FIGURE 6 Market Share by Product Type, 2025 vs 2035 (%) |
  63. FIGURE 7 Market Share by Application, 2025 vs 2035 (%) |
  64. FIGURE 8 Market Share by End-User, 2025 vs 2035 (%) |
  65. FIGURE 9 Regional Share Distribution, 2025 (%) |
  66. FIGURE 10 Regional Share Distribution, 2035 (%) |
  67. FIGURE 11 Regional CAGR Comparison, 2026–2035 (%) |
  68. FIGURE 12 North America Country-Level Share Split, 2025 (%) |
  69. FIGURE 13 Europe Country-Level Share Split, 2025 (%) |
  70. FIGURE 14 Asia-Pacific Country-Level Share Split, 2025 (%) |
  71. FIGURE 15 Competitive Landscape – Estimated Revenue Share Bands, 2026 |
  72. FIGURE 16 Competitive Positioning Matrix – Portfolio Breadth vs Clinical Evidence Depth |
  73. FIGURE 17 Driver Impact Weighting Chart |
  74. FIGURE 18 Restraint Impact Weighting Chart |
  75. FIGURE 19 Technology Adoption Curve – Open-Loop to Feedback-Driven Systems |
  76. FIGURE 20 Site-of-Care Migration – Hospital vs Ambulatory Procedure Mix, 2025–2035
Share::
Request Free Sample

Segmentation Quick Reference

DimensionSub-SegmentsDominant SegmentFastest Growing Segment
By Product TypeNeurostimulation Devices; Infusion Pumps; Ablation DevicesNeurostimulation DevicesAblation Devices
By ApplicationMusculoskeletal; Neuropathic Pain; Cancer Pain; Facial Pain & Migraine; OthersMusculoskeletalNeuropathic Pain
By End-UserHospitals and Clinics; Physiotherapy Centers; OthersHospitals and ClinicsOthers (ASC & Home Care)
By GeographyNorth America; Europe; Asia-Pacific; South America; Middle East & AfricaNorth AmericaAsia-Pacific


Market Segmentation Overview

By Product Type

Sub-SegmentKey Trend
Neurostimulation DevicesMigration from fixed-output to feedback-driven closed-loop platforms with continuous neural sensing
Infusion PumpsFleet-wide replacement toward dose-error-reduction systems with EHR interoperability
Ablation DevicesRapid uptake of basivertebral and cooled radiofrequency procedures in ambulatory settings


Product mix is shifting on two axes at once: implants are becoming smarter and smaller, while non-implant procedures grow faster than the implant base. Vendors holding both sides of that split — an implant franchise plus a procedural ablation portfolio — enjoy the strongest cross-sell economics through 2035.

By Application

Sub-SegmentKey Trend
MusculoskeletalLow back pain remains the largest single indication and the primary implant referral source.
Neuropathic PainDiabetic neuropathy prevalence drives the fastest indication-level expansion.
Cancer PainExtended survivorship lengthens treatment duration and raises intrathecal pump candidacy.
Facial Pain & MigrainePeripheral and occipital neuromodulation adjuncts are gaining specialist adoption.
OthersPost-surgical, visceral and pelvic pain protocols entering routine interventional practice.


Indication breadth is widening steadily. Devices once reserved for failed back surgery syndrome now carry labeling across multiple chronic conditions, and every label expansion converts a pharmacological population into a procedural one.

By End-User

Sub-SegmentKey Trend
Hospitals and ClinicsRetain permanent implantation volume due to surgical suite and imaging requirements.
Physiotherapy CentersExpanding use of non-invasive and transcutaneous modalities in conservative pathways
OthersAmbulatory surgical centers and home care absorbing trials, ablation and follow-up programming


Site of care is the most consequential structural variable in the forecast. Each percentage point of procedure volume that moves from inpatient to ambulatory settings lowers system cost, raises throughput, and shifts purchasing authority from hospital committees toward physician-owned facilities.

By Geography

Sub-SegmentKey Trend
North AmericaReimbursement depth sustains the largest installed implant base globally
EuropeMDR recertification reshapes supplier choice while opioid stewardship lifts referrals
Asia-PacificCapacity build-out and localized manufacturing drive the steepest regional growth.
South AmericaPrivate supplementary health plans fund the majority of implant volume.
Middle East & AfricaGulf tertiary center investment concentrates demand in a handful of flagship facilities.


Geographic divergence will widen before it narrows. Mature markets compete on evidence and lifetime cost; emerging markets compete on access and affordability, and the vendors that build genuinely tiered portfolios rather than discounting flagship products will hold the durable position.




Share::
Request Free Sample
Download PDF ×

We do not share your information with anyone. However, we may send you emails based on your report interest from time to time. You may contact us at any time to opt-out.