Passenger Information System Market (2026 - 2035)

Passenger Information System Market Size, Share and Research Report By Component (Hardware, Software, Services), By Solution (Information/Display Systems, Announcement Systems, Mobile Applications), By Deployment Location (On-Board Systems, Station/Wayside Systems), By Mode of Transportation (Railway, Roadway/Bus and Coach, Airway/Airports) and By Regional (North America, Europe, South America, Asia Pacific, Middle East and Africa) - Industry Forecast to 2035.
ID: MRFR/ICT/1576-CR
147 Pages
Apoorva Priyadarshi, Shubham Munde
Last Updated: June 26, 2026
Passenger Information System Market
Market Size
Forecast Period2026-2035
CAGR (2026-2035)10.6%
2025 Market SizeUSD 35.40 Billion
2035 Market SizeUSD 96.95 Billion
Key Players
Alstom SA
Siemens Mobility
Hitachi Rail
Thales Group
Cubic Transportation Systems
Teleste Corporation
Opportunities
  • Mobility-as-a-Service Integration
  • Emerging-Market Airport Terminal Buildouts
  • Data Monetization and Advertising Revenue

Passenger Information System Market Summary

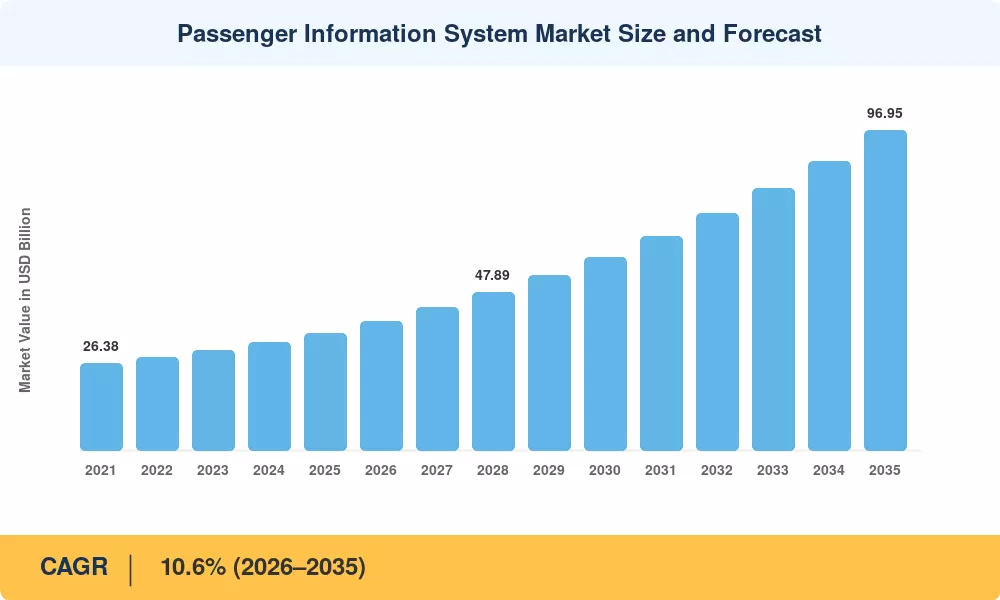
The Passenger Information System Market was valued at USD 35.40 billion in 2025 and is projected to grow from USD 39.15 billion in 2026 to USD 96.95 billion by 2035, registering a CAGR of 10.6% during the forecast period. Governments worldwide have accelerated investment in transit digitization—the U.S. Federal Transit Administration's Capital Investment Grants Program alone authorized over USD 3.2 billion for transit modernization in FY 2024, much of it earmarked for rider-facing information infrastructure [1]. The European Commission's Sustainable and Smart Mobility Strategy further mandates interoperable traveler data by 2030, channeling billions into cross-border rail and urban transit upgrades [2].

Legacy static signage, paper timetables, and stand-alone public-address units are giving way to cloud-connected platforms that fuse GPS tracking, predictive analytics, and multi-language accessibility into a single dashboard. The convergence of 5G networks, edge processors, and AI-driven disruption management allows transit operators to push context-aware alerts to displays, mobile apps, and wearables simultaneously—shrinking dwell times and lifting on-time performance by measurable margins [3].

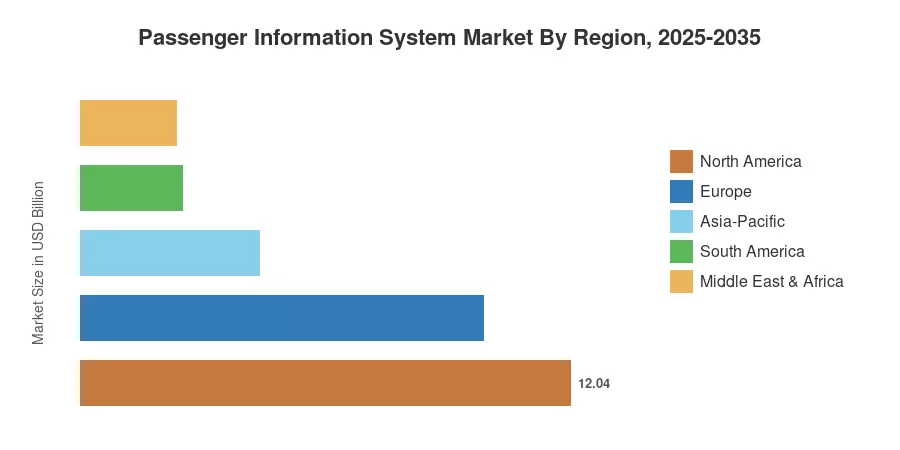
North America leads the Passenger Information System Market with roughly 34% of global revenue, anchored by mature rail and bus-rapid-transit networks. Asia-Pacific is the fastest-growing region at a projected 12.4% CAGR, propelled by metro-rail expansion across India, China, and Southeast Asia. Europe holds the second-largest share at approximately 28%, driven by stringent accessibility directives and dense commuter rail networks. As transit agencies pivot from capital-heavy hardware cycles to subscription-based software models, the Passenger Information System Market is poised for sustained double-digit growth through 2035.


Key Report Takeaways

• By Component

  • Hardware accounted for roughly 43.3% of Passenger Information System Market revenue in 2025, reflecting ongoing demand for ruggedized displays and onboard processors.
  • The software sub-segment is forecast to register a 15.5% CAGR through 2035, driven by cloud analytics and predictive-disruption platforms.

• By Solution

  • Information/Display Systems captured approximately 39.5% of the market share in 2025, the single largest solution category.
  • Mobile Applications are projected to grow at a 15.1% CAGR as transit riders increasingly rely on smartphone-based trip planning.

• By Deployment Location

  • Station/Wayside installations represented roughly 52.4% of the Passenger Information System Market in 2025.
  • On-Board Systems are expanding at a 16.4% CAGR, fueled by next-generation trains with integrated passenger-display ecosystems.

• By Mode of Transportation

  • Roadway/Bus and Coach networks held about 47.4% market share in 2025, reflecting the sheer scale of urban bus fleets globally.

• By Region

  • North America commanded ~34% of the global Passenger Information System Market revenue.
  • Asia-Pacific registered the fastest growth at an estimated 12.4% CAGR, led by massive metro-rail buildouts.


Market Size and Forecast (2021–2035)

Market Research Future's sizing model triangulates bottom-up revenue from component manufacturers, system integrators, and software platform providers against top-down macroeconomic indicators, including transit-capital expenditure growth, urbanization rates, and government infrastructure budgets. Historical values (2021–2024) rely on audited company filings and validated government procurement records; the forecast period applies a calibrated CAGR anchored to identified demand drivers and restraint offsets.
Passenger Information System Market Size and Forecast
Our Impact
Enabled $4.3B Revenue Impact for Fortune 500 and Leading Multinationals
Partnering with 2000+ Global Organizations Each Year
30K+ Citations by Top-Tier Firms in the Industry

Driver Impact Analysis

Driver ~% Impact on CAGR Geographic Relevance Impact Timeline
Government transit-digitization mandates 2.2 Global Short-term (≤2 yr)
5G and edge-computing deployment 1.8 North America, Asia-Pacific Medium-term (2–4 yr)
Urbanization and metro-rail expansion 1.6 Asia-Pacific, MEA Long-term (≥4 yr)
Accessibility and inclusivity regulations 1.3 Europe, North America Short-term
MaaS and multimodal integration 1.1 Europe, Asia-Pacific Medium-term
AI-driven predictive analytics adoption 0.9 Global Medium-term
Contactless payment convergence 0.7 Global Short-term


Government Transit-Digitization Mandates

Public-sector spending is the single most powerful accelerator for the Passenger Information System Market. The U.S. Infrastructure Investment and Jobs Act allocated USD 89.9 billion to transit over five years, and a significant share targets rider information technology [1]. India's National Urban Transport Policy requires all metro systems commissioned after 2024 to deploy centralized passenger information platforms, while China's 14th Five-Year Plan budgeted over CNY 600 billion for urban-rail construction—each new line integrating real-time display networks from day one [7].

5G and Edge-Computing Deployment

Low-latency 5G networks allow transit operators to push high-definition video feeds, crowd-density maps, and service-change alerts to platform screens and personal devices within milliseconds. Edge servers installed at stations reduce round-trip data latency by up to 70%, enabling predictive arrival algorithms that cut passenger wait-time uncertainty [3]. Ericsson projects that 5G will cover 75% of the world's population by 2029, giving the Passenger Information System Market a widening addressable infrastructure base [16].

Urbanization and Metro-Rail Expansion

The United Nations estimates that 68% of the world's population will live in cities by 2050, adding 2.5 billion urban residents. Asia-Pacific alone plans over 5,000 km of new metro lines through 2030, each station requiring multi-screen display networks, public-address integration, and mobile connectivity modules [7]. This construction pipeline translates into recurring hardware and software procurement cycles that underpin long-term growth of the Passenger Information System Market.

Accessibility and Inclusivity Regulations

The European Accessibility Act, effective June 2025, mandates that all transit information services be perceivable and operable by persons with disabilities—requiring audio announcements, high-contrast displays, and tactile wayfinding interfaces across stations and vehicles [2]. Compliance timelines are tight, creating an immediate demand spike for accessible PIS solutions throughout EU member states.


Restraints Impact Analysis

Restraint estimates follow the same directional methodology as driver impacts and represent headwinds that temper the Passenger Information System Market's growth trajectory without fully offsetting its positive momentum.

Restraint ~% Impact on CAGR Geographic Relevance Impact Timeline
LED and semiconductor component shortages –0.8 Global Short-term (≤2 yr)
High upfront integration costs for small operators –0.7 South America, MEA Medium-term (2–4 yr)
Rural and peri-urban connectivity gaps –0.6 Asia-Pacific, Africa Long-term (≥4 yr)
Cybersecurity risks to connected PIS platforms –0.5 North America, Europe Medium-term
Fragmented standards across transit authorities –0.4 Global Long-term


Component Supply Constraints

Pandemic-era semiconductor shortages have eased but not disappeared. LED display panels—critical for high-brightness station screens—experienced 15–20% price inflation between 2022 and 2024 [6]. Transit agencies with fixed procurement budgets have deferred display upgrades, temporarily slowing hardware revenue in the Passenger Information System Market. Dual-sourcing strategies and onshore chip fabrication incentives (e.g., the U.S. CHIPS Act) are expected to moderate this restraint by 2027.

High Integration Costs for Smaller Operators

Tier-2 and Tier-3 city bus operators often lack the capital and technical staff to deploy integrated information platforms. A full station retrofit can exceed USD 250,000 per site, a prohibitive figure for cash-constrained municipal bodies in Latin America and Sub-Saharan Africa [17]. Subscription-based, cloud-hosted models are beginning to lower this barrier, but adoption remains slow where broadband penetration is limited.

Cybersecurity Vulnerabilities

Connected PIS platforms that manage train dispatching data alongside rider information expand the cyberattack surface. The European Union Agency for Cybersecurity flagged rail transport as a "high-risk" sector in its 2024 Threat Landscape report, prompting transit operators to add security layers that increase project timelines and total cost of ownership [19].


Passenger Information System Market Opportunities

Mobility-as-a-Service Integration

MaaS platforms that aggregate ticketing, routing and payment across buses, trains, ferries and ride-hailing services require a seamless information backbone. Open-API architecture passenger information system vendors can act as the middleware layer in national MaaS ecosystems, enabling recurring SaaS income [11].


Emerging-Market Airport Terminal Buildouts

The Airports Council International projects that rising nations will add approximately 400 new terminal structures by 2035 [10]. Each terminal needs multi-language flight-information display systems, navigation kiosks and emergency broadcast infrastructure – a big greenfield opportunity for the Passenger Information System Market in areas where aviation expansion outstrips rail.


Data Monetization and Advertising Revenue

Transit operators increasingly see PIS display networks as dual-use assets—rider-information channels and programmatic-advertising surfaces. Advertising digitally across the whole station display estate produces around GBP 170 million per year for Transport for London [13]. Operators are offsetting PIS capital costs with vendors bundling content-management software with ad-server integration, a concept that could be duplicated in every large-network city.


AI-Powered Predictive Disruption Management

Machine-learning algorithms can be trained on historical delay patterns, weather data, and crowd-density sensors to predict service interruptions 15-30 minutes before they cascade, allowing information systems to proactively reroute passengers [9]. This predictive power is a premium difference that software-centric players can monetize through tiered licensing.


Autonomous and Connected Vehicle Corridors

As autonomous bus and tram pilots expand in cities such as Singapore, Helsinki, and Las Vegas, passenger information systems must adapt to vehicle-to-infrastructure communication standards. Vendors that build V2X-compatible display and notification modules will capture early-mover advantage in a segment projected to grow significantly after 2030 [12].


Passenger Information System Market Future Outlook

AI-Augmented Operations (2026–2028)

Transit agencies will move from reactive to anticipatory information delivery. Natural-language-processing engines will translate service alerts into dozens of languages in real time, while computer-vision models will estimate platform crowding and push alternative routing suggestions to passenger devices automatically [9].

Platform-Economy Shift (2028–2031)

The Passenger Information System Market will increasingly resemble a software-platform ecosystem. Vendors that offer API marketplaces—allowing third-party developers to build journey-planning, advertising, and accessibility plug-ins—will capture a disproportionate share of recurring revenue, mirroring the platform dynamics seen in cloud computing [8].

Electrification and Green-Transit Mandates (2029–2032)

The International Energy Agency estimates that the global electric-bus fleet will triple by 2030 [21]. Every new electric bus entering service carries onboard passenger-display requirements, extending the addressable market for the Passenger Information System Market beyond traditional rail-centric deployments. Energy-efficient OLED and e-paper displays will replace power-hungry LCD panels, aligning with transit operators' net-zero commitments [14].

ESG Reporting and Data Transparency (2032–2035)

Institutional investors and municipal bond markets are tying transit funding to environmental, social, and governance metrics. Passenger information systems will serve as data-collection endpoints—tracking ridership diversity, accessibility-feature usage, and carbon-displacement figures—feeding directly into ESG disclosures required by frameworks such as ISSB and GRI [22].


Passenger Information System Market Segmentation

By Component

Segment Key Metric Primary Demand Driver
Hardware ~43.3% share (2025) Display panel and processor upgrades
Software 15.5% CAGR (2026–2035) Cloud analytics and predictive platforms
Services USD 7.26 Billion (2025) System integration, maintenance, and managed services


Hardware remains the revenue anchor of the Passenger Information System Market, driven by demand for high-resolution LED and LCD panels engineered for outdoor readability and wide-temperature operation. Display refresh cycles—typically every 7–10 years—create predictable replacement demand. Software, however, is the strategic growth engine. Cloud-native PIS platforms allow agencies to centralize content management, push over-the-air updates, and integrate third-party data feeds without on-premise server investments [8]. Services revenue—comprising installation, annual maintenance, and managed-operations contracts—provides vendors with a stable, margin-rich annuity stream.

By Solution

Segment Key Metric Primary Demand Driver
Information/Display Systems ~39.5% share (2025) Station and vehicle screen deployments
Announcement Systems USD 5.67 Billion (2025) Audio PA and automated voice alert integration
Mobile Applications 15.1% CAGR (2026–2035) Smartphone trip-planning and push-notification adoption


Information and display systems lead the Passenger Information System Market because every new station and vehicle platform requires at least one visual output channel. High-brightness outdoor LED boards, indoor TFT panels, and e-paper destination indicators all fall within this category. Mobile applications are the fastest-growing solution, as riders shift trip-planning onto personal devices and expect real-time departure data synchronized with station displays [15].

By Deployment Location

Segment Key Metric Primary Demand Driver
Station/Wayside Systems ~52.4% share (2025) Platform, concourse, and entrance-hall displays
On-Board Systems 16.4% CAGR (2026–2035) Next-generation rolling stock with integrated screens


Station and wayside deployments dominate because a single station can host dozens of display units, PA speakers, and information kiosks. On-board systems are growing faster as train and bus manufacturers embed passenger-information displays into vehicle design at the production stage, reducing retrofit costs and enabling seamless content synchronization with wayside networks [14].

By Mode of Transportation

Segment Key Metric Primary Demand Driver
Railway USD 13.63 Billion (2025) Commuter and high-speed rail modernization
Roadway/Bus and Coach ~47.4% share (2025) Global bus-fleet scale and BRT expansion
Airway/Airports 14.0% CAGR (2026–2035) Terminal expansion and flight-information display systems


Roadway and bus networks represent the largest mode-based share because bus systems operate in virtually every city worldwide, creating a vast installed base for the Passenger Information System Market. Airports are expanding fastest as new terminal construction in Asia-Pacific and the Middle East drives demand for flight-information display systems, gate-management boards, and wayfinding kiosks [10].


Regional Market Share Analysis

Region Key Metric Primary Investment Themes
North America ~34% share (2025) Rail modernization, ADA compliance, smart-city programs
Europe ~28% share (2025) Accessibility directives, cross-border rail interoperability
Asia-Pacific 12.4% CAGR (2026–2035) Metro-rail expansion, airport terminal construction
South America USD 2.51 Billion (2025) BRT system upgrades, FIFA/Olympic legacy projects
Middle East & Africa USD 2.36 Billion (2025) Mega-project transit builds, airport expansions
Total USD 35.40 Billion (2025) —

The Passenger Information System Market shows pronounced regional variation, reflecting differences in transit maturity, government funding, and digital-infrastructure readiness.


North America

Country Key Metric Key Driver
United States ~72% of regional share FTA Capital Investment Grants; smart-city pilots
Canada 9.8% CAGR Transit-fleet electrification programs
Mexico USD 1.06 Billion (2025) Mexico City metro expansion; BRT modernization


The United States drives North American demand through federal capital programs and state-level smart-city initiatives. Canada's commitment to electrifying transit fleets in Montreal and Vancouver creates secondary demand for integrated onboard displays. Mexico City's metro system—one of the world's busiest—is upgrading its legacy signage to IP-connected screens under a multi-year concession contract [1].

Europe

Country Key Metric Key Driver
Germany ~22% of regional share Deutsche Bahn digital-rail modernization
United Kingdom 10.2% CAGR Network Rail connected-stations program
France USD 1.62 Billion (2025) Grand Paris Express metro construction
Italy ~11% of regional share PNRR-funded rail and urban transit upgrades
Spain 9.8% CAGR Renfe fleet-renewal and station digitization
Nordic Countries USD 0.74 Billion (2025) Green-transit mandates, MaaS leadership
Russia ~5% of regional share Moscow metro display overhaul
Rest of Europe 8.9% CAGR EU cohesion-fund rail investments


The European Accessibility Act is compressing upgrade timelines across the continent, giving the Passenger Information System Market a regulatory-driven demand floor. France's Grand Paris Express—with 68 new stations—is among the largest single-project PIS procurement pipelines in the world [2].

Asia-Pacific

Country Key Metric Key Driver
China ~38% of regional share Rapid metro-line commissioning; high-speed rail
India 14.6% CAGR Delhi, Mumbai, Bangalore metro expansions
Japan USD 1.19 Billion (2025) Shinkansen display upgrades; earthquake-alert integration
South Korea ~12% of regional share Smart-railway R&D; 5G station connectivity
ASEAN 13.2% CAGR Jakarta, Bangkok, Manila metro projects
Rest of Asia-Pacific USD 0.51 Billion (2025) Emerging urban-rail corridors


Asia-Pacific's growth trajectory stems from unprecedented metro-construction activity. India's Metro Rail Policy has sanctioned over 1,700 km of new lines across 27 cities, each requiring end-to-end passenger information deployment [7]. China continues to commission more metro kilometers annually than any other country, sustaining a deep order backlog for the Passenger Information System Market.

South America

Country Key Metric Key Driver
Brazil ~54% of regional share SĂŁo Paulo metro modernization; BRT upgrades
Argentina 8.4% CAGR Buenos Aires Subte station overhauls
Rest of South America USD 0.52 Billion (2025) Colombia and Chile transit projects


Brazil dominates South American spending, driven by SĂŁo Paulo's ongoing metro-line extensions and pre-event infrastructure for international sporting tournaments. Argentina's Buenos Aires Subte system is replacing 1960s-era signage with networked displays under World Bank co-financing [17].

Middle East & Africa

Country Key Metric Key Driver
Saudi Arabia ~28% of regional share Riyadh Metro; NEOM transit infrastructure
UAE 11.3% CAGR Dubai Metro Route 2030; airport expansions
South Africa USD 0.33 Billion (2025) Gautrain extensions; PRASA modernization
Egypt 10.1% CAGR Cairo Metro Line 4; new administrative capital
Rest of MEA ~19% of regional share Nairobi, Lagos light-rail projects


Saudi Arabia's Riyadh Metro—a six-line, 176-station network—represents one of the largest single passenger-information procurements in the Middle East. The UAE continues to expand the Dubai Metro ahead of Expo-legacy ridership targets, sustaining demand for the Passenger Information System Market in the Gulf [10].


Passenger Information System Market By Region, 2025-2035

Competitive Benchmarking

The Passenger Information System Market exhibits medium concentration: the top five players account for an estimated 35–42% of global revenue, while a long tail of regional integrators and niche software firms fragments the remainder. The Herfindahl-Hirschman Index is estimated between 600 and 900, indicating a moderately competitive structure. Established rail-technology conglomerates compete on end-to-end system integration, while agile software entrants differentiate through open APIs and rapid deployment cycles.

Company Est. Revenue Share Range Key Offerings Strategic Positioning
Alstom SA ~8–11% Integrated onboard and station PIS; Mastria platform Full-lifecycle rail-information solutions
Siemens Mobility ~7–10% Railigent analytics; station display networks Digital-twin and IoT integration
Hitachi Rail ~5–8% Lumada PIS suite; signaling-PIS convergence Data-driven rail operations
Thales Group ~4–7% Ground-transport PIS; cybersecure information platforms Defense-grade security heritage
Cubic Transportation Systems ~4–6% Umo mobility platform; fare-PIS integration Contactless payment–information convergence
Teleste Corporation ~3–5% Video-over-IP passenger displays; S-VMC platform Northern European transit stronghold
Mitsubishi Electric ~3–5% Train-information management; TVIS onboard displays Japanese rail technology export
Wabtec Corporation ~2–4% Transit-management PIS modules; Positive Train Control integration North American freight-to-transit crossover
Indra Sistemas ~2–4% MOVA traffic and PIS solutions; airport FIDS Iberian and Latin American focus
Luminator Technology Group ~2–3% LED destination signs; onboard audio-visual systems Bus and light-rail display specialist


Recent News & Developments

  • Siemens Mobility and Leonhard Weiss (February 2025) win EUR 2.8 billion contract to upgrade control and safety technology for Deutsche Bahn.
  • European Commission (June 2025): Published implementing rules for the European Accessibility Act, setting detailed technical standards for audio and visual passenger information across all EU transit modes [2].

Passenger Information System Market Report Scope

Parameter Detail
Market Scope Global Passenger Information System Market across hardware, software, and services
Study Period 2021–2035
CAGR (Forecast) 10.6% (2026–2035)
Base-Year Market Size USD 35.40 Billion (2025)
Forecast-Year Market Size USD 96.95 Billion (2035)
Fastest Growing Segment Mobile Applications (by Solution); On-Board Systems (by Deployment)
Companies Profiled 10 major players including Alstom, Siemens Mobility, Hitachi Rail, Thales, Cubic
Valuation Currency USD Billion
Methodology Triangulated bottom-up component revenue and top-down transit capex analysis


FAQs

How do transit agencies typically fund passenger information system deployments?
Most agencies blend federal grants, municipal bonds, and farebox-backed financing. Public-private partnerships are increasingly used for large station-retrofit programs [17].
What cybersecurity frameworks apply to connected PIS platforms?
ENISA's transport-sector guidelines and NIST CSF 2.0 are the most referenced. Operators typically require ISO 27001 certification from system integrators [19].
Can legacy hardware be software-upgraded without full replacement?
Many vendors offer middleware layers that connect older display controllers to cloud dashboards. Full functionality, however, generally requires hardware refresh within 3–5 years [8].
How does the Passenger Information System Market address multi-language accessibility?
Cloud platforms use neural machine translation to auto-generate signage and audio in 30+ languages. On-device NLP engines handle offline scenarios on trains and buses [9].
What role does open data play in competitive differentiation?
Operators publishing GTFS and SIRI feeds attract third-party app developers, expanding rider reach. Vendors supporting open standards gain procurement preference in public tenders [20].
How are advertising revenues shared between operators and PIS vendors?
Revenue-share models typically allocate 60–70% to the transit authority and 30–40% to the technology partner managing the content platform [13].
What is the average payback period for a station-level Passenger Information System Market investment?
Station PIS deployments typically achieve payback in 4–6 years when advertising and operational savings are factored in. Larger networks realize faster returns due to economies of scale [4].    
Author
Author
Author Profile
Apoorva Priyadarshi LinkedIn
Research Analyst
With 4+ years of experience in Market Intelligence and Strategic Research, Apoorv specializes in ICT, Semiconductor, and BFSI markets. Combining strong analytical capabilities with a deep understanding of technology-driven industries, he focuses on delivering data-driven insights that support strategic decision-making. With a background in technology and business research, Apoorv has contributed to numerous global market studies, competitive landscape analyses, and opportunity assessments across sectors such as semiconductors, digital banking, cybersecurity, and telecommunications.
Co-Author
Co-Author Profile
Shubham Munde LinkedIn
Team Lead - Research
Shubham brings over 7 years of expertise in Market Intelligence and Strategic Consulting, with a strong focus on the Automotive, Aerospace, and Defense sectors. Backed by a solid foundation in semiconductors, electronics, and software, he has successfully delivered high-impact syndicated and custom research on a global scale. His core strengths include market sizing, forecasting, competitive intelligence, consumer insights, and supply chain mapping. Widely recognized for developing scalable growth strategies, Shubham empowers clients to navigate complex markets and achieve a lasting competitive edge. Trusted by start-ups and Fortune 500 companies alike, he consistently converts challenges into strategic opportunities that drive sustainable growth.

Research Approach


Secondary Research

The secondary research process involved comprehensive analysis of regulatory databases, industry journals, technical publications, and authoritative transportation organizations. Key sources included the US Department of Transportation (DOT), Federal Railroad Administration (FRA), Federal Transit Administration (FTA), European Union Agency for Railways (ERA), International Association of Public Transport (UITP), International Air Transport Association (IATA), International Civil Aviation Organization (ICAO), American Public Transportation Association (APTA), European Committee for Standardization (CEN), National Transportation Safety Board (NTSB), Transport for London (TfL), Deutsche Bahn, Indian Railways, national railway operators' annual reports, IEEE Xplore Digital Library for technical standards, and ITU (International Telecommunication Union) for communication protocols.

Transit ridership statistics, regulatory framework data, safety compliance studies, smart transportation initiatives, adoption trends of digital signage, and market landscape analysis for wayside PIS, on-board PIS, mobile applications, and centralized control systems across rail, road, air, and sea transport modes were all gathered from these sources.


Primary Research

In order to gather both qualitative and quantitative insights, supply-side and demand-side stakeholders were interviewed during the primary research process. CEOs, CTOs, VPs of Product Development, heads of Intelligent Transportation Systems (ITS) divisions, and regional sales directors from PIS solution providers, display makers, and OEMs of audio-visual equipment were examples of supply-side sources. Transport authority operations managers, railroad network operators, airline and bus fleet managers, procurement leads from transit agencies, airport terminal operations directors, and marine port authorities were examples of demand-side sources. Market segmentation, product roadmap timetables, and information on technology adoption trends, display hardware preferences, software integration difficulties, and procurement budget allocations were all verified by primary research.

Primary Respondent Breakdown:

By Designation: C-level Primaries (32%), Director Level (31%), Others (37%)

By Region: North America (31%), Europe (29%), Asia-Pacific (34%), Rest of World (6%)


Market Size Estimation

Revenue mapping and deployment volume analysis were used to determine the global market valuation. The methodology comprised:

Finding more than fifty major hardware producers and PIS solution suppliers in North America, Europe, Asia-Pacific, the Middle East, and Africa

Product mapping between mobile and web platforms, roadside PIS (platform displays, station systems), on-board PIS (in-car displays, announcement systems), and centralized management systems

Examination of annual revenues for passenger information system portfolios, both reported and modeled

In 2024, producers and integrators will account for 72–77% of the global market.

Extrapolation of segment-specific valuations across rail transit, road transport, aviation, and maritime sectors using top-down (system integrator revenue validation) and bottom-up (number of vehicles/stations equipped Ă— ASP by nation) methods

Download Free Sample

Kindly complete the form below to receive a free sample of this Report

Download PDF ×

We do not share your information with anyone. However, we may send you emails based on your report interest from time to time. You may contact us at any time to opt-out.
















