Piezoelectric Devices Market (2026 - 2035)

Piezoelectric Devices Market Size, Share and Research Report By Application (Sensors, Transducers, Energy harvesting, Motors, High voltage actuators), Vertical (Oil and Gas, Automotive, Aerospace and Defence, Medical and Healthcare, Communication), And By Region (North America, Europe, Asia-Pacific, And Rest Of The World) โ€“ Industry Forecast Till 2035
ID: MRFR/SEM/0714-HCR
200 Pages
Ankit Gupta
Last Updated: June 26, 2026
Piezoelectric Devices Market
Market Size
Forecast Period2026-2035
CAGR (2026-2035)6.70%
2025 Market SizeUSD 35.10 Billion
2026 Market SizeUSD 37.45 Billion
2035 Market SizeUSD 67.15 Billion
Key Players
TDK Corporation
Murata Manufacturing
Kyocera Corporation
CTS Corporation
PI Ceramic GmbH
Meggitt Sensing Systems
Opportunities
  • Wearable Bioelectronics and Implantable Devices
  • Smart Infrastructure and Structural Health Monitoring
  • Emerging-Market Energy Sector Deployments

Piezoelectric Devices Market Summary

The Piezoelectric Devices Market reached USD 35.10 Billion in 2025 and is projected to grow from USD 37.45 Billion in 2026 to USD 67.15 Billion by 2035, registering a CAGR of 6.70% during the forecast period (2026โ€“2035). Two catalysts anchor this trajectory: the global rollout of 5G-Advanced infrastructure, which depends on bulk acoustic wave filters fabricated from advanced piezo materials, and the European Union's revised RoHS directive pushing manufacturers toward lead-free piezoelectric compositions such as potassium sodium niobate [1]. These regulatory and technology forces create a durable demand floor that extends well beyond the current investment cycle.

Across the value chain, legacy bulk ceramic transducers are giving way to thin-film and single-crystal architectures that deliver higher electromechanical coupling at smaller footprints. The U.S. Department of Energy's USD 280 million advanced manufacturing initiative for smart-sensor integration in industrial plants underscores the government's willingness to subsidize next-generation piezo deployment [2]. Aluminum scandium nitride films, once confined to laboratory prototypes, now enable commercial RF filter production above 6 GHz, unlocking new spectrum for 5G and satellite communications.

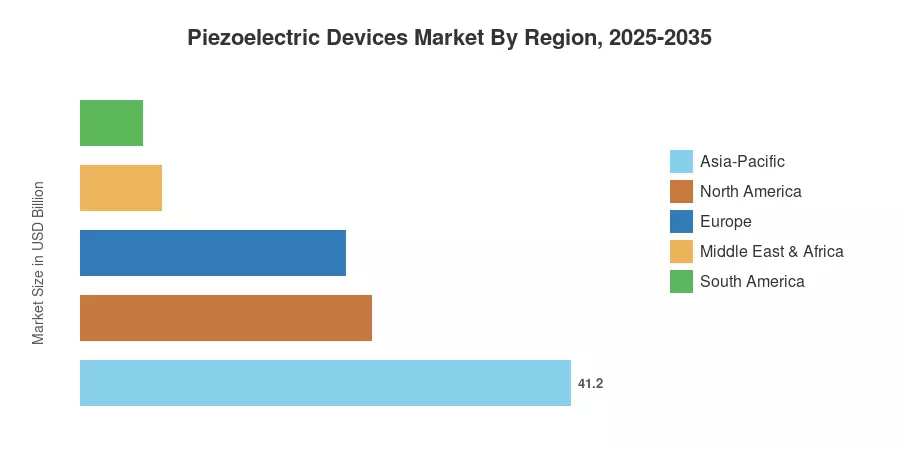
Asia-Pacific commands roughly 41.2% of the Piezoelectric Devices Market, driven by consumer electronics manufacturing clusters in China, Japan, and South Korea. The Middle East & Africa is the fastest-growing region, fueled by oil-and-gas sensing installations, while North America holds the second-largest share at approximately 24.5% on the strength of defense and medical device procurement. The Piezoelectric Devices Market is poised to benefit from convergent electrification, miniaturization, and industrial digitization trends through 2035.

Key Report Takeaways

โ€ข By Product Type

  • Sensors accounted for 34.0% of the Piezoelectric Devices Market in 2025, supported by industrial condition-monitoring deployments across manufacturing and energy sectors.
  • Energy harvesters represent the fastest-growing product segment, advancing at a 9.4% CAGR through 2035 as self-powered IoT nodes gain traction in remote infrastructure.

โ€ข By Material

  • Ceramics commanded 62.0% revenue share in 2025, reflecting their cost efficiency and broad application compatibility across the Piezoelectric Devices Market.
  • Polymers are expected to grow at a 9.0% CAGR through 2035, driven by flexible wearable and biomedical sensing applications.

โ€ข By End-User Industry

  • Consumer electronics led the Piezoelectric Devices Market with 29.5% revenue share in 2025, anchored by smartphone haptic actuators and RF filter demand.
  • Automotive and transportation are forecast to post an 8.1% CAGR through 2035 as electric vehicle platforms adopt piezo-based fuel injectors, parking sensors, and structural health monitors.

โ€ข By Region

  • Asia-Pacific dominated the Piezoelectric Devices Market at 41.2% share in 2025.
  • The Middle East & Africa are projected as the fastest-growing region, expanding on energy-sector sensing investments.

Market Size and Forecast (2021โ€“2035)

Market Research Future derives historical estimates from trade association shipment data, company filings, and customs records, while forecast projections rely on bottom-up demand modeling calibrated against macroeconomic indicators, technology adoption curves, and policy timelines. All figures are denominated in current USD Billion.
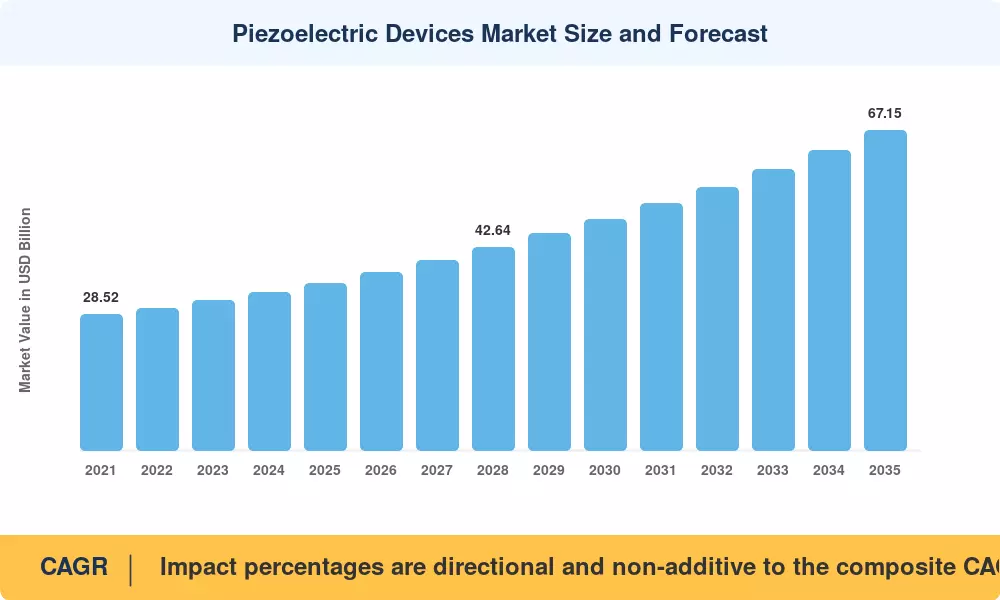
Piezoelectric Devices Market Size and Forecast
Our Impact
Enabled $4.3B Revenue Impact for Fortune 500 and Leading Multinationals
Partnering with 2000+ Global Organizations Each Year
30K+ Citations by Top-Tier Firms in the Industry

Driver Impact Analysis

Driver ~% Impact on CAGR Geographic Relevance Impact Timeline
5G/6G RF filter proliferation ~18% Global Short-term (โ‰ค2 yr)
Automotive electrification and ADAS ~16% North America, Europe, Asia-Pacific Medium-term (2โ€“4 yr)
Industry 4.0 predictive maintenance ~14% Europe, North America Short-term (โ‰ค2 yr)
Medical ultrasound and surgical robotics ~12% North America, Asia-Pacific Medium-term (2โ€“4 yr)
Lead-free regulatory mandates ~11% Europe, Asia-Pacific Long-term (โ‰ฅ4 yr)
IoT self-powered sensor networks ~10% Global Long-term (โ‰ฅ4 yr)
Defense sonar and precision guidance ~9% North America, Middle East & Africa Medium-term (2โ€“4 yr)

ย 

5G/6G RF Filter Proliferation

High-performance radio frequency (RF) filtering is necessary for modern 5G base stations in order to control signal interference across a growing number of frequency bands. Miniaturized, high-Q resonators are in high demand due to the shift to Massive MIMO (Multiple Input, Multiple Output) systems and the use of both sub-6 GHz and mm-wave (FR2) spectrums. Bulk acoustic wave (BAW) and thin-film bulk acoustic resonator (FBAR) technologies are required due to the shift towards higher frequencies, even though specific filter counts vary per base station architecture. Piezo-based filters are essential to RF front-end components, which account for a sizable portion of overall network equipment expenses, according to recent infrastructure estimates. This reliance guarantees that the market for piezoelectric devices will continue to play a crucial role in the worldwide deployment of 5G Advanced and the eventual shift to 6G.

ย 

Automotive Electrification and ADAS

Battery electric vehicles use 30โ€“40% more piezoelectric components than equivalent internal combustion platforms, spanning fuel-injector replacements, ultrasonic parking sensors, tire-pressure monitors, and cabin haptic interfaces [10]. The IEA projects global EV sales will reach 30 million units in 2029, translating into an incremental USD 1.8 billion addressable opportunity for the Piezoelectric Devices Market [10]. Piezo actuator technology in direct-injection systems alone accounts for a component value of USD 12โ€“18 per vehicle, a figure that roughly doubles when ADAS-grade ultrasonic arrays are included [5].

Industry 4.0 Predictive Maintenance

Piezoelectric accelerometers and acoustic emission sensors form the backbone of condition-monitoring systems across smart factories. The World Economic Forum estimates that predictive maintenance reduces unplanned downtime by 30โ€“50% and maintenance costs by 20โ€“25% in heavy manufacturing [6]. Germany's Industrie 4.0 Platform has funded over EUR 450 million in digitization grants since 2020, many of which specify piezo-based sensing as a core component of eligible retrofit packages [6]. This government-backed adoption cycle extends across Europe and is increasingly replicated in Japan and South Korea, reinforcing steady demand within the Piezoelectric Devices Market.

Medical Ultrasound and Surgical Robotics

Due to the worldwide shift toward portable, handheld, and point-of-care (POC) diagnostic technologies, the market for medical ultrasound transducers is still growing. With more than 60% of the market, piezoelectric crystal designs continue to be the most popular technology. However, new CMUT (Capacitive Micromachined Ultrasonic Transducer) architectures are becoming more popular because of the advantages of semiconductor integration. The need for high-performance piezo-driven micro-actuators, which offer the sub-millimeter positioning accuracy necessary for minimally invasive operations, is also being driven by surgical robot platforms. The healthcare industry's continued need for high-precision piezoelectric components is ensured by the connection between telehealth expansion and sophisticated robots.

ย 

Restraints Impact Analysis

The restraint impacts below represent estimated drag coefficients on the market's growth trajectory, derived from supply-chain modeling and regulatory compliance cost analysis. They are directional and non-additive.

Restraint ~% Impact on CAGR Geographic Relevance Impact Timeline
Lead-free material transition costs ~-8% Europe, Asia-Pacific Long-term (โ‰ฅ4 yr)
Niobium and lithium supply concentration ~-6% Global Medium-term (2โ€“4 yr)
High-temperature performance limitations ~-5% North America, Middle East & Africa Long-term (โ‰ฅ4 yr)
Patent thickets in single-crystal growth ~-4% Global Short-term (โ‰ค2 yr)
Competition from MEMS alternatives ~-4% Asia-Pacific, North America Medium-term (2โ€“4 yr)

ย 

Lead-Free Material Transition Costs

The EU's RoHS directive and its counterparts in China and South Korea require phasing out lead zirconate titanate, which has been the industry standard for over five decades. Replacement compositions โ€” potassium sodium niobate and bismuth sodium titanate โ€” currently cost 35โ€“50% more per kilogram to manufacture and deliver 15โ€“20% lower piezoelectric coefficients [1]. Scaling production to commercial volumes will require USD 400โ€“600 million in cumulative capital investment across ceramic processing lines by 2030, a burden that disproportionately affects mid-tier Piezoelectric Devices Market participants lacking vertical integration [8].

Critical Mineral Supply Concentration

While lithium niobate single-crystal feedstock is mostly produced in Australia and Chile, niobium supply is centered in Brazil, which produces around 85% of the world's output [16]. Defense-grade and aerospace-grade piezoelectric substrates may see lead-time spikes of six to twelve months due to geopolitical disturbances or export bans on either mineral. Niobium was identified as an important mineral by the U.S. Geological Survey in its 2024 assessment; however, no major diversification projects are anticipated to reach commercial scale before 2029 [16].

ย 

Competition from MEMS Alternatives

For some consumer and Internet of Things applications, micro-electromechanical systems provide competitive sensing and actuation capabilities at reduced unit prices. Where piezo sensors historically dominated smartphones and wearables, MEMS accelerometers have gained a lot of traction, especially at prices under USD 0.50 per unit [19]. The pricing pressure from MEMS restricts growth in cost-sensitive volume sectors of the piezoelectric devices market, even though piezoelectric devices continue to have distinct benefits in high-frequency, high-force, and harsh-environment applications.

ย 

Piezoelectric Devices Market Opportunities

Wearable Bioelectronics and Implantable Devices

Flexible piezoelectric polymers such as PVDF and its copolymers enable conformal sensors that conform to skin or organ surfaces, opening applications in continuous blood-pressure monitoring, gait analysis, and implantable cardiac sensors. The global wearable medical device market is projected to exceed USD 60 Billion by 2030, and piezoelectric energy harvesting from body motion can power these devices without batteries โ€” a critical advantage for implantables requiring FDA-approved biocompatibility.

Smart Infrastructure and Structural Health Monitoring

Embedded piezoelectric sensors in bridges, tunnels, and high-rise buildings can detect micro-cracks, stress concentrations, and corrosion onset years before visible degradation occurs. The American Society of Civil Engineers estimates USD 2.6 trillion in deferred infrastructure maintenance in the United States alone [15], creating a massive retrofit opportunity. Municipalities adopting digital-twin frameworks are specifying vibration energy harvesting nodes that combine sensing and self-powering in a single piezo module.

Emerging-Market Energy Sector Deployments

Oil-and-gas operators in the Middle East and Africa are installing piezoelectric flow meters, downhole pressure sensors, and pipeline integrity monitors as part of broader digital oilfield programs. Saudi Aramco's 2024 smart-field initiative allocated USD 1.5 billion for sensor-network upgrades across 50 production facilities [2], directly expanding the addressable Piezoelectric Devices Market in a region historically underserved by piezo component distributors.

Data Monetization Through Sensor-as-a-Service Models

Equipment manufacturers are shifting from one-time component sales to recurring revenue streams by bundling piezoelectric sensors with cloud-based analytics platforms. This sensor-as-a-service model generates continuous vibration, acoustic, and pressure data that operators can license to insurers, regulators, and predictive-maintenance AI vendors. Early adopters report 2โ€“3ร— lifetime revenue per sensor compared with traditional hardware-only sales.

Precision Agriculture and Environmental Monitoring

Piezoelectric rain gauges, soil-moisture sensors, and ultrasonic pest-detection systems are gaining traction in precision agriculture deployments. The FAO's 2024 digital agriculture roadmap targets sensor coverage across 120 million hectares of farmland in developing economies by 2032 [20], representing a greenfield opportunity for ruggedized, low-power piezo sensing platforms outside traditional industrial verticals.

Piezoelectric Devices Market Future Outlook

AI-Driven Predictive Sensing

Machine learning algorithms trained on piezoelectric sensor data will transform condition monitoring from scheduled inspection to continuous, autonomous diagnostics. By 2030, an estimated 40% of industrial piezo sensors will stream directly into AI inference engines that predict failure windows with 95%+ accuracy [6]. This shift increases the value per sensor node and creates sticky software-attached revenue for Piezoelectric Devices Market participants who invest in edge-computing partnerships.

Electrification Supercycle

The IEA projects global electricity demand will rise 30% by 2035, driven by EV charging, data-center expansion, and industrial heat-pump adoption [10]. Every segment of the electrification chain โ€” from grid transformers to EV powertrains to battery-pack monitoring โ€” incorporates piezoelectric components for vibration sensing, current measurement, or precision actuation. This broad-based demand ensures the Piezoelectric Devices Market does not depend on any single application vertical for sustained growth.smartphone

Sustainable and Circular Manufacturing

Lead-free piezoelectric materials will likely reach performance parity with lead zirconate titanate compositions by the early 2030s, based on current laboratory trajectories for textured potassium sodium niobate ceramics [8]. Once performance parity is achieved, the cost premium is expected to drop below 10%, removing the last major barrier to full regulatory compliance. Manufacturers investing in closed-loop recycling of piezo waste โ€” including reclamation of rare-earth dopants โ€” will secure both cost and ESG advantages in the Piezoelectric Devices Market.

Space and Extreme-Environment Applications

Piezoelectric actuators and sensors rated for cryogenic and high-radiation environments are increasingly specified for satellite antenna positioning, Mars-rover instrumentation, and fusion-reactor diagnostics [17]. NASA's Artemis program and ESA's ExoMars missions both rely on custom piezo actuators for precision deployable structures. While the addressable volume is modest, per-unit values of USD 5,000โ€“50,000 make space-grade piezoelectric devices a high-margin frontier for the Piezoelectric Devices Market.

Piezoelectric Devices Market Segmentation

By Product Type

Segment Metric Primary Demand Driver
Sensors 34.0% share (2025) Industrial condition monitoring and automotive ADAS
Actuators and Motors USD 9.12 Billion (2025) Precision positioning in semiconductors and optics
Transducers 6.90% CAGR (2026โ€“2035) Medical ultrasound and NDT inspection
Energy Harvesters 9.4% CAGR (2026โ€“2035) Self-powered IoT and remote infrastructure

ย 

Sensors dominate the Piezoelectric Devices Market by product type, driven by accelerometers, pressure sensors, and acoustic emission detectors deployed across manufacturing, energy, and transportation. The industrial IoT buildout has expanded the installed base of vibration sensors by an estimated 18% annually since 2022, as factories instrument rotating machinery, conveyor systems, and HVAC units for predictive maintenance [6]. Transducers represent the second-largest segment by revenue and are gaining share as portable ultrasound devices proliferate in healthcare settings.

Energy harvesters, while still the smallest segment, carry the strongest growth trajectory within the Piezoelectric Devices Market. These devices convert ambient mechanical vibrations into electrical energy sufficient to power wireless sensor nodes, eliminating battery replacement in hard-to-reach locations such as bridge decks, pipeline corridors, and offshore platforms [11].

By Material

Segment Metric Primary Demand Driver
Ceramics 62.0% share (2025) Cost efficiency and broad application range
Single-Crystal USD 4.85 Billion (2025) High-performance medical and defense applications
Polymers 9.0% CAGR (2026โ€“2035) Flexible and wearable electronics

ย 

Ceramics remain the backbone of the Piezoelectric Devices Market, with lead zirconate titanate compositions still accounting for the majority of commercial shipments. Their dominance reflects decades of optimized manufacturing processes, extensive characterization databases, and qualification in thousands of existing product designs. Single-crystal materials such as PMN-PT deliver 5โ€“10ร— higher strain output than ceramics but remain confined to premium applications where performance justifies cost.

Polymer-based piezoelectrics, led by PVDF and its copolymers, are carving out a distinct niche in flexible, lightweight, and biocompatible applications. Their mechanical compliance makes them ideal for wearable health monitors, electronic skin, and conformable structural sensors where rigid ceramics cannot be used.

By Operating Mode

Segment Metric Primary Demand Driver
Compression/d33 Mode 45.0% share (2025) Stack actuators and force sensors
Shear/d15 Mode 5.85% CAGR (2026โ€“2035) Accelerometers and angular-rate sensors
Thickness Mode 8.5% CAGR (2026โ€“2035) Ultrasonic transducers and RF filters

ย 

The d33 compression mode remains dominant because stack actuators โ€” the workhorses of precision positioning, fuel injection, and industrial valve control โ€” operate in this configuration. Thickness-mode devices are growing fastest within the Piezoelectric Devices Market, propelled by 5G RF filter demand and medical ultrasound transducer arrays that excite piezo elements perpendicular to their electrode faces [4].

By End-User Industry

Segment Metric Primary Demand Driver
Consumer Electronics 29.5% share (2025) Smartphone haptics and RF filtering
IT and Telecommunication USD 6.48 Billion (2025) 5G infrastructure and data-center cooling
Automotive and Transportation 8.1% CAGR (2026โ€“2035) EV sensors and ADAS ultrasonics
Healthcare and Medical Devices 7.8% CAGR (2026โ€“2035) Portable ultrasound and surgical robotics

ย 

Consumer electronics remains the largest end-user vertical for the Piezoelectric Devices Market, with smartphone RF filters alone consuming billions of piezo substrate units annually. The automotive segment is closing the gap rapidly as each new EV platform integrates 20โ€“30 discrete piezoelectric components spanning ultrasonic parking sensors, battery-pack vibration monitors, and cabin haptic feedback actuators [10].

Regional Market Share Analysis

Region Share of Global Market (2025) Primary Investment Themes
Asia-Pacific 41.2% Consumer electronics manufacturing, 5G infrastructure, and automotive supply chains
North America 24.5% Defense modernization, medical devices, industrial IoT
Europe 22.3% Lead-free regulation compliance, automotive electrification, Industrie 4.0
Middle East & Africa 6.8% Oil-and-gas digitization, infrastructure development
South America 5.2% Mining automation, energy exploration
Total 100.0% โ€”

The Piezoelectric Devices Market displays distinct regional demand signatures shaped by industrial composition, regulatory posture, and technology maturity. Asia-Pacific's manufacturing base anchors global volume, while North America and Europe drive high-value defense and medical segments.

ย 

North America

Country CAGR (2026โ€“2035) Key Driver
US 6.4% Defense procurement and medical device innovation
Canada 5.9% Mining sensor deployments and clean-energy programs
Mexico 7.1% Automotive manufacturing nearshoring

ย 

The United States accounts for the largest portion of North American demand in the Piezoelectric Devices Market, underpinned by Department of Defense contracts for sonar arrays, precision guidance systems, and unmanned vehicle sensors. The Pentagon's FY2025 budget allocated USD 17.8 Billion to electronic warfare and sensing systems, a significant share of which flows to piezo component suppliers [13]. Canada's mining sector is adopting ultrasonic thickness gauges and acoustic emission monitors for remote-site structural assessment, while Mexico benefits from automotive OEM relocations that bring embedded piezo sensor demand with them.

Europe

Country Share of European Market (2025) Key Driver
Germany 28.5% Automotive and industrial automation leadership
UK 18.2% Aerospace and defense sensing
France 15.8% Nuclear and aerospace applications
Italy 11.4% Ceramic manufacturing heritage
Spain 7.6% Renewable energy monitoring
Nordic Countries 8.1% Maritime and offshore sensing
Russia 4.8% Oil-and-gas instrumentation
Rest of Europe 5.6% Mixed industrial demand

ย 

Europe's Piezoelectric Devices Market is shaped by the EU's aggressive lead-free transition timeline and the continent's deep automotive supply chains. Germany's Fraunhofer IKTS has invested EUR 85 million in lead-free piezoceramic pilot production since 2022, aiming to de-risk supply for Bosch, Continental, and Siemens [8]. The UK's defense spending trajectory โ€” targeting 2.5% of GDP by 2030 โ€” sustains demand for sonar transducers and guided-munition actuators, while France's nuclear fleet renewal program requires radiation-hardened piezo sensors for reactor monitoring.

Asia-Pacific

Country Share of Asia-Pacific Market (2025) Key Driver
China 38.7% Consumer electronics and 5G base-station manufacturing
Japan 24.3% Advanced ceramics R&D and automotive tier-one supply
South Korea 16.5% Semiconductor and display manufacturing
India 9.8% Defense indigenization and smart-city programs
ASEAN 7.2% Electronics assembly and automotive expansion
Rest of Asia-Pacific 3.5% Mixed demand

ย 

China dominates the Asia-Pacific Piezoelectric Devices Market through vertically integrated manufacturers supplying both domestic smartphone OEMs and global automotive tier-ones. Japan's Murata, TDK, and Kyocera collectively hold leading positions in high-specification piezo ceramics and single-crystal substrates. India's "Make in India" defense program has earmarked INR 150 Billion for indigenous sonar and torpedo guidance development through 2030, pulling piezo transducer production onshore [13].

South America

Country CAGR (2026โ€“2035) Key Driver
Brazil 6.2% Oil-and-gas sensing and mining automation
Argentina 5.8% Lithium extraction monitoring
Rest of South America 5.5% General industrial instrumentation

ย 

Brazil's pre-salt deepwater oil fields require corrosion-resistant piezo pressure sensors rated for extreme subsea environments, while Argentina's expanding lithium mining sector uses ultrasonic level sensors for brine pond management. The Piezoelectric Devices Market in South America remains nascent but benefits from commodity-sector digitization and growing regional manufacturing capacity.

Middle East & Africa

Country CAGR (2026โ€“2035) Key Driver
Saudi Arabia 8.8% Vision 2030 smart infrastructure and Aramco digitization
UAE 8.4% Smart-city sensor networks and defense procurement
South Africa 6.9% Mining instrumentation and industrial automation
Egypt 7.2% Energy infrastructure modernization
Rest of MEA 7.0% Oil-and-gas exploration and utilities

ย 

The Middle East & Africa is the fastest-growing region in the Piezoelectric Devices Market, driven by massive oil-and-gas digitization programs and smart-city investments. Saudi Arabia's NEOM project alone specifies tens of thousands of embedded structural health sensors for its USD 500 billion linear city development [2]. South Africa's mining companies are deploying piezo-based rock-burst early warning systems in deep gold and platinum mines, an application with direct safety implications that accelerates adoption.

Piezoelectric Devices Market By Region, 2025-2035

Competitive Benchmarking

The Piezoelectric Devices Market exhibits moderate concentration, with the top five players controlling an estimated 35โ€“42% of global revenue. Vertical integration โ€” from raw powder synthesis through green-body forming, sintering, and electrode deposition โ€” defines competitive advantage, as it insulates leading manufacturers from upstream supply disruptions in niobium, lithium, and rare-earth dopants [16]. Barriers to entry are significant in high-specification defense and medical segments but lower in commoditized consumer-grade components, where Asian manufacturers compete aggressively on price.

Company Est. Revenue Share Range Key Offerings for Piezoelectric Devices Market Strategic Positioning
TDK Corporation ~8โ€“11% Multilayer piezo actuators, acoustic wave filters, sensors Vertically integrated; dominant in 5G RF components
Murata Manufacturing ~7โ€“10% Ceramic resonators, buzzers, ultrasonic sensors Scale leadership in the consumer electronics supply
Kyocera Corporation ~5โ€“8% Fine-ceramic actuators, inkjet print heads, and medical transducers Diversified materials conglomerate with captive demand
CTS Corporation ~3โ€“5% Frequency products, piezo sensors, and actuators Focused niche player in automotive and industrial
PI Ceramic GmbH ~3โ€“5% High-precision actuators, nanopositioning stages Premium positioning for semiconductor and optics
Meggitt Sensing Systems ~2โ€“4% Accelerometers, pressure sensors, energy harvesting Defense and aerospace specialist (Safran subsidiary)
APC International ~1โ€“3% Custom piezo ceramics, transducers, stacks SME serving R&D and low-volume industrial markets
Johnson Matthey Piezo Products ~2โ€“3% Piezoceramic elements, multilayer benders Materials science heritage; European manufacturing
Mide Technology (Amphenol) ~1โ€“2% Energy harvesters, vibration damping, smart materials Innovation-led; backed by Amphenol distribution
Piezo Systems Inc. ~1โ€“2% Bender elements, generators, custom assemblies U.S.-based rapid prototyping and small-batch supply

ย 

Recent News & Developments

ย 

ย 

ย 

ย 

ย 

ย 

ย 

ย 

ย 

ย 

ย 

Piezoelectric Devices Market Report Scope

Parameter Details
Market Scope Global Piezoelectric Devices Market covering actuators, sensors, transducers, energy harvesters, and associated materials
Study Period 2021โ€“2035
CAGR 6.70% (2026โ€“2035)
Base Year Market Size USD 35.10 Billion (2025)
Forecast Start Market Size USD 37.45 Billion (2026)
Forecast End Market Size USD 67.15 Billion (2035)
Fastest Growing Segments Energy Harvesters (by product type); Polymers (by material); Automotive & Transportation (by end-user)
Companies Profiled 10 major players, including TDK, Murata, Kyocera, CTS, PI Ceramic, Meggitt, APC International, Johnson Matthey, Mide Technology, Piezo Systems
Valuation Currency USD Billion
CAGR Driver Disclaimer Impact percentages are directional and non-additive to the composite CAGR

ย 

FAQs

What procurement lead times should buyers expect for custom piezoelectric ceramic components?
Custom piezoceramic orders typically require 10โ€“16 weeks from specification approval to delivery, depending on geometry complexity and sintering requirements [8]. Standard catalog items ship within 2โ€“4 weeks from major suppliers.
How do single-crystal piezoelectric materials compare with ceramics on a cost-per-performance basis?
Single crystals deliver 5โ€“10ร— greater strain output but cost 8โ€“15ร— more per unit volume than PZT ceramics [9]. They are justified only where extreme sensitivity outweighs budget constraints, such as in medical imaging.
What quality certifications matter most when selecting a Piezoelectric Devices Market supplier for aerospace use?
AS9100D certification is mandatory for aerospace supply chains, and ITAR registration is required for U.S. defense contracts [13]. Suppliers lacking both are effectively excluded from military procurement.
Can piezoelectric energy harvesters realistically power industrial IoT sensors continuously?
Modern harvesters generate 1โ€“10 milliwatts from ambient vibration, sufficient for low-duty-cycle wireless sensor nodes transmitting every 30โ€“60 seconds [11]. Continuous high-bandwidth sensing still requires supplemental battery or supercapacitor storage.
How does the Piezoelectric Devices Market address obsolescence risk for long-lifecycle defense programs?
Suppliers offer lifetime-buy agreements and material-banking services guaranteeing 15โ€“25 years of replacement availability [13]. Multi-sourcing qualification of at least two approved vendors is standard practice.
What testing standards govern the reliability qualification of piezoelectric actuators in automotive applications?
AEC-Q200 is the baseline passive-component qualification standard, supplemented by OEM-specific thermal cycling, humidity, and vibration endurance protocols [5]. Typical qualification cycles run 6โ€“9 months.
How will the EU's lead-free mandate reshape pricing in the Piezoelectric Devices Market by 2030?
Lead-free compositions currently carry a 35โ€“50% cost premium, but pilot-line scaling is expected to narrow that gap to under 10% by 2031 [1]. Early adopters will absorb transition costs, while laggards face margin compression. ย  ย 
Author
Author
Author Profile
Ankit Gupta LinkedIn
Team Lead - Research
Ankit Gupta is a seasoned market intelligence and strategic research professional with over six plus years of experience in the ICT and Semiconductor industries. With academic roots in Telecom, Marketing, and Electronics, he blends technical insight with business strategy. Ankit has led 200+ projects, including work for Fortune 500 clients like Microsoft and Rio Tinto, covering market sizing, tech forecasting, and go-to-market strategies. Known for bridging engineering and enterprise decision-making, his insights support growth, innovation, and investment planning across diverse technology markets.

Research Approach

ย 

Secondary Research

The secondary research process involved comprehensive analysis of regulatory databases, peer-reviewed engineering journals, technical publications, and authoritative industry organizations. Key sources included the US National Institute of Standards and Technology (NIST), European Space Agency (ESA) Materials Database, Institute of Electrical and Electronics Engineers (IEEE), International Electrotechnical Commission (IEC), US Department of Energy (DOE) โ€“ Office of Energy Efficiency & Renewable Energy, National Science Foundation (NSF) Engineering Research Centers, European Commission (EC) โ€“ Horizon Europe Programme, Japan Agency for Marine-Earth Science and Technology (JAMSTEC), German Aerospace Center (DLR), UK National Physical Laboratory (NPL), US Bureau of Industry and Security (BIS), International Trade Administration (ITA), Organisation for Economic Co-operation and Development (OECD) โ€“ Science, Technology and Innovation Outlook, World Intellectual Property Organization (WIPO) Patent Database, European Patent Office (EPO), and national standards bodies including American National Standards Institute (ANSI), British Standards Institution (BSI), Japanese Industrial Standards (JIS), and DIN Deutsches Institut fรผr Normung. These sources were used to collect shipment statistics, regulatory compliance data, material safety studies, patent landscapes, and market landscape analysis for ceramic piezoelectric materials, polymer-based piezoelectric films, single-crystal piezoelectrics, and composite piezoelectric technologies.

ย 

Primary Research

In order to gather both qualitative and quantitative insights, supply-side and demand-side stakeholders were interviewed during the primary research process. CEOs, VPs of R&D, chief technology officers, and heads of strategic business units from makers of piezoelectric devices, suppliers of ceramic materials, and OEMs for precise motion control were examples of supply-side sources. Chief engineers from automotive Tier 1 suppliers, directors of medical device engineering, procurement leaders from defense and aerospace contractors, R&D managers from consumer electronics manufacturers, and technical leads from industrial automation businesses were examples of demand-side sources. Market segmentation, product development roadmaps, and information on supply chain dynamics, pricing tactics, and technology adoption trends were all corroborated by primary research.

Primary Respondent Breakdown:

By Designation: C-level Primaries (28%), Director Level (35%), Others (37%)

By Region: North America (32%), Europe (30%), Asia-Pacific (33%), Rest of World (5%)

ย 

Market Size Estimation

Global market valuation was derived through revenue mapping and unit shipment volume analysis. The methodology included:

Identification of 50+ key manufacturers across North America, Europe, Asia-Pacific, and Latin America specializing in piezoelectric ceramics, polymers, and precision positioning systems

Product mapping across piezoelectric sensors, actuators, transducers, energy harvesters, motors, and high-voltage generators

Analysis of reported and modeled annual revenues specific to piezoelectric device portfolios

Coverage of manufacturers representing 75-80% of global market share in 2024

Extrapolation using bottom-up (unit volume ร— ASP by application and vertical) and top-down (manufacturer revenue validation) approaches to derive segment-specific valuations across automotive, medical, aerospace & defense, consumer electronics, and industrial automation sectors

Download Free Sample

Kindly complete the form below to receive a free sample of this Report

Download PDF ×

We do not share your information with anyone. However, we may send you emails based on your report interest from time to time. You may contact us at any time to opt-out.
















