• Cat-intel
  • MedIntelliX
  • Resources
  • About Us
  • Hero Background
    English
    Chinese
    French
    Japanese
    Korean
    German
    Spanish

    Plant Activators Market Analysis

    ID: MRFR/AGR/4995-HCR
    100 Pages
    Pradeep Nandi
    October 2025

    Plant Activators Market Research Report Information by Source (Biological, Chemical), Form (Powder, Granules, Liquid), Mode of Application (Foliar, Soil Treatment, Others), Crop Type (Pulses & Oilseeds, Cereals & Grains, Fruits & Vegetables, Others) and Region (North America, Europe, Asia-Pacific and Rest of the World) - Forecast till 2035

    Share:
    Download PDF ×

    We do not share your information with anyone. However, we may send you emails based on your report interest from time to time. You may contact us at any time to opt-out.

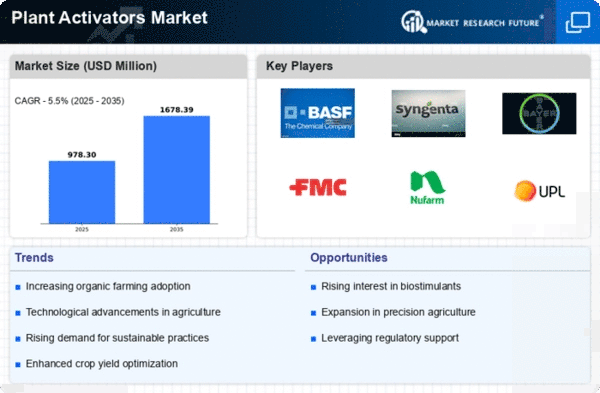
    Plant Activators Market Infographic
    $ 4,950.0
    $ 5,950.0
    $ 7,250.0

    Market Analysis

    In-depth Analysis of Plant Activators Market Industry Landscape

    A variety of market factors determine the characteristics and growth potential of the Plant Activators Market Size. Sustainable agriculture techniques are becoming more important worldwide. As environmental awareness rises, farmers are using plant activators to boost crop resilience and minimize synthetic chemical use. Sustainable and eco-friendly agricultural techniques drive plant activators market growth.

    Plant activators, produced from biological or chemical sources, help plants defend against biotic and abiotic stress. Plant activators are expected to generate USD 880 million by 2024, growing at 6% CAGR. Pest infestations, drought, heat, and fungal and bacterial diseases cause major agricultural production losses, driving plant activator market growth. Growing farming technology and integrated pest management strategies fuel industry growth. Increased agriculture expenditure, especially in affluent nations, may further explain plant activator sales worldwide. However, product scarcity in numerous developing countries and farmers' excessive use of chemical alternatives hinder market expansion. Due to growing knowledge of plant activators and agriculture investments, active suppliers might profit from the market despite these hurdles.

    Climate change and agriculture also affect market size. Farmers are seeking crop protection measures due to weather uncertainty and the rise in catastrophic occurrences like droughts and pests. Plant activators help plants resist environmental challenges by boosting their natural defenses. This increased crop protection need drives the plant activator market.

    Demand for organic products and pesticide-free agricultural techniques drive industry expansion. Farmers seeking to satisfy organic product demand are using plant activators, which are organic-friendly. Plant activators are used due to consumers' increased food awareness and demand for residue-free crops, affecting market size.

    Agriculture technology and plant science research and development shape the plant activators market. New formulations and application strategies boost plant activator efficacy. These improved solutions encourage farmers to embrace them, growing the market.

    Agriculture and agricultural protection laws also affect plant activators market size. Sustainable agricultural standards and synthetic chemical prohibitions urge farmers to use plant activators. Conversely, regulatory impediments or unclear norms might hinder market expansion.

    Globalization and market interconnection affect plant activators market size. Farmers across areas are adopting comparable agricultural techniques because to better knowledge and technology, resulting to increased plant activator usage. International research and development partnerships spread knowledge and technology, increasing market growth.

    Market Summary

    The Global Plant Activators Market is projected to grow from 0.71 USD Billion in 2024 to 1.81 USD Billion by 2035, reflecting a robust growth trajectory.

    Key Market Trends & Highlights

    Plant Activators Key Trends and Highlights

    • The market is expected to witness a compound annual growth rate (CAGR) of 8.81 percent from 2025 to 2035. By 2035, the market valuation is anticipated to reach 1.81 USD Billion, indicating substantial growth potential. In 2024, the market is valued at 0.71 USD Billion, laying a solid foundation for future expansion. Growing adoption of sustainable agricultural practices due to increasing environmental concerns is a major market driver.

    Market Size & Forecast

    2024 Market Size 0.71 (USD Billion)
    2035 Market Size 1.81 (USD Billion)
    CAGR (2025-2035) 8.81%
    Largest Regional Market Share in 2024 south_america)

    Major Players

    <p>Isagro (Italy), <a href="https://www.nutriag.com/">NutriAg Inc. (Canada)</a>, Syngenta (Switzerland), Plant Health Care (US), BASF SE (Germany), Gowan Company (US), Eagle Plant Protect Private Limited (India), Nihon Nohyaku Co. Ltd (Japan), Meiji Holdings Co. Ltd (Japan), Certis USA LLC (US), Arysta LifeScience Corporation (US), Future Bioscience SA (Spain)</p>

    Market Trends

    <p>The increasing emphasis on sustainable agricultural practices and the growing awareness of plant health management are driving a notable shift towards the adoption of plant activators in global markets.</p>

    United States Department of Agriculture (USDA)

    Plant Activators Market Market Drivers

    Rising Demand for Sustainable Agriculture

    The Global Plant Activators Market Industry is experiencing a notable increase in demand for sustainable agricultural practices. As consumers become more environmentally conscious, farmers are seeking solutions that enhance crop yields while minimizing chemical inputs. This shift towards sustainability is reflected in the projected market growth, with the industry expected to reach 0.71 USD Billion in 2024. The adoption of plant activators, which promote natural plant growth and resilience, aligns with global initiatives aimed at reducing the environmental impact of agriculture. Consequently, this trend is likely to drive innovation and investment in plant activator technologies.

    Market Segment Insights

    Regional Insights

    Key Companies in the Plant Activators Market market include

    Industry Developments

    Future Outlook

    Plant Activators Market Future Outlook

    <p>The Global Plant Activators Market is projected to grow at 8.81% CAGR from 2024 to 2035, driven by increasing demand for sustainable agriculture and innovative biostimulant technologies.</p>

    New opportunities lie in:

    • <p>Develop advanced formulations targeting specific crop stressors to enhance yield. Invest in digital agriculture technologies for precision application of plant activators. Expand distribution networks in emerging markets to capture new customer segments.</p>

    <p>By 2035, the market is expected to achieve substantial growth, reflecting a robust demand for innovative agricultural solutions.</p>

    Market Segmentation

    Report Scope

    Market Highlights

    Author

    Pradeep Nandi
    Senior Research Analyst

    She holds an experience of about 6+ years in market research and business consulting, working under the spectrum of information communication technology, telecommunications and semiconductor domains. aarti conceptualizes and implements a scalable business strategy and provides strategic leadership to the clients. her expertise lies in market estimation, competitive intelligence, pipeline analysis, customer assessment, etc.

    Leave a Comment

    Latest Comments

    John Doe
    john@example.com

    This is a great article! Really helped me understand the topic better.

    Posted on July 23, 2025, 10:15 AM
    Jane Smith
    jane@domain.com

    Thanks for sharing this. I’ve bookmarked it for later reference.

    Posted on July 22, 2025, 7:45 PM

    FAQs

    What is the predicted growth rate of the global plant activators market?

    plant activators market is expected to expand at 6% CAGR from 2019 to 2024.

    What is the valuation of the global plant activators market?

    plant activators market size can reach USD 880 million by 2024.

    What is the major driver of the global plant activators market?

    The dip in crop production rates in recent years is the major driver of the global plant activators market.

    What is the challenge faced by the global plant activators market?

    Unavailability of products in certain regions can hamper the global plant activators market growth.

    Which region can dominate the global plant activators market?

    Europe can dominate the global plant activators market till 2024 due to large amount of arable land.

    Name the notable players of the global plant activators market?

    Gowan Company, Eagle Plant Protect Private Limited, Future Bioscience SA, Certis USA LLC, Isagro, NutriAg Inc., Meiji Holdings Co. Ltd, BASF SE, Arysta LifeScience Corporation, Plant Health Care, Syngenta, and Nihon Nohyaku Co. Ltd are major players currently working in the global plant activators market.

    1. Table of Contents
    2. 1 Executive Summary
      1. Market Attractiveness Analysis
        1. Global Plant Activators Market, by Source
        2. Global Plant Activators Market, by Form
        3. Global Plant Activators Market, by Mode of Application
        4. Global Plant Activators Market, by Crop Type
        5. Global Plant Activators Market, by Region
    3. Market Introduction
      1. Definition
      2. Scope of the Study
      3. Market Structure
      4. Key Buying Criteria
      5. Macro Factor Indicator Analysis
    4. Research Methodology
      1. Research Process
      2. Primary Research
      3. Secondary Research
      4. Market Size Estimation
      5. Forecast Model
      6. List of Assumptions
    5. MARKET DYNAMICS
      1. Introduction
      2. Drivers
      3. Restraints
      4. Opportunities
      5. Challenges
    6. MARKET FACTOR ANALYSIS
      1. Value Chain Analysis
      2. Supply Chain Analysis
      3. Porter’s Five Forces Model
        1. Bargaining Power of Suppliers
        2. Bargaining Power of Buyers
        3. Threat of New Entrants
        4. Threat of Substitutes
        5. Intensity of Rivalry
    7. GLOBAL PLANT ACTIVATORS MARKET, BY SOURCE
      1. Introduction
      2. Biological
        1. Biological: Market Estimates & Forecast, by Region/Country, 2022-2030
      3. Chemical
        1. Chemical: Market Estimates & Forecast, by Region/Country, 2022-2030
    8. GLOBAL PLANT ACTIVATORS MARKET, BY FORM
      1. Introduction
      2. Powder
        1. Powder: Market Estimates & Forecast, by Region/Country, 2022-2030
      3. Granules
        1. Granules: Market Estimates & Forecast, by Region/Country, 2022-2030
      4. Liquid
        1. Liquid: Market Estimates & Forecast, by Region/Country, 2022-2030
    9. GLOBAL PLANT ACTIVATORS MARKET, BY MODE OF APPLICATION
      1. Introduction
      2. Foliar
        1. Foliar: Market Estimates & Forecast, by Region/Country, 2022-2030
      3. Soil Treatment
        1. Soil Treatment: Market Estimates & Forecast, by Region/Country, 2022-2030
      4. Others
        1. Others: Market Estimates & Forecast, by Region/Country, 2022-2030
    10. GLOBAL PLANT ACTIVATORS MARKET, BY CROP TYPE
      1. Introduction
      2. Oilseeds & Pulses
        1. Oilseeds & Pulses: Market Estimates & Forecast, by Region/Country, 2022-2030
      3. Cereals & Grains
        1. Cereals & Grains: Market Estimates & Forecast, by Region/Country, 2022-2030
      4. Fruits & Vegetables
        1. Fruits & Vegetables: Market Estimates & Forecast, by Region/Country, 2022-2030
      5. Others
        1. Others: Market Estimates & Forecast, by Region/Country, 2022-2030
    11. GLOBAL PLANT ACTIVATORS MARKET, BY REGION
      1. Introduction
      2. North America
        1. Market Estimates & Forecast, by Source, 2022-2030
        2. Market Estimates & Forecast, by Form, 2022-2030
        3. Market Estimates & Forecast, by Mode of Application, 2022-2030
        4. Market Estimates & Forecast, by Crop Type, 2022-2030
        5. Market Estimates & Forecast, by Country, 2022-2030
        6. US
        7. Canada
        8. Mexico
      3. Europe
        1. Market Estimates & Forecast, by Source, 2022-2030
        2. Market Estimates & Forecast, by Form, 2022-2030
        3. Market Estimates & Forecast, by Mode of Application, 2022-2030
        4. Market Estimates & Forecast, by Crop Type, 2022-2030
        5. Market Estimates & Forecast, by Country, 2022-2030
        6. Germany
        7. UK
        8. France
        9. Spain
        10. Italy
        11. Rest of Europe
      4. Asia-Pacific
        1. Market Estimates & Forecast, by Source, 2022-2030
        2. Market Estimates & Forecast, by Form, 2022-2030
        3. Market Estimates & Forecast, by Mode of Application, 2022-2030
        4. Market Estimates & Forecast, by Crop Type, 2022-2030
        5. Market Estimates & Forecast, by Country, 2022-2030
        6. China
        7. Japan
        8. India
        9. Australia & New Zealand
        10. Rest of Asia-Pacific
      5. Rest of the World
        1. Market Estimates & Forecast, by Source, 2022-2030
        2. Market Estimates & Forecast, by Form, 2022-2030
        3. Market Estimates & Forecast, by Mode of Application, 2022-2030
        4. Market Estimates & Forecast, by Crop Type, 2022-2030
        5. Market Estimates & Forecast, by Region, 2022-2030
        6. South America
        7. Middle East
        8. Africa
    12. Competitive Landscape
      1. Introduction
      2. Competitive Benchmarking
      3. Development Share Analysis
      4. Key Developments & Growth Strategies
    13. COMPANY PROFILES
      1. Isagro
        1. Company Overview
        2. Financial Overview
        3. Products Offered
        4. Key Developments
        5. SWOT Analysis
        6. Key Strategies
      2. NutriAg Inc.
        1. Company Overview
        2. Financial Overview
        3. Products Offered
        4. Key Developments
        5. SWOT Analysis
        6. Key Strategies
      3. Syngenta
        1. Company Overview
        2. Financial Overview
        3. Products Offered
        4. Key Developments
        5. SWOT Analysis
        6. Key Strategies
      4. Plant Health Care
        1. Company Overview
        2. Financial Overview
        3. Products Offered
        4. Key Developments
        5. SWOT Analysis
        6. Key Strategies
      5. BASF SE
        1. Company Overview
        2. Financial Overview
        3. Products Offered
        4. Key Developments
        5. SWOT Analysis
        6. Key Strategies
      6. Gowan Company
        1. Company Overview
        2. Financial Overview
        3. Products Offered
        4. Key Developments
        5. SWOT Analysis
        6. Key Strategies
      7. Eagle Plant Protect Private Limited
        1. Company Overview
        2. Financial Overview
        3. Products Offered
        4. Key Developments
        5. SWOT Analysis
        6. Key Strategies
      8. Nihon Nohyaku Co. Ltd
        1. Company Overview
        2. Financial Overview
        3. Products Offered
        4. Key Developments
        5. SWOT Analysis
        6. Key Strategies
      9. Meiji Holdings Co. Ltd
        1. Company Overview
        2. Financial Overview
        3. Products Offered
        4. Key Developments
        5. SWOT Analysis
        6. Key Strategies
      10. Certis USA LLC
        1. Company Overview
        2. Financial Overview
        3. Products Offered
        4. Key Developments
        5. SWOT Analysis
        6. Key Strategies
      11. Arysta LifeScience Corporation
        1. Company Overview
        2. Financial Overview
        3. Products Offered
        4. Key Developments
        5. SWOT Analysis
        6. Key Strategies
      12. Futureco Bioscience SA
        1. Company Overview
        2. Financial Overview
        3. Products Offered
        4. Key Developments
        5. SWOT Analysis
        6. Key Strategies
    14. APPENDIX
      1. General Sources & References
      2. List of Abbreviation
    15. List of Tables and Figures
      1. LIST OF TABLES
      2. Table 1 Global Plant Activators, by Region, 2022-2030 (USD Million)
      3. Table 2 Global Plant Activators, by Source, 2022-2030 (USD Million)
      4. Table 3 Global Plant Activators, by Form,2022-2030 (USD Million)
      5. Table 4 Global Plant Activators, by Mode of Application, 2022-2030 (USD Million)
      6. Table 5 Global Plant Activators, by Crop Type, 2022-2030 (USD Million)
      7. Table 6 North America: Plant Activators, by Country, 2022-2030 (USD Million)
      8. Table 7 North America: Plant Activators, by Source, 2022-2030 (USD Million)
      9. Table 8 North America: Plant Activators, by Form,2022-2030 (USD Million)
      10. Table 9 North America: Plant Activators, by Mode of Application, 2022-2030 (USD Million)
      11. Table 10 North America: Plant Activators, by Crop Type, 2022-2030 (USD Million)
      12. Table 11 US: Plant Activators, by Source, 2022-2030 (USD Million)
      13. Table 12 US: Plant Activators, by Form,2022-2030 (USD Million)
      14. Table 13 US: Plant Activators, by Mode of Application, 2022-2030 (USD Million)
      15. Table 14 US: Plant Activators, by Crop Type, 2022-2030 (USD Million)
      16. Table 15 Canada: Plant Activators, by Source, 2022-2030 (USD Million)
      17. Table 16 Canada: Plant Activators, by Form,2022-2030 (USD Million)
      18. Table 17 Canada: Plant Activators, by Mode of Application, 2022-2030 (USD Million)
      19. Table 18 Canada: Plant Activators, by Crop Type, 2022-2030 (USD Million)
      20. Table 19 Mexico: Plant Activators, by Source, 2022-2030 (USD Million)
      21. Table 20 Mexico: Plant Activators, by Form,2022-2030 (USD Million)
      22. Table 21 Mexico: Plant Activators, by Mode of Application, 2022-2030 (USD Million)
      23. Table 22 Mexico: Plant Activators, by Crop Type, 2022-2030 (USD Million)
      24. Table 23 Europe: Plant Activators, by Country, 2022-2030 (USD Million)
      25. Table 24 Europe: Plant Activators, by Source, 2022-2030 (USD Million)
      26. Table 25 Europe: Plant Activators, by Form,2022-2030 (USD Million)
      27. Table 26 Europe: Plant Activators, by Mode of Application, 2022-2030 (USD Million)
      28. Table 27 Europe: Plant Activators, by Crop Type, 2022-2030 (USD Million)
      29. Table 28 Germany: Plant Activators, by Source, 2022-2030 (USD Million)
      30. Table 29 Germany: Plant Activators, by Form,2022-2030 (USD Million)
      31. Table 30 Germany: Plant Activators, by Mode of Application, 2022-2030 (USD Million)
      32. Table 31 Germany: Plant Activators, by Crop Type, 2022-2030 (USD Million)
      33. Table 32 France: Plant Activators, by Source, 2022-2030 (USD Million)
      34. Table 33 France: Plant Activators, by Form,2022-2030 (USD Million)
      35. Table 34 France: Plant Activators, by Mode of Application, 2022-2030 (USD Million)
      36. Table 35 France: Plant Activators, by Crop Type, 2022-2030 (USD Million)
      37. Table 36 Italy: Plant Activators, by Source, 2022-2030 (USD Million)
      38. Table 37 Italy: Plant Activators, by Form,2022-2030 (USD Million)
      39. Table 38 Italy: Plant Activators, by Mode of Application, 2022-2030 (USD Million)
      40. Table 39 Italy: Plant Activators, by Crop Type, 2022-2030 (USD Million)
      41. Table 40 Spain: Plant Activators, by Source, 2022-2030 (USD Million)
      42. Table 41 Spain: Plant Activators, by Form,2022-2030 (USD Million)
      43. Table 42 Spain: Plant Activators, by Mode of Application, 2022-2030 (USD Million)
      44. Table 43 Spain: Plant Activators, by Crop Type, 2022-2030 (USD Million)
      45. Table 44 UK: Plant Activators, by Source, 2022-2030 (USD Million)
      46. Table 45 UK: Plant Activators, by Form,2022-2030 (USD Million)
      47. Table 46 UK: Plant Activators, by Mode of Application, 2022-2030 (USD Million)
      48. Table 47 UK: Plant Activators, by Crop Type, 2022-2030 (USD Million)
      49. Table 48 Rest of Europe: Plant Activators, by Source, 2022-2030 (USD Million)
      50. Table 49 Rest of Europe: Plant Activators, by Form,2022-2030 (USD Million)
      51. Table 50 Rest of Europe: Plant Activators, by Mode of Application, 2022-2030 (USD Million)
      52. Table 51 Rest of Europe: Plant Activators, by Crop Type, 2022-2030 (USD Million)
      53. Table 52 Asia-Pacific: Plant Activators, by Country, 2022-2030 (USD Million)
      54. Table 53 Asia-Pacific: Plant Activators, by Source, 2022-2030 (USD Million)
      55. Table 54 Asia-Pacific: Plant Activators, by Form,2022-2030 (USD Million)
      56. Table 55 Asia-Pacific: Plant Activators, by Mode of Application, 2022-2030 (USD Million)
      57. Table 56 Asia-Pacific: Plant Activators, by Crop Type, 2022-2030 (USD Million)
      58. Table 57 China: Plant Activators, by Source, 2022-2030 (USD Million)
      59. Table 58 China: Plant Activators, by Form,2022-2030 (USD Million)
      60. Table 59 China: Plant Activators, by Mode of Application, 2022-2030 (USD Million)
      61. Table 60 China: Plant Activators, by Crop Type, 2022-2030 (USD Million)
      62. Table 61 India: Plant Activators, by Source, 2022-2030 (USD Million)
      63. Table 62 India: Plant Activators, by Form,2022-2030 (USD Million)
      64. Table 63 India: Plant Activators, by Mode of Application, 2022-2030 (USD Million)
      65. Table 64 India: Plant Activators, by Crop Type, 2022-2030 (USD Million)
      66. Table 65 Japan: Plant Activators, by Source, 2022-2030 (USD Million)
      67. Table 66 Japan: Plant Activators, by Form,2022-2030 (USD Million)
      68. Table 67 Japan: Plant Activators, by Mode of Application, 2022-2030 (USD Million)
      69. Table 68 Japan: Plant Activators, by Crop Type, 2022-2030 (USD Million)
      70. Table 69 Australia & New Zealand: Plant Activators, by Source, 2022-2030 (USD Million)
      71. Table 70 Australia & New Zealand: Plant Activators, by Form,2022-2030 (USD Million)
      72. Table 71 Australia & New Zealand: Plant Activators, by Mode of Application, 2022-2030 (USD Million)
      73. Table 72 Australia & New Zealand: Plant Activators, by Crop Type, 2022-2030 (USD Million)
      74. Table 73 Rest of Asia-Pacific: Plant Activators, by Source, 2022-2030 (USD Million)
      75. Table 74 Rest of Asia-Pacific: Plant Activators, by Form,2022-2030 (USD Million)
      76. Table 75 Rest of Asia-Pacific: Plant Activators, by Mode of Application, 2022-2030 (USD Million)
      77. Table 76 Rest of Asia-Pacific: Plant Activators, by Crop Type, 2022-2030 (USD Million)
      78. Table 77 Rest of the World (RoW): Plant Activators, by Country, 2022-2030 (USD Million)
      79. Table 78 Rest of the World (RoW): Plant Activators, by Source, 2022-2030 (USD Million)
      80. Table 79 Rest of the World (RoW): Plant Activators, by Form,2022-2030 (USD Million)
      81. Table 80 Rest of the World (RoW): Plant Activators, by Mode of Application, 2022-2030 (USD Million)
      82. Table 81 Rest of the World (RoW): Plant Activators, by Crop Type, 2022-2030 (USD Million)
      83. Table 82 South America: Plant Activators, by Source, 2022-2030 (USD Million)
      84. Table 83 South America: Plant Activators, by Form,2022-2030 (USD Million)
      85. Table 84 South America: Plant Activators, by Mode of Application, 2022-2030 (USD Million)
      86. Table 85 South America: Plant Activators, by Crop Type, 2022-2030 (USD Million)
      87. Table 86 Middle East: Plant Activators, by Source, 2022-2030 (USD Million)
      88. Table 87 Middle East: Plant Activators, by Form, 2022-2030 (USD Million)
      89. Table 88 Middle East: Plant Activators, by Mode of Application, 2022-2030 (USD Million)
      90. Table 89 Middle East: Plant Activators, by Crop Type, 2022-2030 (USD Million)
      91. Table 90 Africa: Plant Activators, by Source, 2022-2030 (USD Million)
      92. Table 91 Africa: Plant Activators, by Form,2022-2030 (USD Million)
      93. Table 92 Africa: Plant Activators, by Mode of Application, 2022-2030 (USD Million)
      94. Table 93 Africa: Plant Activators, by Crop Type, 2022-2030 (USD Million)   LIST OF FIGURES
      95. FIGURE 1 Global Plant Activators Market Segmentation
      96. FIGURE 2 Forecast Research Methodology
      97. FIGURE 3 Five Forces Analysis of the Global Plant Activators Market
      98. FIGURE 4 Value Chain of the Global Plant Activators Market
      99. FIGURE 5 Share of the Global Plant Activators Market in 2020, by Country (%)
      100. FIGURE 6 Global Plant Activators Market, by Region, 2022-2030,
      101. FIGURE 7 Global Plant Activators Market Size, by Source, 2020
      102. FIGURE 8 Share of the Global Plant Activators Market, by Source, 2022-2030 (%)
      103. FIGURE 9 Global Plant Activators Market Size, by Form, 2020
      104. FIGURE 10 Share of the Global Plant Activators Market, by Form, 2022-2030 (%)
      105. FIGURE 9 Global Plant Activators Market Size, by Mode of Application, 2020
      106. FIGURE 10 Share of the Global Plant Activators Market, by Mode of Application, 2022-2030 (%)
      107. FIGURE 9 Global Plant Activators Market Size, by Crop Type, 2020
      108. FIGURE 10 Share of the Global Plant Activators Market, by Crop Type, 2022-2030 (%)

    Plant Activators Market Segmentation

    Market Segmentation Overview

    • Detailed segmentation data will be available in the full report
    • Comprehensive analysis by multiple parameters
    • Regional and country-level breakdowns
    • Market size forecasts by segment
    Infographic

    Free Sample Request

    Kindly complete the form below to receive a free sample of this Report

    Get Free Sample

    Customer Strories

    “I am very pleased with how market segments have been defined in a relevant way for my purposes (such as "Portable Freezers & refrigerators" and "last-mile"). In general the report is well structured. Thanks very much for your efforts.”

    Victoria Milne

    Founder
    Case Study
    Chemicals and Materials