Plasma Fractionation Market (2026 - 2035)

Plasma Fractionation Market Research Report: Size, Share, Trend Analysis By Applications (Neurology, Hematology, General Medicine, Immunology), By Product Type (Immunoglobulin, Albumin, Coagulation Factors, Protease Inhibitors), By End Users (Hospitals, Ambulatory Surgical Centers, Blood Banks, Pharmaceutical Companies), By Technology (Centrifugation, Chromatography, Precipitation, Filtration) and By Regional (North America, Europe, South America, Asia Pacific, Middle East and Africa) - Growth Outlook & Industry Forecast 2025 To 2035
ID: MRFR/HC/5928-CR
200 Pages
Vikita Thakur, Rahul Gotadki
Last Updated: July 28, 2026
Plasma Fractionation Market
Market Size
Forecast Period2026-2035
CAGR (2026-2035)9.1%
2025 Market SizeUSD 41.4 Billion
2035 Market SizeUSD 98.8 Billion
Key Players
CSL Behring
Grifols
Takeda
Octapharma
Kedrion Biopharma
China Biologic Products
Opportunities
  • Greenfield Fractionation Capacity in Asia-Pacific
  • Next-Generation Purification Technologies
  • Specialty and Hyperimmune Globulin Products

Plasma Fractionation Market Summary

The Plasma Fractionation Market reached an estimated USD 41.4 billion in 2025 and is projected to grow from USD 45.1 billion in 2026 to USD 98.8 billion by 2035, registering a CAGR of 9.1% during the forecast period. This trajectory reflects accelerating global demand for life-saving therapies derived from human blood plasma, driven by rising prevalence of immunodeficiency disorders, hemophilia, and autoimmune conditions. Government health agencies across more than 40 countries expanded plasma collection authorization programs between 2023 and 2025, while private-sector investments in new fractionation facilities exceeded USD 6.5 billion cumulatively over the same period [1][2].

The industry is transitioning from legacy cold-ethanol fractionation techniques toward chromatography-based purification platforms that deliver higher protein recovery yields and improved pathogen safety profiles. Several large-scale facilities commissioned in the U.S. and Europe between 2023 and 2025 adopted continuous-flow chromatography systems, reducing batch processing time by up to 30% [3]. Regulatory harmonization under WHO Prequalification and EMA guidelines has also streamlined cross-border plasma product approvals, opening export pathways for manufacturers in emerging economies.

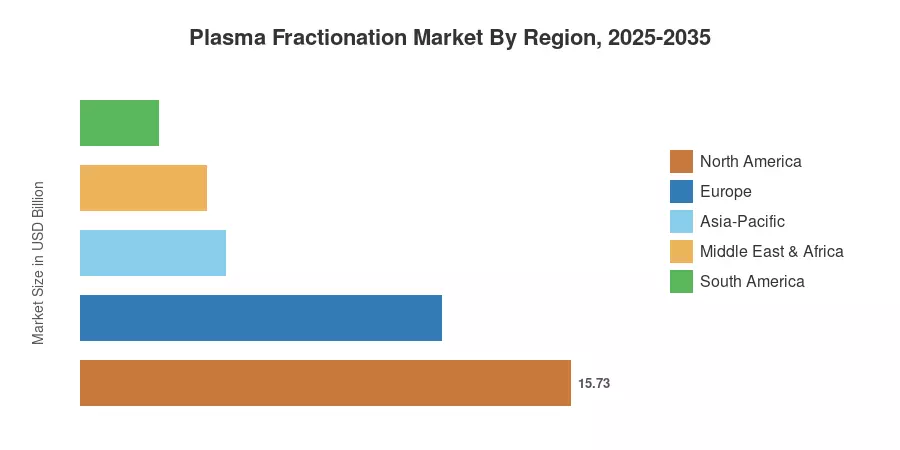
North America commands roughly 38% of the Plasma Fractionation Market, anchored by the world's largest paid plasma donor base and established reimbursement frameworks. Asia-Pacific stands as the fastest-growing region with a forecast CAGR exceeding 11%, propelled by China's national blood product self-sufficiency strategy and India's expanding biologics manufacturing base [4]. Europe holds the second-largest share at approximately 28%, supported by robust public-sector fractionation programs in countries like Australia-aligned contract fractionation and Scandinavian national blood services. The decade ahead will be shaped by capacity expansion, automation, and evolving regulatory standards.


Key Report Takeaways

• By Product

  • Immunoglobulins account for approximately 45% of the Plasma Fractionation Market by revenue, reflecting surging demand for primary immunodeficiency and autoimmune disease treatment globally.
  • Albumin holds the second-largest product share and is forecast to expand at a CAGR of 8.6% through 2035, driven by critical-care and surgical demand in Asia-Pacific hospitals.
  • Coagulation factor concentrates represent a market segment valued at over USD 8.2 billion in 2025, supported by hemophilia treatment access programs in more than 60 countries.

• By End-User

  • Hospitals and clinics consume the majority of plasma-derived products and represent the dominant end-user channel within the Plasma Fractionation Market.
  • Specialty infusion centers are the fastest-growing end-user segment, driven by home-infusion therapy adoption and subcutaneous immunoglobulin formats.

• By Region

  • North America leads the Plasma Fractionation Market with the largest installed fractionation capacity and over 1,100 licensed plasma collection centers.
  • Asia-Pacific is projected to grow at the highest regional CAGR of 11.2%, fueled by regulatory reforms and greenfield facility investments in China, India, and South Korea.


Plasma Fractionation Market Size and Forecast (2021–2035)

Market size estimates are derived from a bottom-up analysis combining plasma collection volumes, average yield per liter of source plasma, product-specific pricing benchmarks, and regional consumption patterns. Historical figures (2021–2024) draw on disclosed company revenues, trade data, and regulatory filings, while forecast values (2026–2035) apply a 9.1% compound annual growth rate calibrated against demographic, policy, and capacity-expansion variables [1].
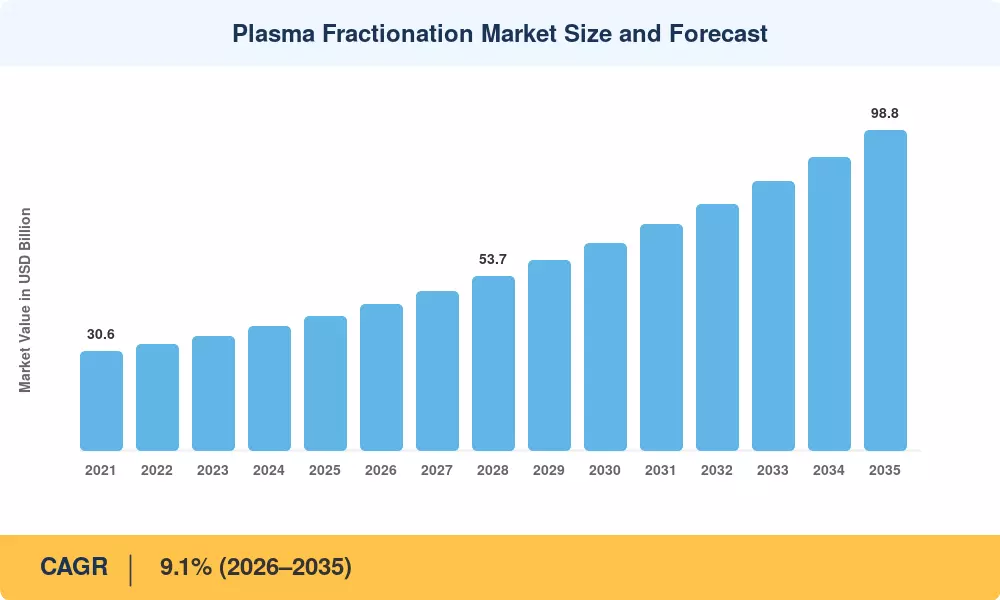
Plasma Fractionation Market Size and Forecast
Our Impact
Enabled $4.3B Revenue Impact for Fortune 500 and Leading Multinationals
Partnering with 2000+ Global Organizations Each Year
30K+ Citations by Top-Tier Firms in the Industry

Driver Impact Analysis

Driver ~% Impact on CAGR Geographic Relevance Impact Timeline
Rising immunodeficiency & autoimmune disease prevalence ~22% Global Long-term (≥4 yr)
Plasma collection infrastructure expansion ~20% North America, Asia-Pacific Medium-term (2–4 yr)
Subcutaneous immunoglobulin adoption ~15% Europe, North America Short-term (≤2 yr)
Government self-sufficiency mandates ~14% Asia-Pacific, South America Medium-term (2–4 yr)
Chromatography & continuous-processing upgrades ~12% Europe, North America Medium-term (2–4 yr)
Aging population demographics ~10% Global Long-term (≥4 yr)
Reimbursement & formulary expansion ~7% North America, Europe Short-term (≤2 yr)


Rising Immunodeficiency and Autoimmune Disease Prevalence

Primary immunodeficiency diagnoses have increased by an estimated 15% globally over the past decade, with improved diagnostic tools uncovering previously undiagnosed cases across both pediatric and adult populations [1]. The Jeffrey Modell Foundation's 2024 global survey identified more than 6 million patients receiving immunoglobulin replacement therapy, up from approximately 4.8 million five years earlier. Chronic inflammatory demyelinating polyneuropathy (CIDP) and multifocal motor neuropathy approvals have further broadened the addressable patient base for the Plasma Fractionation Market, creating durable long-term demand.

Plasma Collection Infrastructure Expansion

The United States alone added roughly 180 new plasma collection centers between 2022 and 2025, bringing the national total past 1,100 facilities [2]. Companies such as CSL Plasma, BioLife Solutions, and Grifols each invested more than USD 500 million in greenfield and brownfield center construction during this period. Outside North America, China's NMPA licensed 12 new blood product companies for plasma collection between 2023 and 2025, expanding the country's donor station count by over 25% [4].

Subcutaneous Immunoglobulin Adoption

Subcutaneous immunoglobulin (SCIg) therapy has shifted the treatment paradigm by enabling patient self-administration at home, reducing hospital visits and infusion-related adverse events [3]. The U.S. FDA approved two new SCIg formulations in 2024, and European uptake of SCIg now exceeds 40% of all immunoglobulin administrations in Nordic countries. This shift expands the Plasma Fractionation Market by improving patient compliance and increasing per-patient plasma consumption over time.

Government Self-Sufficiency Mandates

China's "14th Five-Year Plan for Blood Products" set an explicit target to increase domestic plasma fractionation capacity by 50% by 2027, backing the goal with provincial subsidies exceeding USD 1.2 billion [4]. Brazil's Hemobrás program similarly expanded public-sector fractionation, while India's Central Drugs Standard Control Organization fast-tracked approvals for three new domestic fractionators in 2024 [9]. These policy-driven capacity additions directly influence the Plasma Fractionation Market in emerging regions.


Restraints Impact Analysis

Restraint impact percentages represent estimated drag on the market CAGR and are directional rather than precisely additive. They capture regulatory, supply-chain, and competitive headwinds that may moderate the growth trajectory of the Plasma Fractionation Market.

Restraint ~% Impact on CAGR Geographic Relevance Impact Timeline
Plasma supply shortages & donor fatigue ~–18% Global Medium-term (2–4 yr)
Recombinant therapy substitution ~–16% North America, Europe Long-term (≥4 yr)
Stringent regulatory & safety requirements ~–12% Global Short-term (≤2 yr)
High manufacturing & cold-chain costs ~–10% Emerging markets Medium-term (2–4 yr)
Ethical concerns around paid plasma donation ~–8% Europe, South America Long-term (≥4 yr)


Plasma Supply Shortages and Donor Fatigue

Global plasma collection still depends heavily on paid donors in the United States, which supplies approximately 60–70% of the world's source plasma [7]. Pandemic-era disruptions demonstrated the fragility of this concentration, and donor retention rates have declined by an estimated 8% since 2022 as post-pandemic economic conditions changed donor incentive dynamics. Any sustained contraction in U.S. collection volumes propagates supply shortfalls across the entire Plasma Fractionation Market, constraining production capacity regardless of downstream demand.

Recombinant Therapy Substitution

The addressable market for plasma-derived coagulation concentrates has been slowly chipped at by recombinant clotting factors and gene therapies for hemophilia A and B [8]. The FDA’s approval of fitusiran and valoctocogene roxaparvovec broadened the non-plasma options, with gene therapy possibly providing functional cures for a fraction of hemophilia patients. Recombinant products today are only touching a very narrow therapeutic slice, but further development of the pipeline might take revenue from the Plasma Fractionation Market in coagulation divisions over the next decade.


Stringent Regulatory and Safety Requirements

Plasma-derived products are regulated under some of the most stringent processes in the pharmaceutical industry, including required confirmation of pathogen inactivation/removal, lot-release testing, and traceability from donor to finished product [13]. Compliance expenses are anticipated to raise manufacturing overheads by 12-18%. This disproportionately impacts smaller fractionators and creates a barrier to entry for new entrants in the Plasma Fractionation Market.


Plasma Fractionation Market Opportunities

Greenfield Fractionation Capacity in Asia-Pacific

Governments in the Asia-Pacific region are subsidising indigenous fractionation infrastructure to lessen dependence on imports. China is targeting to gather 18,000 tonnes of plasma annually by 2028, which is roughly double the 2022 levels, while India’s Department of Pharmaceuticals has allotted INR 15 billion for the establishment of biologics parks. Companies that develop an early manufacturing presence in these markets are poised to gain a substantial part of the Plasma Fractionation Market, as local demand surpasses supply.


Next-Generation Purification Technologies

Continuous chromatography, membrane-based fractionation and affinity-ligand platforms are predicted to boost protein recovery yields by 15–25% relative to standard Cohn cold-ethanol techniques. These technologies also help reduce solvent and water use, supporting ESG reporting requirements and reducing unit production costs for high-volume fractionators.


Specialty and Hyperimmune Globulin Products

Hyperimmune globulins targeting specific pathogens — including anti-D, hepatitis B, rabies, and emerging respiratory viruses — represent a high-margin niche within the Plasma Fractionation Market. Several manufacturers launched pathogen-specific hyperimmune products during 2023–2025, and pandemic-preparedness frameworks now include hyperimmune stockpiling provisions in national health security strategies [16].

Digital Donor Management and Plasma Traceability Platforms

New business models centered on digital donor platforms — integrating scheduling, health screening, compensation management, and blockchain-based traceability — are emerging as value-creation levers for plasma collectors. Companies deploying app-based donor engagement report 20–30% higher retention rates, directly supporting collection throughput.

Emerging-Market Access and Contract Fractionation

Public-sector fractionation programs in South America, the Middle East, and Africa increasingly rely on toll-manufacturing partnerships with established European and North American fractionators. Contract fractionation revenues are projected to grow at a premium to the overall Plasma Fractionation Market as governments in these regions scale national blood product programs without building full in-house capacity.


Plasma Fractionation Market Future Outlook

Automation and AI-Driven Manufacturing

Fractionation facilities of the next decade will increasingly deploy AI-powered process analytical technology (PAT) to optimize protein yields in real-time. Predictive algorithms monitoring column pressure, pH gradients, and conductivity can raise batch consistency while cutting manual quality-control interventions by an estimated 40% [11]. These digital manufacturing capabilities will reshape cost structures across the Plasma Fractionation Market.

Recombinant and Plasma Hybrid Therapeutic Landscape

Rather than displacing plasma-derived products entirely, the recombinant pipeline is evolving toward complementary positioning. Gene therapies address specific coagulation deficiencies, but immunoglobulins, albumin, and alpha-1 antitrypsin remain irreplaceable plasma products with no viable recombinant substitute at clinical scale [8]. The Plasma Fractionation Market will thus coexist with — rather than be cannibalized by — the gene therapy sector through 2035.

ESG and Ethical Donor Frameworks

Sustainability reporting mandates (GRI, SASB) and ethical scrutiny of paid plasma donation practices will push companies toward more transparent donor compensation models and carbon-neutral facility operations [15]. The WHO's 2023 guidance on voluntary non-remunerated donation created a policy tension that may reshape collection models in Europe and parts of Asia, influencing how the Plasma Fractionation Market sources its critical raw material.

Global Pandemic Preparedness and Hyperimmune Stockpiling

Post-COVID-19 national health security frameworks increasingly include convalescent and hyperimmune plasma stockpiling provisions. The U.S. BARDA allocated USD 250 million between 2023 and 2025 for hyperimmune globulin development programs targeting pandemic-potential pathogens [16]. These preparedness investments create a structural demand floor for the Plasma Fractionation Market that is partially decoupled from routine clinical consumption cycles.


Plasma Fractionation Market Segmentation

By Product

Segment Key Metric Primary Demand Driver
Immunoglobulins ~45% market share (2025) PID, CIDP, autoimmune therapy expansion
Albumin CAGR 8.6% (2026–2035) Critical-care and surgical use in Asia-Pacific
Platelets and Coagulation Factor Concentrates USD 8.2 billion (2025) Hemophilia treatment programs globally
Other Products ~7% market share (2025) Alpha-1 antitrypsin, fibrin sealants


Immunoglobulins command the largest share of the Plasma Fractionation Market by product, driven by expanding indications across neurology, immunology, and hematology. Polyvalent intravenous immunoglobulin (IVIg) remains the volume leader, though subcutaneous formulations are gaining ground due to patient convenience and reduced infusion-site reactions [3]. The shift toward 20% concentration SCIg products has been particularly pronounced in Europe and North America, increasing the plasma volume required per treatment course.

Albumin ranks as the second-largest product segment and is the dominant plasma-derived product in Asia-Pacific, where it is widely used in liver disease management, major surgery, and critical care. China alone consumed an estimated 55% of global albumin supply in 2024, creating a structural supply-demand imbalance that continues to drive import volumes and domestic capacity investments within the Plasma Fractionation Market [4].

By Application

Segment Key Metric Primary Demand Driver
Neurology ~30% market share (2025) CIDP, Guillain-Barré syndrome treatment
Immunology CAGR 9.8% (2026–2035) Primary immunodeficiency diagnosis growth
Hematology USD 7.8 billion (2025) Hemophilia A/B, von Willebrand disease
Critical Care ~14% market share (2025) Albumin use in ICU and surgical settings
Other Applications CAGR 8.2% (2026–2035) Transplant, burns, infectious disease


Neurology represents the largest application segment in the Plasma Fractionation Market, reflecting the essential role of immunoglobulins in treating CIDP, Guillain-Barré syndrome, and myasthenia gravis. Immunology applications are the fastest-growing segment as diagnostic improvements continue to identify previously undiagnosed primary immunodeficiency patients worldwide [1].

By End-User

Segment Key Metric Primary Demand Driver
Hospitals and Clinics ~62% market share (2025) Inpatient administration, surgical demand
Specialty Infusion Centers CAGR 11.5% (2026–2035) Home infusion, SCIg self-administration
Other End-Users USD 3.1 billion (2025) Military, blood banks, research institutions


Hospitals and clinics represent the dominant distribution channel across the Plasma Fractionation Market, handling the majority of IVIg and albumin administrations. Specialty infusion centers are emerging as the fastest-growing channel, enabled by the proliferation of subcutaneous immunoglobulin products that allow nurse-supervised or patient self-administered therapy outside the hospital setting [3].

By Sector

Segment Key Metric Primary Demand Driver
Private Fractionators ~72% market share (2025) CSL, Grifols, Takeda commercial operations
Public Fractionators CAGR 8.3% (2026–2035) National blood service self-sufficiency programs


Private fractionators dominate the Plasma Fractionation Market, led by vertically integrated global players that control plasma collection, fractionation, and distribution. Public fractionators — including France's LFB, the Netherlands' Sanquin, and Brazil's Hemobrás — play a critical role in national blood product self-sufficiency strategies and typically operate on a not-for-profit or cost-recovery basis [15].


Regional Market Share Analysis

Region Key Metric Primary Investment Themes
North America ~38% market share (2025) Donor base expansion, SCIg uptake
Europe USD 11.6 billion (2025) Public fractionation, regulatory harmonization
Asia-Pacific CAGR 11.2% (2026–2035) Domestic self-sufficiency, greenfield plants
South America USD 2.5 billion (2025) Contract fractionation, Hemobrás expansion
Middle East & Africa CAGR 9.8% (2026–2035) National blood services modernization
Total USD 41.4 billion (2025)

The Plasma Fractionation Market exhibits a clear North America–Europe concentration, though Asia-Pacific is closing the gap rapidly. Regional dynamics are shaped by plasma collection regulations, reimbursement structures, disease prevalence, and manufacturing capacity.


North America

Country Key Metric Key Driver
United States ~82% of regional share Largest paid-donor plasma supply globally
Canada CAGR 8.4% Canadian Blood Services procurement expansion
Mexico USD 0.6 billion (2025) Growing hospital plasma product utilization


North America dominates the Plasma Fractionation Market owing to the U.S. paid-donor model, which collected over 55 million liters of source plasma in 2024 [2]. The U.S. accounts for the vast majority of regional revenues, supported by established insurance reimbursement for immunoglobulin therapies and a mature network of specialty pharmacies. Canada's publicly administered blood system and Mexico's expanding private healthcare sector provide incremental growth, though both remain modest relative to U.S. volumes.

Europe

Country Key Metric Key Driver
Germany ~24% of regional share Strong clinical demand, Biotest/Octapharma capacity
United Kingdom CAGR 8.1% NHS immunoglobulin demand management program
France USD 1.6 billion (2025) LFB national fractionation mandate
Italy ~11% of regional share Kedrion domestic manufacturing
Spain CAGR 7.9% Grifols headquarter operations
Nordic Countries USD 0.7 billion (2025) High SCIg adoption rates
Russia ~4% of regional share Import substitution policy
Rest of Europe CAGR 7.5% Mixed public-private fractionation models


Europe's Plasma Fractionation Market benefits from long-standing public-sector fractionation programs in France (LFB), the Netherlands (Sanquin), and Finland (Finnish Red Cross Blood Service). Germany is the largest European market by revenue, hosting major manufacturing operations from Octapharma and Biotest. The European Medicines Agency's centralized procedure for plasma-derived medicinal products continues to streamline cross-border distribution, while the UK's NHS Immunoglobulin Commissioning Framework directs clinical utilization patterns [6][15].

Asia-Pacific

Country Key Metric Key Driver
China ~48% of regional share NMPA donor station expansion, self-sufficiency targets
India CAGR 12.8% New fractionation plants by Intas, Reliance Life
Japan USD 1.4 billion (2025) Aging population, high per-capita IG use
South Korea ~7% of regional share Green Cross Corporation domestic supply
ASEAN CAGR 10.5% Growing hospital infrastructure investment
Rest of Asia-Pacific USD 0.4 billion (2025) Regional procurement partnerships


Asia-Pacific represents the fastest-growing geography in the Plasma Fractionation Market. China's licensed blood product manufacturers — including China Biologic Products, Tiantan Biological, and Shanghai RAAS — are scaling collection volumes to meet domestic albumin and immunoglobulin demand that currently exceeds local supply by an estimated 40% [4]. India approved six new fractionation facility proposals between 2023 and 2025, with Intas Pharmaceuticals and Reliance Life Sciences leading capacity build-outs [9].

South America

Country Key Metric Key Driver
Brazil ~58% of regional share Hemobrás public fractionation program
Argentina CAGR 8.7% Hospital demand growth, import reliance
Rest of South America USD 0.5 billion (2025) Pan American Health Organization initiatives


Brazil's state-owned Hemobrás fractionation facility in Pernambuco anchors South America's Plasma Fractionation Market, processing domestically collected plasma to reduce import dependence on U.S. and European products. Argentina and Colombia rely primarily on imported finished products, though regional governments are exploring toll-manufacturing agreements to improve supply resilience [10].

Middle East & Africa

Country Key Metric Key Driver
Saudi Arabia ~32% of regional share Vision 2030 healthcare investment
UAE CAGR 10.2% Medical tourism hub, specialty hospital growth
South Africa USD 0.3 billion (2025) South African National Blood Service processing
Egypt ~12% of regional share Population-driven albumin demand
Rest of MEA CAGR 8.9% WHO-supported blood services modernization


The Middle East & Africa segment of the Plasma Fractionation Market remains import-dependent for most finished products, though Saudi Arabia and the UAE have invested in blood service modernization under broader healthcare development agendas. South Africa operates the continent's most advanced blood processing infrastructure through the South African National Blood Service, while Egypt's large population base generates significant albumin demand for liver disease management [16].


Plasma Fractionation Market By Region, 2025-2035

Competitive Benchmarking

The Plasma Fractionation Market exhibits medium concentration, with the top five companies collectively holding an estimated 55–65% of global revenue. The Herfindahl-Hirschman Index (HHI) for the sector falls in the moderately concentrated range (~1,200–1,500), reflecting a structure where three dominant multinationals coexist with a diverse tier of regional and specialty players. Barriers to entry remain high given the capital-intensive nature of fractionation facilities, stringent regulatory requirements, and the need for reliable source plasma supply chains.

Company Est. Revenue Share Range Key Offerings for Plasma Fractionation Market Strategic Positioning
CSL Behring ~22–26% Privigen, Hizentra, Albumex, Haegarda Vertically integrated global leader; largest plasma collection network
Grifols ~16–20% Flebogamma, Gamunex-C, Albutein Strong U.S. collection footprint; diagnostics integration
Takeda (BioLife) ~12–15% Gammagard, Cuvitru, FEIBA, Albumin Broad portfolio post-Shire acquisition; global reach
Octapharma ~8–11% Octagam, Nuwiq, Albunorm European-headquartered; 40+ country presence
Kedrion Biopharma ~4–6% KedriGamma, Albuminex, RhoGAM Italian specialty player; Permira-backed expansion
China Biologic Products ~3–5% Human albumin, IVIG, Factor VIII Dominant Chinese domestic manufacturer
ADMA Biologics ~2–4% ASCENIV, Bivigam, Nabi-HB Specialty hyperimmune focus; U.S.-centric
Biotest AG ~2–3% Intratect, Albiomin, Haemonine German fractionator; Grifols acquisition integration
Bio Products Laboratory (BPL) ~1–3% Zutectra, Coagadex, Albuminex UK-based; NHS supply heritage
Sanquin Blood Supply ~1–2% Nanogam, Cinryze (contract) Dutch public-sector fractionator; not-for-profit


Recent News & Developments

  • CSL Plasma (October 2024) launched the RIKA Plasma Donation System in Houston, decreasing the donation process by 15 minutes.


  • ADMA Biologics (January 2025): Reported record quarterly revenues exceeding USD 110 million, driven by ASCENIV demand for immunodeficiency patients with recurrent infections, signaling specialty hyperimmune growth within the Plasma Fractionation Market [18].


Plasma Fractionation Market Report Scope

Parameter Detail
Market Scope Global Plasma Fractionation Market covering product, application, end-user, sector, and regional dimensions
Study Period 2021–2035
CAGR 9.1% (2026–2035)
Market Size (2025) USD 41.4 Billion
Market Size (2035) USD 98.8 Billion
Fastest Growing Segment Asia-Pacific (by region); Specialty Infusion Centers (by end-user)
Companies Profiled 10 (CSL Behring, Grifols, Takeda, Octapharma, Kedrion, China Biologic Products, ADMA Biologics, Biotest, BPL, Sanquin)
Valuation Currency USD (Billion)


FAQs

How does plasma donor compensation regulation differ across major markets, and what does it mean for supply?
The U.S. permits paid donation, supplying 60–70% of global source plasma, while EU countries predominantly rely on voluntary unpaid donors [2]. This regulatory split creates structural supply concentration that directly influences pricing and availability worldwide.
What capital investment is required to establish a greenfield plasma fractionation facility?
A modern fractionation plant capable of processing 3–4 million liters annually typically requires USD 500–800 million in capital expenditure and 4–5 years from groundbreaking to regulatory licensure [11]. This high barrier limits new market entrants significantly.
How do subcutaneous immunoglobulin products change the competitive dynamics for fractionators?
SCIg formulations command premium pricing and shift volume toward 20% concentration products, increasing plasma input per dose [3]. Fractionators with integrated collection-to-finished-product supply chains gain margin advantages over toll manufacturers.
What role does contract fractionation play for countries without domestic manufacturing capacity?
Governments ship collected plasma to established fractionators abroad under toll-processing agreements, receiving finished products in return [10]. This model enables national self-sufficiency goals without the full capital burden of building domestic plants.
How vulnerable is the Plasma Fractionation Market to gene therapy disruption in the hemophilia segment?
Gene therapies address a narrow subset of hemophilia patients, and coagulation factors represent roughly 20% of total fractionation revenue [8]. Immunoglobulin and albumin segments remain unaffected, limiting the overall displacement risk.
What quality and traceability standards must plasma fractionators meet for global distribution?
Products must comply with EU GMP Annex 14, FDA 21 CFR 600, and WHO Prequalification standards, including full donor-to-patient traceability [13]. These multi-layered requirements make regulatory compliance a durable competitive moat.
How are digital technologies improving plasma collection center efficiency?
App-based donor scheduling, AI-powered health screening, and automated plasmapheresis systems have increased per-center throughput by 15–25% at leading operators [2]. These tools also improve donor retention, stabilizing the raw material supply chain.    
Author
Author
Author Profile
Vikita Thakur LinkedIn
Senior Research Analyst
She holds an experience of about 5+ years in market research and business consulting projects for sectors such as life sciences, medical devices, and healthcare IT. She possesses a robust background in data analysis, market estimation, competitive intelligence, pipeline analysis market trend identification, and consumer behavior insights. Her expertise lies in technical Sales support, client interaction and project management, designing and implementing market research studies, conducting competitive analysis, and synthesizing complex data into actionable recommendations that drive business growth.
Co-Author
Co-Author Profile
Rahul Gotadki LinkedIn
Research Manager
He holds an experience of about 9+ years in Market Research and Business Consulting, working under the spectrum of Life Sciences and Healthcare domains. Rahul conceptualizes and implements a scalable business strategy and provides strategic leadership to the clients. His expertise lies in market estimation, competitive intelligence, pipeline analysis, customer assessment, etc.

Research Approach


Secondary Research

The secondary research process involved comprehensive analysis of regulatory databases, peer-reviewed hematology and immunology journals, blood banking publications, and authoritative health organizations. Key sources included the US Food & Drug Administration (FDA) Center for Biologics Evaluation and Research (CBER), European Medicines Agency (EMA) Committee for Medicinal Products for Human Use (CHMP), World Health Organization (WHO) Blood Products and Related Biologicals, Plasma Protein Therapeutics Association (PPTA) Industry Reports, International Society of Blood Transfusion (ISBT), National Institutes of Health (NIH) National Heart, Lung, and Blood Institute (NHLBI), National Center for Biotechnology Information (NCBI/PubMed), Centers for Disease Control and Prevention (CDC) Division of Blood Disorders, European Centre for Disease Prevention and Control (ECDC), International Conference on Harmonisation (ICH) guidelines, and national health ministry reports from key plasma collection markets (US, Germany, UK, France, Italy, Spain, China, Japan, Australia). These sources were used to collect plasma donation statistics, fractionation capacity data, regulatory approval pathways, viral safety studies, hemophilia and immunodeficiency prevalence data, and therapeutic usage patterns for immunoglobulins (IVIG/SCIG), albumin, coagulation factors (Factor VIII, Factor IX, PCC, fibrinogen), and alpha-1 proteinase inhibitors.


Primary Research

As part of the initial research process, stakeholders from both the supply and demand sides were interviewed to get both qualitative and quantitative information. CEOs, VPs of Manufacturing Operations, directors of plasma procurement, heads of regulatory affairs, and directors of fractionation facilities from plasma-derived therapeutic makers and plasma collection center operators were some of the supply-side sources. Hematologists, immunologists, blood bank directors, hospital pharmacy heads, and procurement leads from big medical centers, hemophilia treatment centers, immunology clinics, and specialty infusion centers were on the demand side. Primary research confirmed the use of fractionation capacity, confirmed trends in plasma collection volume, and learned more about how immunoglobulins are used in critical care, how albumin is used, factor replacement therapy protocols, and how reimbursement works for therapies derived from plasma.

Primary Respondent Breakdown:

By Designation: C-level Primaries (28%), Director Level (32%), Others (40%)

By Region: North America (32%), Europe (29%), Asia-Pacific (26%), Rest of World (13%)


Market Size Estimation

Global market valuation was derived through fractionation capacity analysis and plasma protein therapeutic revenue mapping. The methodology included:

Identification of 35+ key fractionators and plasma-derived therapeutic manufacturers across North America, Europe, Asia-Pacific, and Latin America

Product mapping across immunoglobulins (IVIG, SCIG), albumin, coagulation factors (Factor VIII, Factor IX, von Willebrand factor, PCC, fibrinogen), protease inhibitors (Alpha-1), and specialty plasma products

Analysis of reported and modeled annual revenues specific to plasma fractionation portfolios and plasma collection volumes

Coverage of manufacturers representing 75-80% of global fractionation capacity and plasma protein therapeutic market share in 2024

Extrapolation using bottom-up (plasma collection volume × yield rates × ASP by product category and country) and top-down (manufacturer revenue validation against fractionation capacity utilization) approaches to derive segment-specific valuations for immunology, hematology, neurology, pulmonology, and critical care applications

Download Free Sample

Kindly complete the form below to receive a free sample of this Report

Download PDF ×

We do not share your information with anyone. However, we may send you emails based on your report interest from time to time. You may contact us at any time to opt-out.
















