Segmentation Quick Reference
| Dimension | Sub-Segments | Dominant Segment | Fastest Growing Segment |
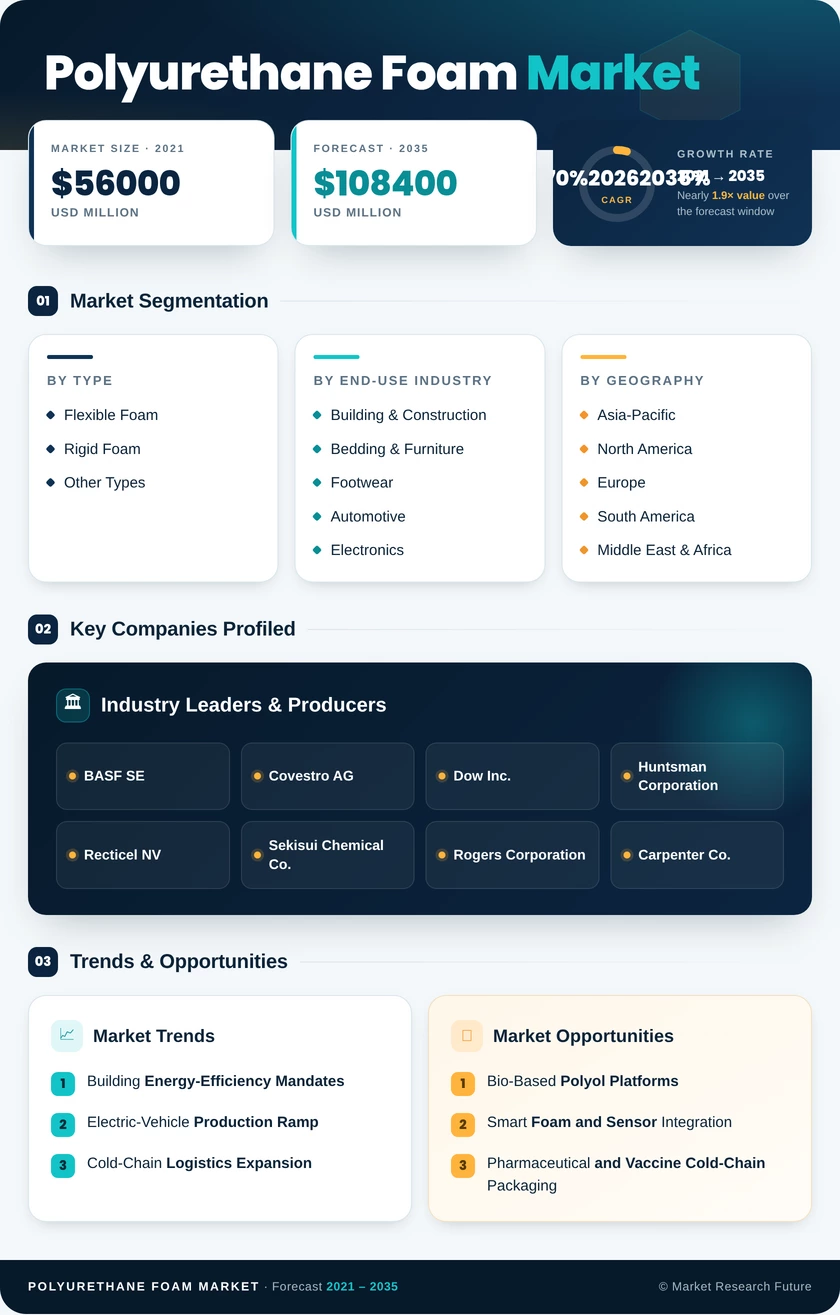
| By Type | Flexible Foam, Rigid Foam, Other Types | Flexible Foam (52% share, 2025) | Other Types (7.00% CAGR) |
| By End-Use Industry | Building & Polyurethane Foam Market, Bedding & Furniture, Footwear, Automotive, Electronics, Packaging, Other End-Use Industries | Building & Polyurethane Foam Market (38% share, 2025) | Packaging (7.80% CAGR) |
| By Geography | Asia-Pacific, North America, Europe, South America, Middle East & Africa | Asia-Pacific (46% share, 2025) | Asia-Pacific (5.80% CAGR) |
Market Segmentation Overview
By Type
| Sub-Segment | Key Trend |
| Flexible Foam | Viscoelastic grades gaining share in premium mattress and automotive seating applications |
| Rigid Foam | PIR boardstock and pentane-blown panels displacing XPS in commercial roofing insulation |
| Other Types | Spray, integral-skin, and viscoelastic specialty formats expanding in retrofit and EV applications |
Flexible foam remains the volume leader, driven by steady bedding and furniture replacement cycles. Rigid foam is growing faster as building energy codes mandate higher R-value envelopes globally. Other types—particularly spray polyurethane foam—are the fastest-growing category as contractors and OEMs seek application-specific performance in tight or irregular geometries.
By End-Use Industry
| Sub-Segment | Key Trend |
| Building & Polyurethane Foam Market | Energy-code upgrades lifting mandatory insulation specifications worldwide |
| Bedding & Furniture | Premiumization of sleep products driving memory-foam and hybrid-mattress adoption |
| Footwear | TPU and PU midsole innovation in athletic and performance footwear |
| Automotive | EV battery-pack enclosures and lightweighting expanding foam content per vehicle |
| Electronics | Thermal management pads and cushioning for consumer devices and semiconductors |
| Packaging | E-commerce fulfillment and pharma cold-chain creating high-growth demand for protective foam |
| Other End-Use Industries | Marine, aerospace, and sports equipment applications |
Building and construction is the largest end-use category, directly tied to regulatory mandates that specify minimum insulation performance. Packaging is the fastest-growing segment, propelled by the intersection of e-commerce logistics growth and pharmaceutical cold-chain requirements that demand reliable thermal-insulation solutions.
By Geography
| Sub-Segment | Key Trend |
| Asia-Pacific | China building codes and India urbanization driving dominant regional consumption |
| North America | Residential retrofit spending and cold-chain expansion sustaining mature-market growth |
| Europe | EPBD compliance and circular-economy mandates reshaping product mix toward bio-based foams |
| South America | Infrastructure stimulus and agribusiness cold-chain investment accelerating off a low base |
| Middle East & Africa | Giga-project construction and green-building regulations creating step-change demand |
Asia-Pacific maintains the largest regional share, anchored by China's integrated manufacturing base and India's infrastructure investment cycle. North America and Europe together account for roughly 44% of global demand, with growth increasingly weighted toward retrofit and sustainability-driven applications rather than new-build volume.