Port Infrastructure Market (2026 - 2035)

Port Infrastructure Market Research Report Information By Port Type (Seaport, Inland Port, and Other [Dry Ports, Free Zones]), By Application (Cargo and Passenger), By Ownership Model (Public and Private), By Technology Adoption Level (Conventional, Semi-Automated, and Fully Automated) – Forecast Till 2035
ID: MRFR/PCM/26712-HCR
111 Pages
Snehal Singh
Last Updated: July 22, 2026
Port Infrastructure Market
Market Size
Forecast Period2026-2035
CAGR (2026-2035)5.10%
2021 Market Size225.9 USD Billion
2022 Market Size237.42 USD Billion
Key Players
China Communications Construction Co.
DP World
APM Terminals
Hutchison Port Holdings
PSA International
Bechtel Corporation
Opportunities
  • LNG and Alternative-Fuel Bunkering Infrastructure
  • Digital Port-Community Platforms
  • Emerging-Market Greenfield Development

Port Infrastructure Market Summary

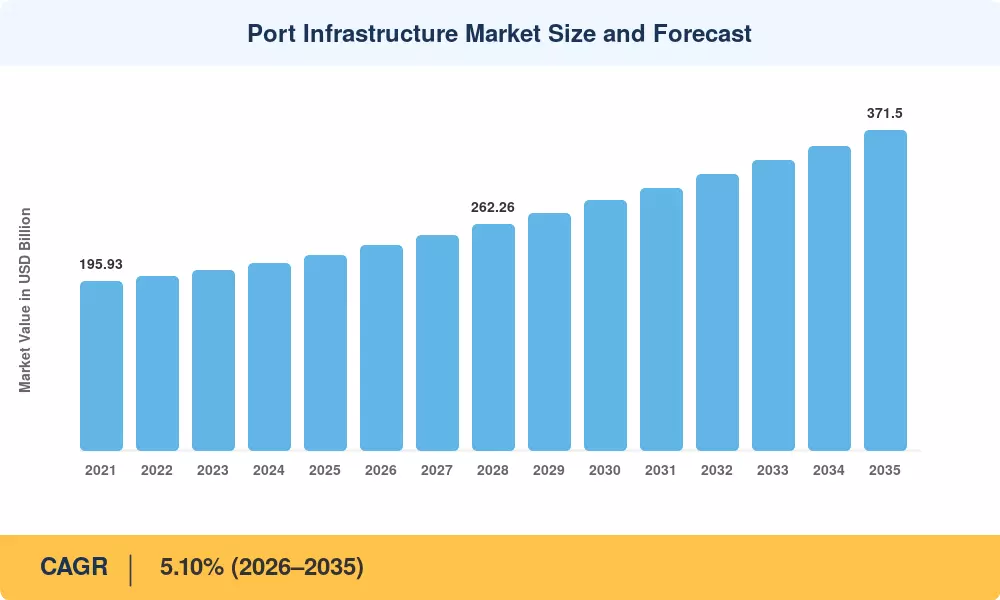
The port infrastructure market reached a valuation of USD 225.90 billion in 2025 and is projected to climb from USD 237.42 billion in 2026 to USD 371.50 billion by 2035, advancing at a 5.10% CAGR during the forecast window. This expansion is anchored by two converging forces: government-led modernization spending — the World Bank committed over USD 14 billion in maritime logistics lending between 2022 and 2025 [1] — and private-sector concession models that unlock capital for greenfield terminal construction. Near-shoring trade policies in North America and the EU are redirecting cargo flows toward secondary coastal and inland nodes, broadening the port infrastructure market beyond legacy gateway hubs.

Across terminal yards and berth facilities, legacy diesel-powered equipment is giving way to electrified stacking cranes, automated guided vehicles, and 5G-enabled operations management platforms. China alone earmarked RMB 480 billion (≈ USD 66 billion) in its 14th Five-Year Plan for waterway and coastal upgrades through 2025 [2]. These investments are compressing turnaround times, cutting emissions per twenty-foot equivalent unit (TEU) by up to 35%, and reshaping competitive positioning across the port infrastructure market.

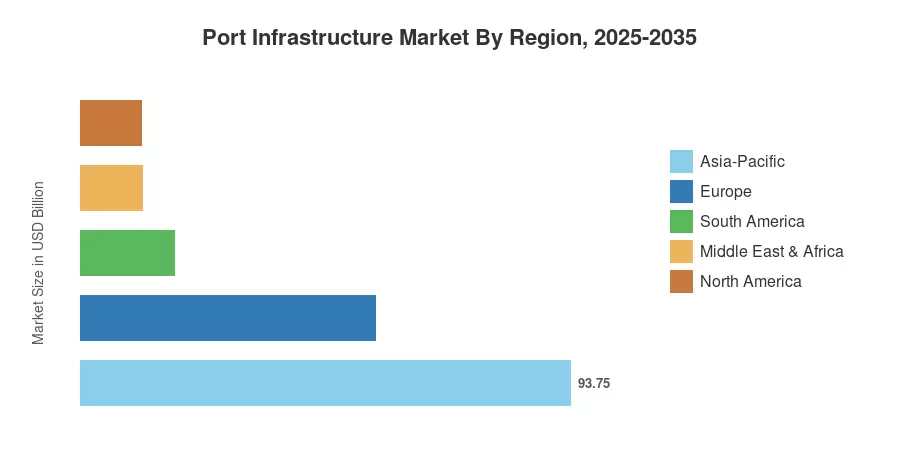
Asia-Pacific dominates the port infrastructure market with an estimated 41.5% share in 2025, driven by China's mega-port expansion and India's Sagarmala program. Europe holds the second-largest share at roughly 25.0%, buoyed by the EU's TEN-T corridor spending. Asia-Pacific also registers the fastest regional CAGR through 2035, as governments accelerate deep-water berth construction and LNG bunkering readiness to capture shifting global trade routes.


Key Report Takeaways

• By Port Type

  • Seaports accounted for approximately 80.6% of the port infrastructure market in 2025, reflecting the dominance of deep-water coastal terminals in global trade.
  • Inland ports are forecast to grow at a 5.20% CAGR through 2035, supported by multimodal connectivity investments linking river and rail corridors to coastal gateways.

• By Application

  • Cargo operations represented roughly 83.9% of the port infrastructure market in 2025, as containerized and dry-bulk volumes continued to expand.
  • The passenger segment is expected to post a 5.18% CAGR through 2035, driven by cruise terminal upgrades in the Mediterranean and Caribbean.

• By Ownership Model

  • Public entities held approximately 47.8% of the port infrastructure market in 2025.
  • Private operators are projected to expand at a 5.12% CAGR through 2035, as concession-based models gain traction in emerging economies.

• By Technology Adoption Level

  • Conventional terminals commanded about 60.5% of the port infrastructure market in 2025, though semi-automated and fully automated facilities are gaining share.
  • Fully automated terminals are scaling at a 5.10% CAGR through 2035.

• By Region

  • Asia-Pacific captured an estimated 41.5% of the port infrastructure market in 2025.
  • North America is expanding its port modernization pipeline through the IIJA's port-specific allocations.


Port Infrastructure Market Size and Forecast (2021–2035)

Market sizing draws on a triangulated approach: bottom-up capital-expenditure tracking across 450+ ports globally, validated against top-down trade-volume proxies (UNCTAD maritime throughput data) and corroborated by proprietary supply-side surveys with EPC contractors and terminal operators [3].
Port Infrastructure Market Size and Forecast
Our Impact
Enabled $4.3B Revenue Impact for Fortune 500 and Leading Multinationals
Partnering with 2000+ Global Organizations Each Year
30K+ Citations by Top-Tier Firms in the Industry

Driver Impact Analysis

Driver ~% Impact on CAGR Geographic Relevance Impact Timeline
Government port-modernization stimulus +1.2% Global Short-term (≤ 2 yr)
Trade-route realignment and near-shoring +0.9% North America, Europe Medium-term (2–4 yr)
Automation and digital-twin deployment +0.8% Asia-Pacific, Europe Medium-term (2–4 yr)
IMO decarbonization mandates +0.7% Global Long-term (≥ 4 yr)
Inland waterway and multimodal connectivity +0.5% Asia-Pacific, South America Long-term (≥ 4 yr)
Cruise and passenger terminal expansion +0.3% Europe, Middle East Medium-term (2–4 yr)
5G and IoT-enabled yard management +0.3% Asia-Pacific, North America Short-term (≤ 2 yr)


Government Port-Modernization Stimulus

Public spending remains the single largest accelerant for the port infrastructure market. The U.S. Infrastructure Investment and Jobs Act (IIJA) allocated USD 17 billion for port and waterway improvements through 2026 [1]. In parallel, India's Sagarmala initiative has mobilized over USD 12 billion in port-linked projects since 2015, with Phase III targeting 35 new berths by 2030 [10]. These programs shorten procurement timelines and de-risk private co-investment, amplifying multiplier effects across the value chain.

Trade-Route Realignment and Near-Shoring

Geopolitical fragmentation is redirecting container volumes away from single-hub dependency. Mexico's Pacific coast ports recorded a 22% throughput surge between 2022 and 2024 as U.S. importers diversified sourcing from China [7]. Similar dynamics are playing out in Vietnam and Morocco, where port authorities fast-tracked deep-water berth approvals to capture re-routed demand. The port infrastructure market stands to gain as secondary nodes require entirely new landside logistics stacks.

Automation and Digital-Twin Deployment

Terminal operators are deploying automated stacking cranes, optical-character-recognition gate systems, and digital-twin simulation platforms to lift throughput per hectare by 25–40% [8]. Rotterdam's Maasvlakte II and Shanghai's Yangshan Phase IV have demonstrated that fully automated yards cut labor costs by roughly 30% while raising berth productivity. These proof points are catalyzing capex commitments across mid-tier ports in Southeast Asia and the Arabian Gulf.

IMO Decarbonization Mandates

The revised GHG strategy of the International Maritime Organization aims to reduce the carbon intensity of shipping by 40% by 2030 in comparison to 2008 levels [11]. Ports are obligated to retrofit cold-ironing infrastructure, install shore-power connections, and provide alternative-fuel bunkering in order to comply with regulations. Before 2035, the port infrastructure market will absorb billions in electrification upgrades as more than 200 main ports worldwide pursue green-corridor certification.


Restraints Impact Analysis

Impact estimates below are directional and reflect qualitative headwinds; they do not subtract directly from the composite CAGR.

Restraint ~% Impact on CAGR Geographic Relevance Impact Timeline
High capital intensity and long payback cycles –0.6% Global Long-term (≥ 4 yr)
Regulatory and environmental permitting delays –0.5% Europe, North America Medium-term (2–4 yr)
Labor displacement and workforce transition risk –0.3% Global Medium-term (2–4 yr)
Geopolitical disruption to supply chains –0.4% Global Short-term (≤ 2 yr)
Climate and sea-level rise exposure –0.3% Asia-Pacific, Small Island States Long-term (≥ 4 yr)


High Capital Intensity and Long Payback Cycles

A single deep-water container berth can require USD 500 million–USD 1.2 billion in construction capital, with concession payback horizons stretching 20–30 years [17]. Sovereign credit ratings and currency volatility in emerging markets amplify financing costs, discouraging greenfield bids. This capital barrier constrains the pace at which the port infrastructure market can absorb latent trade-volume demand, particularly in Sub-Saharan Africa and South Asia.

Regulatory and Environmental Permitting Delays

In the European Union, environmental impact assessments for coastal construction typically require 3–5 years, while the U.S. Army Corps of Engineers navigation-channel deepening permits can take up to 7 years [18]. The port infrastructure market in developed economies experiences a slowdown in near-term development as a result of the lag between investment intent and project commencement, which is a result of these timelines.


Geopolitical Disruption

Red Sea shipping diversions in 2024 and ongoing tensions in the Taiwan Strait introduce route volatility that complicates long-range port capacity planning. Operators face the risk of building for demand corridors that shift before projects reach operational status, increasing stranded-asset exposure within the port infrastructure market.


Port Infrastructure Market Opportunities

LNG and Alternative-Fuel Bunkering Infrastructure

With the IMO's carbon-intensity regulations tightening through 2030, ports that install methanol, ammonia, and LNG bunkering facilities first will capture fuel-supply revenue streams worth an estimated USD 18 billion annually by 2032 [11]. Early movers in Singapore and Antwerp-Bruges are already attracting preferential route allocations from liner alliances.

Digital Port-Community Platforms

Port-community systems that integrate customs, terminal operating systems, and inland logistics on a single data layer can monetize per-transaction data fees. The World Bank estimates that digital trade-facilitation platforms reduce cargo dwell time by 20–30%, creating willingness-to-pay among freight forwarders and customs brokers [3]. This data-monetization model opens recurring-revenue opportunities adjacent to the port infrastructure market.

Emerging-Market Greenfield Development

Sub-Saharan Africa handles less than 4% of global container throughput despite a coastline exceeding 30,000 km [21]. Lamu Port in Kenya and Bagamoyo in Tanzania represent new-build opportunities where the port infrastructure market can expand geographically while diversifying away from mature-market saturation.

Climate-Resilient Quay and Breakwater Retrofits

Port authorities are being compelled to invest in higher-elevation quay walls, reinforced breakwaters, and adaptive runoff management as a result of the intensification of storm surges and the rising sea levels. By 2035, the OECD anticipates that the cumulative expenditure on climate-adaptation at coastal ports will surpass USD 50 billion [15]. This retrofit cycle is incremental to new-build capital and expands the addressable scope of the port infrastructure market.


Inland Port and Multimodal Hub Expansion

Governments in India, Brazil, and China are channeling investment into river-port networks that decongest coastal gateways and reduce last-mile trucking costs by 15–25% [13]. India's Jal Marg Vikas project on the Ganges alone targets USD 800 million in waterway-linked port assets through 2030. Inland nodes represent a high-growth frontier within the port infrastructure market.


Port Infrastructure Market Future Outlook

Autonomous and AI-Optimized Terminal Operations

By 2030, at least 60 major container terminals worldwide are expected to operate with full or near-full automation, up from roughly 20 in 2025 [12]. AI-driven yard-planning algorithms and machine-vision container-identification systems will compress vessel turnaround times by an additional 15–20%, intensifying competitive differentiation within the port infrastructure market.

Electrification and Shore-Power Supercycle

The EU Alternative Fuels Infrastructure Regulation (AFIR) mandates shore-side electricity at all TEN-T core ports by 2030 [9]. California's At-Berth regulation already requires vessels to cut auxiliary-engine emissions by 80%. These mandates are triggering a global shore-power installation wave valued at over USD 8 billion cumulatively through 2035, expanding the electrification layer of the port infrastructure market.

Platform Economics and Digital Trade Facilitation

Port-community platforms that bundle vessel scheduling, customs clearance, and inland-logistics orchestration into a single digital layer are transitioning from cost-center IT projects to revenue-generating platforms. Singapore's MPA and Rotterdam's Portbase demonstrate that data-sharing ecosystems can reduce document-processing time by 40–50%, creating subscription- and transaction-fee revenue models [3].

ESG Reporting and Green-Finance Mobilization

By 2024, the cumulative issuance of green bonds and sustainability-linked financing for port projects had exceeded USD 6 billion [17]. Port authorities that align infrastructure investments with climate-risk metrics will have access to lower-cost capital as ESG disclosure frameworks, such as the EU Taxonomy and ISSB standards, mature. Through 2035, this dynamic is anticipated to direct an increasing proportion of infrastructure-finance flows to the port infrastructure market.


Port Infrastructure Market Segmentation

By Port Type

Segment Key Metric Primary Demand Driver
Seaport 80.6% share (2025) Global containerized trade volumes
Inland Port 5.20% CAGR (2026–2035) Multimodal corridor investments
Other (Dry Ports, Free Zones) USD 10.38 Billion (2025) Trade-facilitation zone policy


Seaports remain the backbone of the port infrastructure market, handling the vast majority of international goods movement. Deep-water berth construction for Ultra-Large Container Vessels (ULCVs) exceeding 24,000 TEU is concentrating capex among top-tier coastal hubs. Inland ports, meanwhile, are the fastest-growing segment as governments in India, Brazil, and Central Europe prioritize river and rail connectivity to decongest coastal gateways and lower freight costs.

By Application

Segment Key Metric Primary Demand Driver
Cargo 83.9% share (2025) Containerized, bulk, and liquid-cargo throughput
Passenger 5.18% CAGR (2026–2035) Cruise terminal expansion and ferry modernization


Cargo dominates the port infrastructure market, with container, dry-bulk, and liquid-bulk operations requiring continuous capacity additions. The passenger segment, while smaller, is accelerating as cruise lines order larger vessels that demand purpose-built homeport terminals with integrated customs and baggage-handling systems.

By Ownership Model

Segment Key Metric Primary Demand Driver
Public 47.8% share (2025) Sovereign infrastructure mandates
Private 5.12% CAGR (2026–2035) Concession and PPP models in emerging markets


Public ownership still shapes much of the port infrastructure market, particularly in Europe and parts of Asia where national port authorities control land and waterside assets. Private concession operators are gaining ground, especially in Africa and Latin America, where governments lack the fiscal capacity for self-funded port development and turn to build-operate-transfer (BOT) arrangements.

By Technology Adoption Level

Segment Key Metric Primary Demand Driver
Conventional 60.5% share (2025) Legacy brownfield terminal operations
Semi-Automated USD 52.16 Billion (2025) Incremental automation upgrades
Fully Automated 5.10% CAGR (2026–2035) Greenfield mega-terminal builds


Conventional terminals still constitute the majority of the port infrastructure market by installed base, though new-build projects overwhelmingly specify at least semi-automated equipment. Fully automated facilities — exemplified by Qingdao's QQCTN and Rotterdam's APMT Maasvlakte II — deliver 30–40% higher throughput per hectare, making them the preferred design template for any greenfield terminal breaking ground after 2026.


Regional Market Share Analysis

Region Key Metric Primary Investment Themes
Asia-Pacific 41.5% share (2025) Mega-port expansion, LNG bunkering, automation
Europe USD 56.48 Billion (2025) Green-corridor compliance, TEN-T upgrades
North America 5.15% CAGR (2026–2035) IIJA-funded modernization, near-shoring capacity
South America USD 18.07 Billion (2025) Commodity-export terminal expansion
Middle East & Africa 5.25% CAGR (2026–2035) Transshipment hub positioning, greenfield builds
Total USD 225.90 Billion (2025)

The port infrastructure market is shaped by divergent regional investment cycles. Asia-Pacific leads both in absolute spending and growth velocity, while Europe maintains the highest per-berth technology intensity. North America is undergoing a catch-up modernization cycle, and emerging regions are leveraging concessionary financing to build foundational capacity.


North America

Country Key Metric Key Driver
US 72.3% of regional share IIJA port allocations and dredging programs [1]
Canada 5.22% CAGR Pacific gateway expansion (Prince Rupert) [22]
Mexico USD 3.18 Billion (2025) Near-shoring manufacturing corridors [7]


The port infrastructure market in North America is undergoing its most significant modernization cycle in decades. The IIJA's USD 17 billion port allocation is funding channel-deepening projects along the Gulf Coast and East Coast to accommodate Neo-Panamax vessels, while Mexico's Pacific ports are scaling to absorb near-shored supply chains from Asia.

Europe

Country Key Metric Key Driver
Germany 22.4% of regional share Hamburg and Bremerhaven automation upgrades [9]
UK USD 6.12 Billion (2025) Freeport program post-Brexit [23]
France 5.05% CAGR Le Havre – Marseille corridor investment [9]
Italy 14.8% of regional share Genoa and Trieste transshipment positioning
Spain USD 4.89 Billion (2025) Mediterranean gateway volumes
Nordic Countries 5.18% CAGR Arctic shipping-route preparedness
Russia 7.2% of regional share Northern Sea Route terminal construction
Rest of Europe USD 5.62 Billion (2025) EU Cohesion Fund port upgrades


European port spending is driven by the EU's Connecting Europe Facility, which earmarked EUR 25.8 billion for TEN-T transport corridors through 2027 [9]. Germany and the Netherlands lead automation adoption, while Mediterranean hubs in Italy and Spain are investing in transshipment capacity to capture Asia–Europe relay volumes. The port infrastructure market across Europe benefits from stringent shore-power mandates that require electrification retrofits at all core-network ports by 2030.

Asia-Pacific

Country Key Metric Key Driver
China 38.5% of regional share 14th Five-Year Plan waterway capex [2]
India 5.35% CAGR Sagarmala program Phase III [10]
Japan USD 7.84 Billion (2025) Seismic-resilient port reconstruction
South Korea 11.2% of regional share Busan New Port Phase expansion
ASEAN 5.40% CAGR Vietnam and Indonesia deep-water builds
Rest of Asia-Pacific USD 5.12 Billion (2025) Pacific island climate adaptation


Asia-Pacific's dominance in the port infrastructure market reflects China's unmatched construction scale — seven of the world's ten busiest container ports by TEU are Chinese — combined with India's ambitious coastal development agenda. ASEAN nations are the fastest-growing sub-region, as Vietnam's Lach Huyen and Indonesia's Patimban terminals race to absorb manufacturing diversification from China.

South America

Country Key Metric Key Driver
Brazil 58.3% of regional share Santos port expansion and soy export corridors [24]
Argentina 4.95% CAGR Grain-terminal upgrades on the Paraná River
Rest of South America USD 3.42 Billion (2025) Chile and Peru copper-export terminals


Commodity exports shape the port infrastructure market in South America. Brazil's Santos expansion project is adding four new berths to handle record soy and iron-ore volumes, while Chile and Peru are upgrading copper-concentrate loading facilities to serve Asian smelter demand [24].

Middle East & Africa

Country Key Metric Key Driver
Saudi Arabia 28.6% of regional share NEOM and Red Sea gateway projects [25]
UAE USD 4.25 Billion (2025) Jebel Ali and Khalifa Port expansion
South Africa 5.08% CAGR Durban and Ngqura transshipment upgrades
Egypt 16.4% of regional share Suez Canal Economic Zone terminals
Rest of MEA 5.30% CAGR Kenya Lamu Port and West Africa greenfields [21]


Middle East & Africa represents the highest-growth frontier for the port infrastructure market, as Gulf states leverage sovereign wealth to build transshipment mega-hubs while East African nations develop first-generation deep-water facilities. Saudi Arabia's Vision 2030 logistics agenda alone targets USD 12 billion in port-related investment through the decade [25].


Port Infrastructure Market By Region, 2025-2035

Competitive Benchmarking

The port infrastructure market exhibits moderate concentration. The top five players collectively hold an estimated 22–28% revenue share, reflecting a landscape that blends global EPC contractors with state-backed construction conglomerates and international terminal operators. The Herfindahl-Hirschman Index (HHI) sits in the low-to-moderate range, indicating meaningful competition without monopolistic dominance.

Company Est. Revenue Share Range Key Offerings for Port Infrastructure Market Strategic Positioning
China Communications Construction Co. (CCCC) ~6–9% Dredging, quay construction, terminal design-build Dominant in Asia-Pacific and Belt & Road-linked projects
DP World ~4–6% Terminal operation, greenfield development, logistics parks Global concession portfolio spanning 40+ countries
APM Terminals (A.P. Moller-Maersk) ~3–5% Container terminal operation, automation systems Vertical integration with parent liner operations
Hutchison Port Holdings ~3–5% Container terminal operation, port management Pan-Asian and European gateway presence
PSA International ~3–5% Terminal operation, digital port solutions Singapore hub dominance and global JV network
Bechtel Corporation ~2–4% EPC for mega-port and marine civil works Large-scale greenfield construction in emerging markets
AECOM ~2–3% Port planning, environmental engineering, design Advisory and design services across all regions
China Harbour Engineering Co. (CHEC) ~2–4% Marine civil engineering, breakwater construction Sub-Saharan Africa and South Asian project pipeline
Fluor Corporation ~1–3% EPC, project management for port facilities North American and Middle Eastern project focus
Royal HaskoningDHV ~1–2% Port master planning, coastal engineering consultancy European and African advisory mandates


Recent News & Developments

  • DP World (October 2024): Announced a USD 1.2 billion expansion of Jebel Ali Terminal 4, adding 3.1 million TEU of annual capacity and shore-power connectivity for all new berths [25].


  • International Maritime Organization (July 2023): Adopted the revised GHG Strategy targeting net-zero emissions from international shipping by around 2050, catalyzing shore-power and alternative-fuel infrastructure investment globally [11].


  • Saudi Ports Authority (Mawani) (November 2023): Awarded a 30-year concession for the new Red Sea Gateway Terminal at Jeddah, valued at USD 1.5 billion, to a consortium led by DP World [25].


Port Infrastructure Market Report Scope

Parameter Detail
Market Scope Global port infrastructure market covering seaports, inland ports, and dry ports
Study Period 2021–2035
CAGR 5.10% (2026–2035)
Base Year 2025 — USD 225.90 Billion
Forecast Start 2026 — USD 237.42 Billion
Forecast End 2035 — USD 371.50 Billion
Fastest Growing Segment Inland ports (by port type); Fully automated terminals (by technology level)
Companies Profiled 10 (CCCC, DP World, APM Terminals, Hutchison Ports, PSA International, Bechtel, AECOM, CHEC, Fluor, Royal HaskoningDHV)
Valuation Currency USD Billion


FAQs

How does the port infrastructure market differ from the broader logistics-infrastructure sector?
It focuses specifically on fixed assets at ports — quay walls, berths, breakwaters, dredging, and terminal yards — rather than warehousing or overland transport. Logistics infrastructure encompasses inland distribution networks that fall outside port boundaries [3].
What concession tenure is typical for private port investments?
Most concessions run 25–35 years, with terminal operators recouping capital through volume-linked tariff structures. Shorter tenures below 20 years often deter bidders due to insufficient payback windows [17].
How does shore-power regulation affect terminal operating costs?
Shore-power installation adds USD 2–5 million per berth, but it reduces vessel auxiliary-engine fuel consumption during port calls by up to 90%. Regulatory mandates in the EU and California make this expenditure non-discretionary [11].
Which emerging technology poses the greatest disruption to the port infrastructure market?
Digital-twin simulation platforms are reshaping capital planning by letting operators model throughput, climate, and equipment scenarios before committing construction budgets. Early adopters report 12–18% reductions in design-phase cost overruns [8].
What financing mechanisms are most used for greenfield port projects in Africa?
Sovereign-backed development finance from the AfDB and concessional lending from DFIs typically anchor funding, supplemented by private-equity co-investment through build-operate-transfer structures [21].
How do climate-adaptation requirements alter project timelines for the port infrastructure market?
Sea-level-rise modeling and storm-surge resilience studies can add 12–18 months to the pre-construction phase. Ports in vulnerable zones must now design for 0.5–1.0 meter elevation buffers above current tide benchmarks [15].
What role do free-trade zones play in directing capital toward the port infrastructure market?
Free-trade zones attract ancillary warehousing and light-manufacturing investment that justifies higher-capacity berth construction. The UAE's Jebel Ali Free Zone alone generates over 30% of Dubai's GDP, anchoring sustained port-expansion spending [25].    
Author
Author
Author Profile
Snehal Singh LinkedIn
Manager - Research
High acumen in analyzing complex macro & micro markets with more than 6 years of work experience in the field of market research. By implementing her analytical skills in forecasting and estimation into market research reports, she has expertise in Packaging, Construction, and Equipment domains. She handles a team size of 20-25 resources and ensures smooth running of the projects, associated marketing activities, and client servicing.
Download Free Sample

Kindly complete the form below to receive a free sample of this Report

Download PDF ×

We do not share your information with anyone. However, we may send you emails based on your report interest from time to time. You may contact us at any time to opt-out.
















