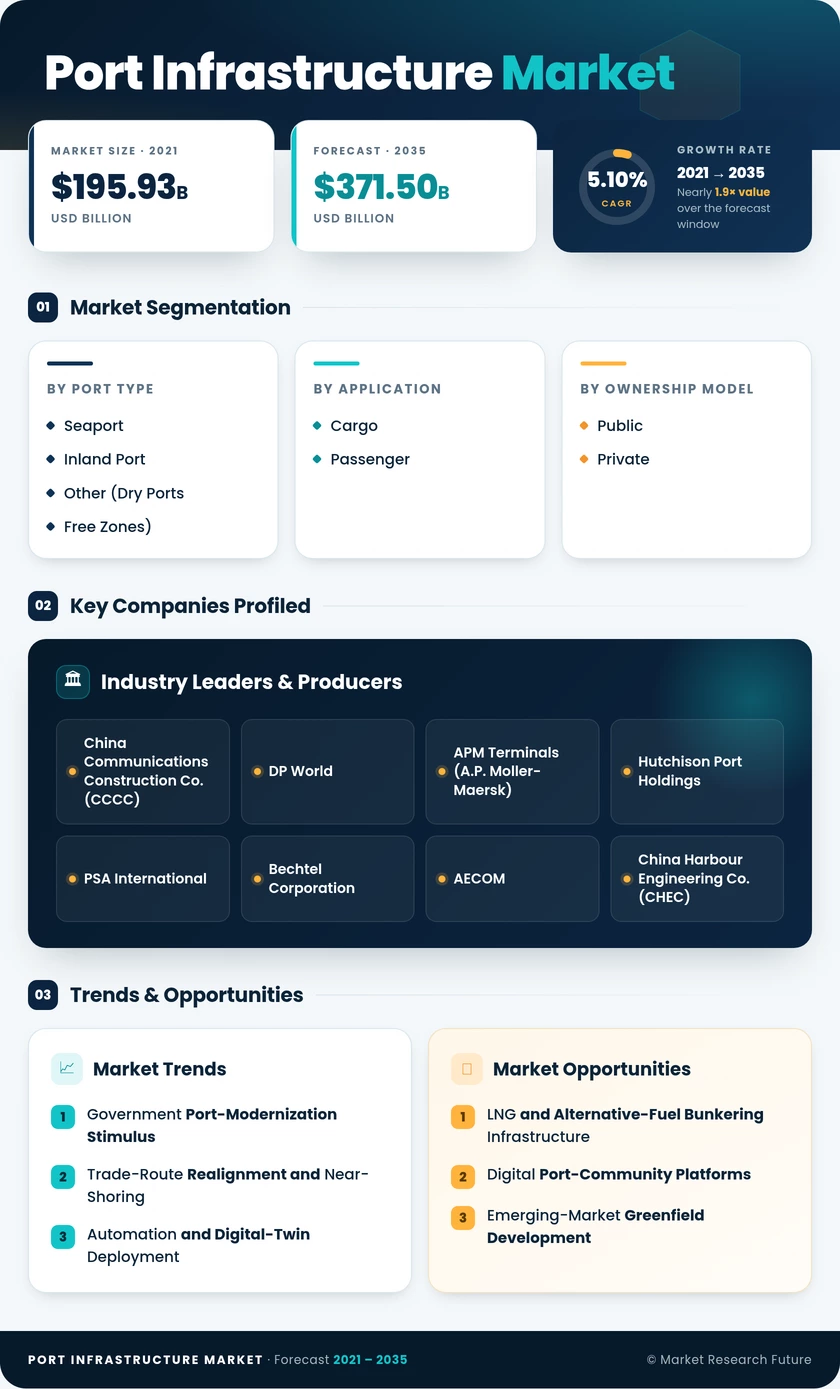
Segmentation Quick Reference
| Dimension | Sub-Segments | Dominant Segment | Fastest Growing Segment |
| By Port Type | Seaport, Inland Port, Other (Dry Ports, Free Zones) | Seaport | Inland Port |
| By Application | Cargo, Passenger | Cargo | Passenger |
| By Ownership Model | Public, Private | Public | Private |
| By Technology Adoption Level | Conventional, Semi-Automated, Fully Automated | Conventional | Fully Automated |
Market Segmentation Overview
By Port Type
| Sub-Segment | Key Trend |
| Seaport | ULCV-capable berth construction and deep-water channel dredging dominate capex |
| Inland Port | River-port connectivity and dry-port multimodal hubs expanding in India, Brazil, and Central Europe |
| Other (Dry Ports, Free Zones) | Free-trade zone-linked logistics parks driving ancillary infrastructure investment |
Seaports continue to anchor global trade flows, with the largest terminals investing in automated quay cranes and shore-power systems. Inland ports are emerging as critical pressure-relief valves for congested coastal gateways, attracting targeted public investment.
By Application
| Sub-Segment | Key Trend |
| Cargo | Container, dry-bulk, and liquid-bulk terminal capacity additions accelerating globally |
| Passenger | Cruise homeport terminals and ferry-terminal modernization programs expanding in Europe and the Caribbean |
Cargo operations drive the majority of capital allocation, with container throughput growth of 3–4% annually sustaining expansion cycles. Passenger infrastructure, while a smaller share, is growing as cruise lines commission larger vessels requiring purpose-built terminals.
By Ownership Model
| Sub-Segment | Key Trend |
| Public | National port authorities retaining land ownership while outsourcing operations |
| Private | BOT and concession-based models accelerating in Africa, Latin America, and South Asia |
Public ownership remains prevalent in Europe and East Asia, where governments treat ports as strategic national assets. Private participation is rising fastest in regions where fiscal constraints limit direct public investment in greenfield projects.
By Technology Adoption Level
| Sub-Segment | Key Trend |
| Conventional | Legacy terminals undergoing incremental digitization and equipment retrofits |
| Semi-Automated | Hybrid automation with remote-controlled cranes and automated gate systems |
| Fully Automated | Greenfield terminals specifying end-to-end automation from design phase onward |
Conventional terminals still represent the majority of the installed base but face competitive pressure from semi-automated and fully automated facilities that deliver measurably higher throughput per hectare and lower per-TEU operating costs.