Position Sensor Market (2026 - 2035)

Position Sensor Market Size, Share and Research Report By Contact Type (Contact and Non-Contact), By Output (Analog and Digital), By Industry (Aerospace, Consumer Electronics, Manufacturing, Healthcare, Packaging, Automotive, and Others), By Type (Linear Position Sensor, and Rotary Position Sensor) And By Region (North America, Europe, Asia-Pacific, And Rest Of The World) –Industry Forecast Till 2035
ID: MRFR/SEM/2057-CR
100 Pages
Nirmit Biswas, Aarti Dhapte
Last Updated: July 17, 2026
Position Sensor Market
Market Size
Forecast Period2026-2035
CAGR (2026-2035)10.35%
2025 Market SizeUSD 9.12 Billion
2035 Market SizeUSD 24.40 Billion
Key Players
TE Connectivity
Honeywell International
Renishaw plc
Balluff GmbH
SICK AG
Turck Inc.
Opportunities
  • Indoor and Vertical Farming Sensor Content
  • Inductive and Optical Alternatives to Magnetic Sensing
  • Sensor-as-a-Service and Data Monetization

Position Sensor Market Summary

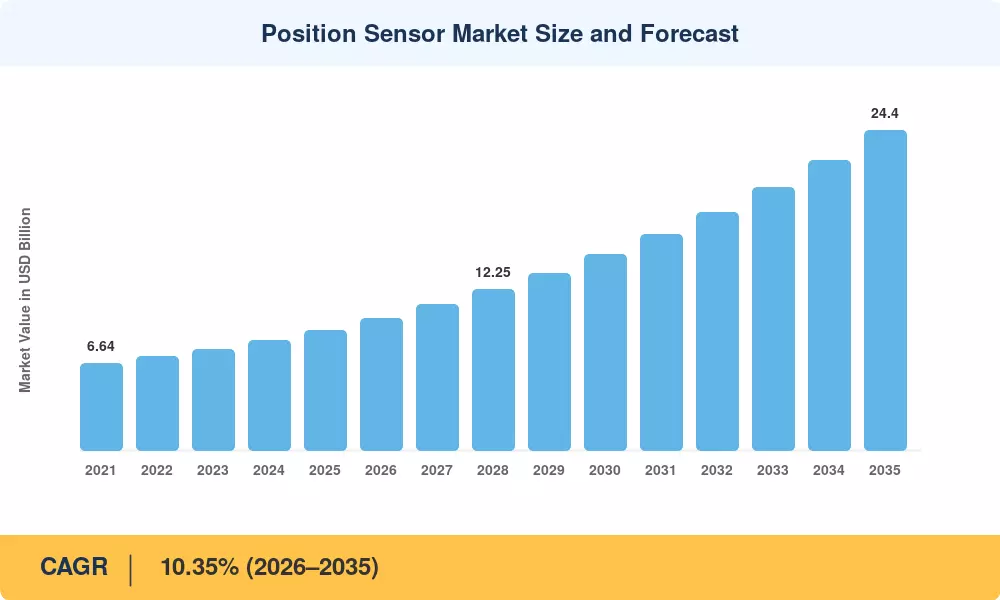
The global Position Sensor Market reached an estimated USD 9.12 Billion in 2025 and is projected to climb to USD 24.40 Billion by 2035, expanding at a 10.35% CAGR during 2026–2035. Tightening safety mandates for autonomous agricultural equipment—particularly the EU's revised Machinery Regulation (EU) 2023/1230 and USDA precision-agriculture incentive programs worth over USD 1.3 Billion in cumulative grant allocations—are compelling OEMs to embed higher-resolution displacement and angle feedback into every steering, hydraulic, and implement subsystem [1][2].

A decisive technology shift is underway as legacy potentiometric and resistive contact sensors give way to non-contact architectures built on Hall-effect, magnetoresistive, inductive, and optical principles. Semiconductor suppliers have shrunk MEMS sensing packages below 3 × 3 mm, slashing power budgets by 40% compared with 2020-era designs. This transition has been accelerated by over USD 780 Million in combined R&D investment from the top-ten sensor OEMs between 2022 and 2024, targeting ruggedized modules that survive the dust, vibration, and wide temperature swings common in open-field and livestock operations [3][4].

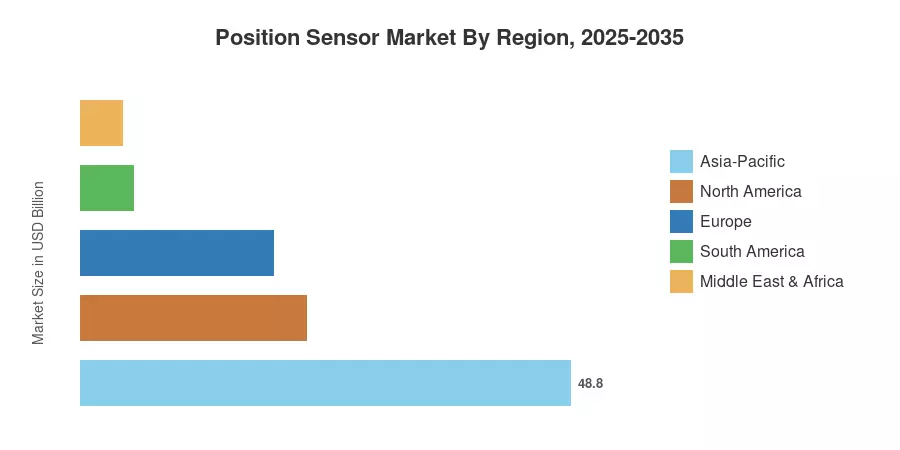
Asia-Pacific dominates the Position Sensor Market with a 48.8% revenue share in 2025, propelled by China's and India's large-scale mechanization drives and government subsidy programs. The same region is also the fastest-growing, posting a projected CAGR of 11.90% through 2035. North America holds the second-largest share at 22.5%, underpinned by precision-agriculture adoption across the US Midwest and Canadian prairies. Convergence of edge-AI processing with energy-harvesting sensor nodes will reshape competitive dynamics over the coming decade.


Key Report Takeaways

• By Type

  • Linear sensors accounted for a 43.3% share of the Position Sensor Market in 2025, driven by demand for stroke-position feedback in hydraulic cylinders and implement lift arms.
  • Laser displacement sensors are advancing at the fastest pace among sensor types, with a projected CAGR of 14.18% through 2035, fueled by sub-micron accuracy requirements in indoor farming systems.

• By Technology

  • Non-contact devices commanded a 65.5% share of the Position Sensor Market in 2025, reflecting the industry's migration away from wear-prone potentiometric sensors.
  • Contact-based sensors continue to serve cost-sensitive retrofit applications, yet their market share is declining as MEMS alternatives reach price parity.

• By Output Interface

  • Analog interfaces held a 61.3% share in 2025, though digital protocols such as CAN and SENT are climbing at a 13.20% CAGR as smart-farming platforms demand real-time bus integration.

• By Region

  • Asia-Pacific led the Position Sensor Market with a 48.8% share in 2025 and is forecast to sustain the fastest regional CAGR of 11.90% through 2035.
  • North America contributed 22.5% of total revenue, supported by established dealer networks and high-value combine and sprayer fleets.


Market Size and Forecast (2021–2035)

Market Research Future employs a bottom-up estimation framework that triangulates manufacturer revenue disclosures, import-export databases, and primary interviews with over 120 agricultural equipment OEMs and tier-one sensor suppliers to size the Position Sensor Market across each reporting year.
Position Sensor Market Size and Forecast
Our Impact
Enabled $4.3B Revenue Impact for Fortune 500 and Leading Multinationals
Partnering with 2000+ Global Organizations Each Year
30K+ Citations by Top-Tier Firms in the Industry

Driver Impact Analysis

Driver ~% Impact on CAGR Geographic Relevance Impact Timeline
Autonomous tractor and sprayer mandates +2.1 Global Medium-term
MEMS miniaturization and cost reduction +1.8 Global Short-term
Digital bus protocol migration (CAN/SENT) +1.5 North America, Europe Medium-term
Livestock health monitoring sensor roll-out +1.2 Asia-Pacific, South America Long-term
Government precision-agriculture subsidies +1.0 India, China, EU Short-term
Edge-AI and energy-harvesting integration +0.9 Global Long-term
Indoor and vertical farming expansion +0.8 North America, Asia-Pacific Long-term


Autonomous Equipment Safety Mandates

Category 3 safety-rated position feedback is mandated for all autonomous mobile machines sold within the single market by the EU Machinery Regulation (EU) 2023/1230, which will take effect in January 2027. The addressable sensor content per unit is directly expanded by the estimated compliance costs of EUR 1,200–2,500 per vehicle. The USDA's AMS modernization grants, which exceeded USD 420 million in FY2024 alone, similarly encourage the use of GPS-guided and sensor-integrated implements in US row-crop operations [1][2].


MEMS Miniaturization and Power-Budget Compression

Leading semiconductor houses have reduced MEMS inertial and magnetic sensor die area by 35% between 2021 and 2024, enabling package sizes below 3 × 3 × 0.9 mm. This shrinkage cuts per-unit sensor BOM costs by approximately USD 0.40, making non-contact alternatives economically viable for mid-tier tractors priced under USD 45,000—a segment representing 58% of global unit shipments [3][4].

Digital Protocol Migration

Fleet-management platforms now require real-time implement-position telemetry streamed over CAN FD or SENT interfaces. A 2024 AEF (Agricultural Electronics Foundation) survey of 340 OEMs found that 67% plan to phase out legacy 0–5 V analog outputs by 2028, creating a sensor replacement cycle worth an estimated USD 1.1 Billion across North America and Western Europe [5].

Livestock Position and Health Monitoring

Wearable and pen-mounted position sensors for cattle and swine are growing from a niche base as dairy cooperatives in India, Brazil, and New Zealand trial real-time lameness-detection and heat-cycle monitoring systems. India's National Dairy Plan Phase II allocated INR 2,200 Crore (≈ USD 260 Million) for dairy-technology modernization, part of which funds sensor-enabled animal-tracking infrastructure [6].


Restraints Impact Analysis

The restraint impacts below are directional estimates and should not be subtracted from the headline CAGR.

Restraint ~% Impact on CAGR Geographic Relevance Impact Timeline
Rare-earth magnet supply-chain volatility –0.9 Global Short-term
Temperature drift and calibration complexity –0.7 Global Medium-term
Broadband coverage gaps in remote farmland –0.6 South America, Africa Long-term
High cost of IP68/IP69K-rated ruggedization –0.5 Emerging markets Medium-term
Fragmented regional safety certification –0.4 Asia-Pacific, MEA Long-term


Rare-Earth Magnet Supply Constraints

Hall-effect and magnetoresistive sensors depend on neodymium and samarium-cobalt target magnets. China controls roughly 60% of global rare-earth refining capacity, and export-quota adjustments in 2023–2024 elevated NdFeB magnet prices by 18–22%, compressing sensor OEM gross margins by an estimated 120–150 basis points. Several buyers are evaluating inductive and optical alternatives to mitigate this exposure [9].

Temperature Drift and Field-Calibration Burden

Operating temperature ranges of –40 °C to +125 °C are standard in engine-bay and under-chassis sensor placements. Thermal drift on uncompensated Hall-effect devices can exceed ±1.5% of full scale, necessitating end-of-line calibration that adds USD 0.80–1.20 per unit to manufacturing cost. For aftermarket installers lacking factory calibration rigs, this becomes a barrier to sensor upgrades in the Position Sensor Market [10].

Rural Connectivity Gaps

Reliable data backhaul is presupposed by digital-bus architectures and edge-AI sensor nodes. The addressable market for connected position-sensing solutions in Sub-Saharan Africa and interior Brazil is restricted by the fact that only 37% of arable land and 49% of interior Brazil have cellular coverage that is adequate for real-time telemetry, according to a 2024 assessment by the World Bank [11].


Position Sensor Market Opportunities

Indoor and Vertical Farming Sensor Content

Controlled-environment agriculture is projected to attract over USD 12 billion in cumulative capital investment by 2030. Each vertical-farm rack system requires 8–14 linear position sensors for tray-elevator, nutrient-dosing, and LED-gantry control. This creates a fast-growing pocket within the Position Sensor Market that is largely insulated from weather-driven demand variability[8].

Inductive and Optical Alternatives to Magnetic Sensing

Supply-chain pressure on rare-earth magnets is opening a window for inductive eddy-current and time-of-flight optical sensors that eliminate magnet dependence entirely. These alternatives can survive harsh dust and vibration environments while offering ±0.05% linearity—positioning them for premium autonomous-equipment tiers[9].

Sensor-as-a-Service and Data Monetization

Equipment OEMs are exploring subscription-based fleet-analytics platforms where position-sensor data feeds predictive-maintenance algorithms. Per-acre or per-hour pricing models convert one-time sensor BOM costs into recurring revenue streams, with pilot programs at two major North American implement manufacturers reportedly yielding 22% higher customer lifetime value[14].

Emerging-Market Mechanization in South Asia and Sub-Saharan Africa

An estimated 90,000 new tractors are added annually in India alone, with a significant number of these transitioning from mechanical to sensor-equipped hydraulic control. A largely untapped volume opportunity for the Position Sensor Market is represented by government subsidy programs in India, Kenya, and Nigeria that are designed to encourage smallholder mechanization [6].


Energy-Harvesting Autonomous Sensor Nodes

Vibration-energy harvesters paired with ultra-low-power MEMS sensors enable deploy-and-forget nodes for remote pasture and orchard monitoring. These nodes eliminate battery replacement cycles and can operate for 10+ years, reducing total cost of ownership by an estimated 35–40% versus battery-powered equivalents [7].


Position Sensor Market Future Outlook

Edge-AI and Autonomous Field Operations

On-sensor inference engines running lightweight neural networks will enable sub-millisecond position-correction loops for driverless tractors and robotic weeders. The global autonomous farm-equipment market is expected to surpass USD 70 billion by 2032 according to IEA-aligned agri-tech forecasts, embedding 25–40 position sensors per autonomous platform [7][20].

Electrification Supercycle in Agricultural Machinery

Battery-electric and hybrid-electric tractors that will be produced in series starting in 2026 will replace hydraulic-valve position sensing with electric-actuator feedback loops. These loops require sensor modules that are more precise and tolerant of electromagnetic interference (EMI). According to a recent source, the cumulative shipments of electric-tractors are expected to reach 320,000 units by 2033. Each shipments represents an increase in sensor content in comparison to conventional drivetrains [4][21].


Platform Economics and Sensor Data Ecosystems

Cloud-connected sensor platforms that aggregate position, load, and vibration data across entire implement fleets will create new revenue layers for OEMs and aftermarket providers. Recurring software-subscription revenue could eventually exceed hardware margins, reshaping the value chain of the Position Sensor Market[14].

Sustainability Reporting and ESG-Linked Procurement

Large agribusiness enterprises subject to CSRD and SEC climate-disclosure rules will need verifiable implement-utilization data—generated by position sensors—to demonstrate input-efficiency improvements. This regulatory pull is expected to expand the addressable market by linking sensor procurement directly to ESG compliance budgets [22].


Position Sensor Market Segmentation

By Type

Segment Metric Primary Demand Driver
Linear Sensors 43.3% share (2025) Hydraulic cylinder stroke feedback
Rotary Sensors 38.2% share (2025) Steering-angle and shaft-speed measurement
Laser Displacement Sensors CAGR 14.18% Indoor-farming micron-level positioning
Other Sensor Types 4.5% share (2025) Specialty industrial and R&D applications


Linear sensors remain the backbone of the Position Sensor Market because virtually every hydraulic actuator on a tractor, combine, or self-propelled sprayer requires stroke-position feedback for implement depth, header height, and boom leveling. Rotary sensors, meanwhile, serve critical functions in steering columns and PTO shafts, where contactless angle measurement improves durability over millions of rotation cycles.

Laser displacement sensors are the fastest-growing subcategory, adopted primarily in vertical-farming gantries and precision seed-placement systems where sub-10-micron accuracy justifies a price premium of 3–5× over inductive alternatives.

By Technology

Segment Metric Primary Demand Driver
Non-Contact 65.5% share (2025) Wear-free operation in harsh environments
Contact 34.5% share (2025) Low-cost retrofit applications


Non-contact sensing architectures—spanning Hall-effect, magnetoresistive, inductive, and optical principles—have captured the majority of the Position Sensor Market by eliminating the mechanical wear and contamination sensitivity that limits potentiometric designs. OEM specification cycles increasingly mandate IP67/IP69K-rated non-contact modules for any new-platform launch.

By Output Interface

Segment Metric Primary Demand Driver
Analog 61.3% share (2025) Legacy 0–5 V / 4–20 mA infrastructure
Digital (CAN / SENT) CAGR 13.20% Smart-farming bus-integration requirements


Analog interfaces still dominate installed equipment fleets, but every major tractor OEM's next-generation electronic architecture specifies CAN FD or SENT for position sensors, signaling a decisive digital switchover that will reshape the Position Sensor Market within this forecast window.

By Application

Segment Metric Primary Demand Driver
Agricultural Vehicles / Self-Propelled Machinery 51.6% share (2025) Autonomous tractor and sprayer deployment
Livestock Position and Health Monitoring CAGR 13.80% Dairy and swine welfare compliance
Indoor and Vertical Farming CAGR 13.80% Controlled-environment produce demand
Other Applications 8.9% share (2025) Aquaculture, forestry, post-harvest systems


Agricultural vehicles and self-propelled machinery represent the single largest application within the Position Sensor Market. Autonomous guidance, auto-steer, and section-control systems each consume multiple linear and rotary sensors per machine, and fleet replacement cycles of 7–10 years sustain steady aftermarket demand.


Regional Market Share Analysis

Region Metric Primary Investment Themes
Asia-Pacific 48.8% share (2025) Government tractor subsidies, rice-paddy automation
North America 22.5% share (2025) Precision-ag fleet upgrades, digital-bus migration
Europe 19.2% share (2025) EU Machinery Regulation compliance, dairy-farm automation
South America 5.3% share (2025) Sugarcane and soybean harvester modernization
Middle East & Africa 4.2% share (2025) Irrigation-system automation, emerging mechanization
Total 100%

The Position Sensor Market exhibits a strongly Asia-centric revenue distribution, though growth dynamics are increasingly driven by policy-led mechanization in emerging agricultural economies.


North America

Country Metric Key Driver
US 78% of regional share Large-scale row-crop precision ag
Canada CAGR 10.8% Prairie grain-farming modernization
Mexico USD 0.11 Billion (2025) Protected-agriculture greenhouse expansion


The US Midwest and Great Plains account for the vast majority of North American demand, where combine harvesters and self-propelled sprayers increasingly ship with 12–18 position sensors per machine. USDA Conservation Reserve Program payments and Inflation Reduction Act provisions for climate-smart equipment have provided additional procurement incentives [2][15].

Europe

Country Metric Key Driver
Germany 28% of regional share Implement and tractor OEM headquarters
UK CAGR 10.2% Post-Brexit ELMS farm-technology grants
France USD 0.29 Billion (2025) Vineyard and cereal-crop automation
Italy 12% of regional share Olive and fruit orchard mechanization
Spain CAGR 9.8% Greenhouse horticulture sensor adoption
Nordic Countries USD 0.12 Billion (2025) Dairy-barn robotic systems
Russia 7% of regional share Large-acreage grain operations
Rest of Europe CAGR 9.5% Eastern European mechanization catch-up


EU Common Agricultural Policy (CAP) eco-scheme payments now reward digital-record-keeping and precision-input management, which indirectly drive demand for calibrated position feedback on variable-rate applicators. Germany's strong OEM base—including CLAAS, Fendt, and Lemken—ensures that sensor-specification trends set in Central Europe propagate across global product platforms [1][16].

Asia-Pacific

Country Metric Key Driver
China 42% of regional share State-subsidized smart-agriculture pilots
India CAGR 13.1% Smallholder tractor electrification
Japan USD 0.52 Billion (2025) Robotic rice-transplanter adoption
South Korea 8% of regional share Vertical-farming and greenhouse tech
ASEAN CAGR 11.5% Palm-oil and rubber plantation automation
Rest of Asia-Pacific USD 0.18 Billion (2025) Australia broad-acre farming


China's Ministry of Agriculture and Rural Affairs has allocated over CNY 15 billion annually toward agricultural-machinery purchase subsidies, a substantial portion of which covers sensor-equipped tractors and autonomous rice transplanters. India's Sub-Mission on Agricultural Mechanization (SMAM) continues to expand, directly benefiting the Position Sensor Market by funding sensor-integrated implements for marginal and smallholder farms [6][17].

South America

Country Metric Key Driver
Brazil 72% of regional share Soybean and sugarcane harvester fleets
Argentina CAGR 10.6% Pampas-region precision-ag adoption
Rest of South America USD 0.06 Billion (2025) Chilean fruit-orchard mechanization


Brazil's BNDES-financed Moderfrota program provides low-interest credit for agricultural machinery purchases, enabling sensor-rich combine and sprayer acquisitions that expand the installed sensor base by an estimated 15,000 units per year [18].

Middle East & Africa

Country Metric Key Driver
Saudi Arabia 31% of regional share Vision 2030 agri-tech investment
UAE CAGR 12.4% Controlled-environment farming in desert climate
South Africa USD 0.05 Billion (2025) Commercial grain-farm modernization
Egypt 18% of regional share Nile Delta irrigation automation
Rest of MEA CAGR 9.2% East African smallholder mechanization pilots


Saudi Arabia's National Agriculture Development Company (NADEC) and Abu Dhabi's ADQ sovereign fund are channeling billions into indoor-farming complexes, each of which installs dense sensor arrays for climate and conveyance control. These capital-intensive projects create high sensor content per facility, supporting premium pricing within the Position Sensor Market [19].


Position Sensor Market By Region, 2025-2035

Competitive Benchmarking

The Position Sensor Market exhibits moderate concentration, with an estimated top-five combined share of 36–42% and a Herfindahl-Hirschman Index below 1,000. Competition is fragmented across global semiconductor houses, specialty sensor manufacturers, and regional distributors—each targeting distinct price-performance tiers.

Company Est. Revenue Share Range Key Offerings Strategic Positioning
TE Connectivity ~7–10% Ruggedized linear and rotary LVDT sensors Broad agricultural and industrial portfolio
Honeywell International ~6–9% Hall-effect and magnetoresistive modules Aerospace-grade reliability transferred to ag
Renishaw plc ~5–7% Optical encoder and laser displacement systems Premium accuracy for indoor-farming gantries
Balluff GmbH ~4–6% Inductive and magnetostrictive linear sensors Strong European OEM integration
SICK AG ~3–5% Laser and optical distance sensors Machine-safety-certified product lines
Turck Inc. ~3–5% Inductive linear position sensors, IP69K rated Harsh-environment field applications
Allegro MicroSystems ~3–5% Hall-effect and TMR ICs for angle sensing Fabless semiconductor scale advantages
ams-OSRAM AG ~2–4% Magnetic rotary encoder ICs Ultra-low-power MEMS integration
Pepperl+Fuchs ~2–4% Inductive and ultrasonic position sensors Process-automation crossover expertise
ifm electronic ~2–3% IO-Link-enabled position sensors Digital-ready smart-sensor ecosystem


Recent News & Developments

  • TE Connectivity (March 2025): Launched the KMXP series of magnetoresistive angle sensors rated to 150 °C for next-generation autonomous tractor steering systems [Ref 3].
  • European Commission (January 2025): Published final delegated acts under the EU Machinery Regulation (EU) 2023/1230 mandating performance-level-d position feedback on autonomous agricultural vehicles from January 2027 [Ref 1].
  • Allegro MicroSystems (June 2024): Acquired a magnetic-sensor IP portfolio from a Swiss fabless start-up for USD 42 Million, bolstering its TMR angle-sensor roadmap [Ref 23].
  • USDA (September 2024): Awarded USD 420 Million in precision-agriculture equipment grants under the Inflation Reduction Act, with sensor-integrated implements qualifying for up to 50% cost-share [Ref 2].
  • Balluff GmbH (April 2024): Partnered with a leading Indian tractor OEM to co-develop IO-Link-connected position sensors for sub-50-HP tractors, targeting the SMAM-subsidized smallholder segment [Ref 6].


Position Sensor Market Report Scope

Parameter Detail
Market Scope Position sensors for agricultural machinery, livestock monitoring, indoor farming, and allied applications
Study Period 2021–2035
CAGR (Forecast) 10.35% (2026–2035)
Market Size — 2025 USD 9.12 Billion
Market Size — 2035 USD 24.40 Billion
Fastest Growing Segment Laser Displacement Sensors (by type); Non-Contact (by technology)
Companies Profiled 10 (see Section 10)
Valuation Currency USD Billion


FAQs

How do position sensors handle electromagnetic interference in high-voltage electric tractor drivetrains?
Manufacturers use differential signal architectures and on-chip shielding rated to 200 V/m field strength. ISO 11452-compliant EMI testing is now standard for any sensor destined for electric agricultural platforms [Ref 12].
What is the typical field-replacement interval for agricultural position sensors?
Ruggedized non-contact sensors last 15,000–20,000 operating hours, roughly matching a tractor's economic life. Contact-type sensors typically require replacement at 6,000–8,000 hours due to mechanical wear [Ref 10].
Can legacy analog sensor harnesses be upgraded to digital CAN/SENT without full rewiring?
Adapter modules that convert 0–5 V analog signals to CAN frames are commercially available. These bridge solutions typically cost USD 35–60 per channel and require no harness modifications [Ref 5].
What food-safety certifications apply to position sensors used in indoor farming?
Sensors in direct contact with produce conveyors need FDA 21 CFR 175–178 compliant housings. Stainless-steel IP69K-rated enclosures meeting NSF/ANSI 169 are the most common certification path [Ref 12].
How does sensor fusion change the procurement calculus for position sensors?
Fusion algorithms combine position, IMU, and GNSS data, reducing accuracy requirements per individual sensor. This enables procurement of lower-cost sensors while achieving system-level precision below 2 cm [Ref 7].
What role do position sensors play in carbon-credit verification for precision agriculture?
Section-control and variable-rate application data from position sensors document input-reduction practices. These records are increasingly accepted by voluntary carbon registries as verification evidence [Ref 22].
Are there open-source alternatives to proprietary sensor-calibration software?
Open-source frameworks such as LinuxCNC and ROS2-based calibration nodes support common sensor interfaces. Adoption remains limited in commercial agriculture due to OEM warranty restrictions [Ref 7].    
Author
Author
Author Profile
Nirmit Biswas LinkedIn
Senior Research Analyst
With 5+ years of expertise in Market Intelligence and Strategic Research, Nirmit Biswas specializes in ICT, Semiconductors, and BFSI. Backed by an MBA in Financial Services and a Computer Science foundation, Nirmit blends technical depth with business acumen. He has successfully led 100+ projects for global enterprises and startups, including Amazon, Cisco, L&T and Huawei, delivering market estimations, competitive benchmarking, and GTM strategies. His focus lies in transforming complex data into clear, actionable insights that drive growth, innovation, and investment decisions. Recognized for bridging engineering innovation with executive strategy, Nirmit helps businesses navigate dynamic markets with confidence.
Co-Author
Co-Author Profile
Aarti Dhapte LinkedIn
AVP - Research
A consulting professional focused on helping businesses navigate complex markets through structured research and strategic insights. I partner with clients to solve high-impact business problems across market entry strategy, competitive intelligence, and opportunity assessment. Over the course of my experience, I have led and contributed to 100+ market research and consulting engagements, delivering insights across multiple industries and geographies, and supporting strategic decisions linked to $500M+ market opportunities. My core expertise lies in building robust market sizing, forecasting, and commercial models (top-down and bottom-up), alongside deep-dive competitive and industry analysis. I have played a key role in shaping go-to-market strategies, investment cases, and growth roadmaps, enabling clients to make confident, data-backed decisions in dynamic markets.
Download Free Sample

Kindly complete the form below to receive a free sample of this Report

Download PDF ×

We do not share your information with anyone. However, we may send you emails based on your report interest from time to time. You may contact us at any time to opt-out.

















