Segmentation Quick Reference
| Dimension | Sub-Segments | Dominant Segment | Fastest Growing Segment |
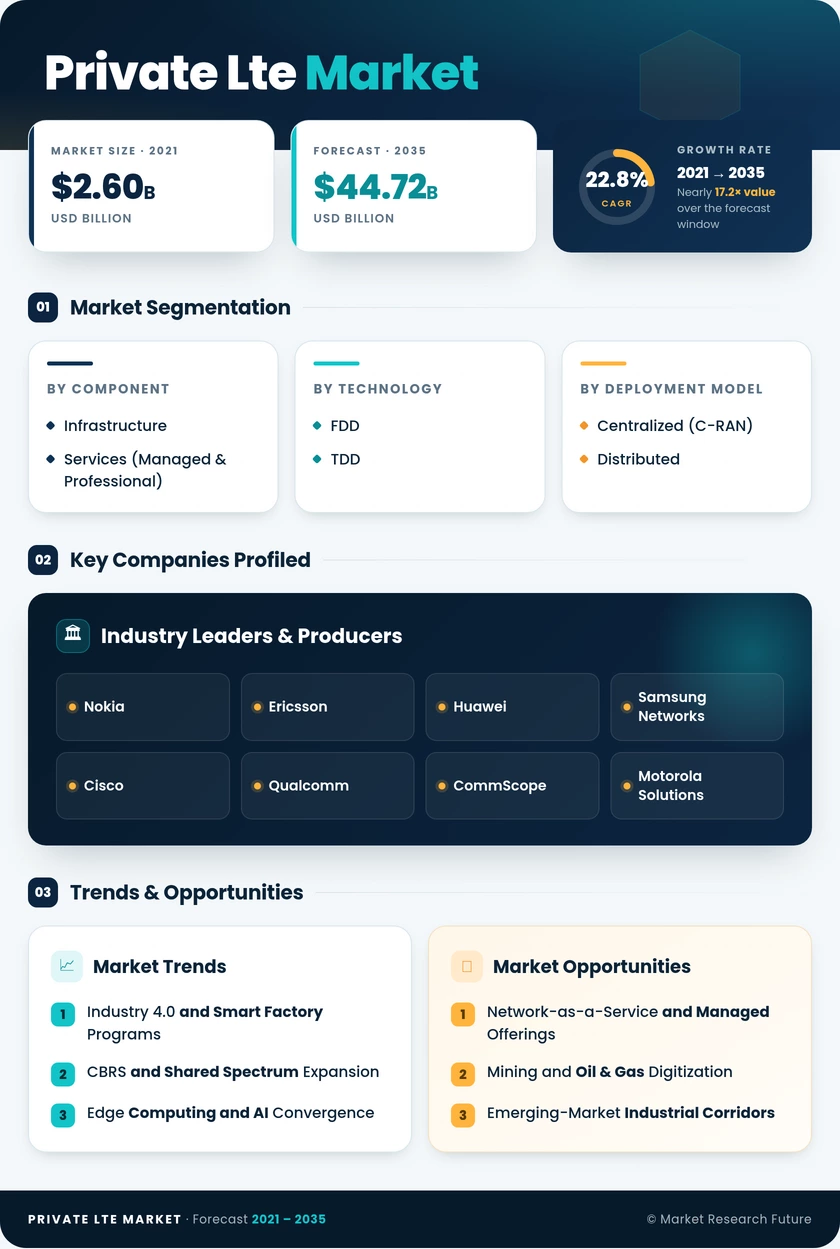
| Component | Infrastructure; Services (Managed & Professional) | Infrastructure | Managed Services |
| Technology | FDD; TDD | TDD | FDD |
| Deployment Model | Centralized (C-RAN); Distributed | Distributed | Centralized (C-RAN) |
| Spectrum Type | Licensed; Shared (CBRS); Unlicensed / MulteFire | Licensed | Shared (CBRS) |
| End-User Industry | Manufacturing; Energy & Utilities; Mining & Oil and Gas; Logistics & Warehousing; Private LTE Market; Defense & Public Safety; Others | Manufacturing | Mining & Oil and Gas |
| Geography | North America; Europe; Asia-Pacific; South America; Middle East & Africa | North America | Asia-Pacific |
Market Segmentation Overview
By Component
| Sub-Segment | Key Trend |
| Infrastructure | Continued capex on eNodeB, EPC, and backhaul as greenfield deployments expand globally |
| Services (Managed & Professional) | NaaS and managed-service bundles lowering adoption barriers for mid-market enterprises |
Infrastructure remains the revenue anchor as each new campus LTE deployment requires core-network, radio, and transport hardware. The services segment is gaining momentum as vendors package deployment, monitoring, and spectrum management into recurring-revenue contracts, making enterprise LTE networks accessible without deep in-house cellular expertise.
By Technology
| Sub-Segment | Key Trend |
| Frequency-Division Duplexing (FDD) | Sustained demand in paired licensed bands for public-safety and rural coverage use cases |
| Time Division Duplex (TDD) | Dominates unpaired CBRS and local-license bands; suited for IoT-heavy uplink profiles |
TDD technology commands the majority share due to its alignment with unpaired shared-spectrum allocations globally. FDD retains relevance in dedicated private 4G networks using traditional paired licensed bands, particularly in defense and first-responder verticals.
By Deployment Model
| Sub-Segment | Key Trend |
| Centralized (C-RAN) | Gaining traction in dense, single-building environments where resource pooling reduces hardware footprint |
| Distributed | Preferred for multi-site and geographically dispersed industrial private wireless deployments |
Distributed architecture leads in market share because most industrial campuses span large areas — mines, refineries, ports — where local baseband processing at each cell cluster delivers lower latency than centralized alternatives.
By Spectrum Type
| Sub-Segment | Key Trend |
| Licensed Bands | Retained by enterprises requiring guaranteed interference protection and regulatory certainty |
| Shared Spectrum (CBRS) | Fastest-growing type as FCC PAL/GAA framework matures and device ecosystem expands |
| Unlicensed / MulteFire | Niche adoption for low-cost, small-scale on-premise LTE solutions pilots |
Licensed bands continue to hold the largest share as enterprises in energy, defense, and critical infrastructure demand guaranteed spectrum access. Shared CBRS spectrum is the fastest-growing type, powered by U.S. regulatory support and rapidly falling device costs.
By End-User Industry
| Sub-Segment | Key Trend |
| Manufacturing | AGV navigation, MES integration, and quality-inspection analytics drive demand |
| Energy & Utilities | SCADA modernization and grid-edge monitoring over campus LTE deployment |
| Mining & Oil and Gas | Autonomous haulage and remote-site connectivity as the fastest-growing vertical |
| Logistics & Warehousing | AMR fleet management and real-time inventory tracking |
| Private LTE Market | Connected operating theaters and in-building clinical device networks |
| Defense & Public Safety | MCPTT, tactical edge, and base-level enterprise LTE networks |
| Others | Airports, seaports, education campuses |
Manufacturing and mining represent the two poles of the Private LTE Market end-user landscape — manufacturing as the largest installed base, and mining and oil & gas as the fastest-growing segment due to the absence of public-carrier alternatives in remote extraction environments.