Download Free Sample
Kindly complete the form below to receive a free sample of this Report
Product-photography-and-visual-marketing-services-market Size, Share and Trends Analysis Research Report Information By End Use (Retail, Fashion, Food and Beverage, Electronics, Cosmetics), By Application (E-commerce, Social Media, Advertising, Product Catalogs, Brand Promotion), And By Region (North America, Europe, Asia-Pacific, And Rest Of The World) – Market Forecast Till 2035.
As per MRFR analysis, the Product Photography and Visual Marketing Services Market was estimated at 3.5 USD Billion in 2024. The industry is projected to grow from 3.7 in 2025 to 6.5 by 2035, exhibiting a compound annual growth rate (CAGR) of 5.79% during the forecast period 2025 - 2035.
The Product Photography and Visual Marketing Services Market is experiencing robust growth driven by evolving consumer preferences and technological advancements.
| 2024 Market Size | 3.5 (USD Billion) |
| 2035 Market Size | 6.5 (USD Billion) |
| CAGR (2025 - 2035) | 5.79% |
Shutterstock (US), Getty Images (US), Adobe (US), Fiverr (IL), 99designs (AU), Snapwire (US), Dreamstime (US), Stocksy (CA), Canva (AU)
Our Impact
Enabled $4.3B Revenue Impact for Fortune 500 and Leading Multinationals
Partnering with 2000+ Global Organizations Each Year
30K+ Citations by Top-Tier Firms in the Industry
The Product Photography and Visual Marketing Services Market is currently experiencing a transformative phase, driven by the increasing importance of visual content in digital marketing strategies. Businesses across various sectors are recognizing that high-quality imagery can significantly enhance brand perception and consumer engagement. As e-commerce continues to expand, the demand for professional product photography is likely to rise, with companies seeking to differentiate themselves in a crowded marketplace. This trend suggests that visual storytelling is becoming a critical component of marketing efforts, as brands strive to create compelling narratives that resonate with their target audiences. Moreover, advancements in technology are reshaping the landscape of visual marketing services. The integration of artificial intelligence and augmented reality into photography practices appears to be gaining traction, offering innovative ways to present products. These technologies may enable businesses to create immersive experiences that captivate consumers, potentially leading to higher conversion rates. As the Product Photography and Visual Marketing Services Market evolves, it seems poised to adapt to changing consumer preferences and technological advancements, indicating a dynamic future for visual marketing strategies.
The growth of online shopping is driving demand for high-quality product photography. As more businesses establish their online presence, they require visually appealing images to attract customers and enhance their brand image.
The incorporation of advanced technologies, such as artificial intelligence and augmented reality, is transforming how products are photographed and marketed. These innovations allow for more engaging and interactive visual content.
Consumers increasingly seek authentic and relatable imagery. Brands are shifting towards lifestyle photography that reflects real-life scenarios, aiming to build trust and connection with their audience.
The Product Photography and Visual Marketing Services Market is significantly influenced by the expansion of e-commerce platforms. As online shopping continues to gain traction, businesses recognize the necessity of compelling product imagery to attract and retain customers. Research indicates that 93% of consumers consider visual appearance to be the key deciding factor in a purchase. This has led to an increased investment in professional photography services, as brands aim to create visually stunning online catalogs that enhance user experience. Furthermore, the rise of mobile commerce necessitates that product images are optimized for various devices, further driving demand for specialized visual marketing services. As e-commerce continues to evolve, the Product Photography and Visual Marketing Services Market is poised for substantial growth, with companies seeking innovative ways to showcase their products effectively.
Consumer preference for authenticity is emerging as a significant driver within the Product Photography and Visual Marketing Services Market. Today's consumers are increasingly discerning, seeking genuine representations of products rather than overly polished images. This shift in consumer behavior suggests that brands must adapt their visual marketing strategies to align with this demand for authenticity. Research indicates that 86% of consumers value authenticity in advertising, prompting businesses to invest in lifestyle photography that showcases products in real-life contexts. By doing so, brands can foster trust and build stronger connections with their audience. This trend towards authenticity is likely to influence the types of visual marketing services that are in demand, as companies seek to create relatable and engaging content that resonates with consumers. As a result, the Product Photography and Visual Marketing Services Market may witness a transformation in how brands approach their visual storytelling.
Technological advancements play a crucial role in shaping the Product Photography and Visual Marketing Services Market. Innovations such as high-resolution cameras, drones, and 360-degree photography are revolutionizing how products are captured and presented. These technologies enable brands to create immersive visual experiences that engage consumers on a deeper level. For instance, the use of augmented reality in product photography allows customers to visualize products in their own environment, enhancing the shopping experience. Additionally, advancements in editing software facilitate the creation of stunning visuals that can significantly impact consumer perception. As these technologies become more accessible, businesses are likely to invest in modern photography solutions, thereby propelling the growth of the Product Photography and Visual Marketing Services Market. This trend suggests a future where visual marketing becomes increasingly sophisticated and integral to brand strategy.
The growing importance of social media marketing is a pivotal driver for the Product Photography and Visual Marketing Services Market. With platforms like Instagram, Pinterest, and TikTok prioritizing visual content, brands are compelled to invest in high-quality photography to capture audience attention. Statistics reveal that posts with images receive 650% higher engagement than text-only posts, underscoring the necessity for visually appealing content. As businesses strive to build their online presence, the demand for professional product photography services is likely to increase. This trend indicates that companies will seek to collaborate with visual marketing experts to create content that resonates with their target audience. Consequently, the Product Photography and Visual Marketing Services Market is expected to thrive as brands leverage social media to enhance their visibility and connect with consumers.
The Product Photography and Visual Marketing Services Market experiences a notable surge in demand for high-quality visual content. As brands strive to differentiate themselves in a saturated marketplace, the emphasis on professional product photography becomes paramount. This trend is underscored by the fact that 75% of consumers rely on product images when making purchasing decisions. Consequently, businesses are investing significantly in visual marketing services to enhance their online presence and engage potential customers effectively. The proliferation of social media platforms further amplifies this need, as visually appealing content is more likely to be shared, thereby increasing brand visibility. This growing demand for high-quality visuals is likely to drive innovation and competition within the Product Photography and Visual Marketing Services Market, as companies seek to provide cutting-edge solutions that meet evolving consumer expectations.
In the Product Photography and Visual Marketing Services Market, E-commerce dominates the application segment, commanding a significant portion of the total market share. This segment is characterized by the increasing reliance of online retailers on high-quality product images to enhance customer engagement and drive sales. Social Media closely follows, rapidly gaining traction as businesses leverage platforms such as Instagram and Facebook to showcase products visually and connect with younger audiences.
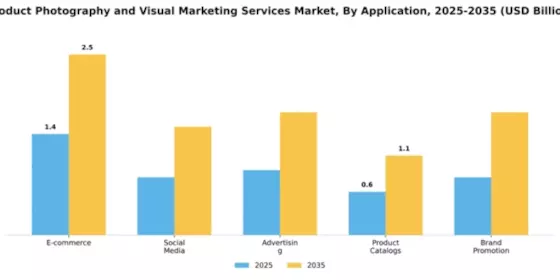
E-commerce: Dominant vs. Social Media: Emerging
E-commerce within the Product Photography and Visual Marketing Services Market is the dominant segment, shaped by the fundamental shift to online shopping. Companies invest substantially in professional product photography to create engaging online catalogs that can significantly impact purchase decisions. On the other hand, Social Media has emerged as a powerful tool in visual marketing, appealing especially to younger demographics who prefer visual content. Brands are utilizing innovative photography techniques to create compelling content for social platforms, thus establishing a strong brand presence and enhancing customer interaction. As user-generated content trends rise, both segments need to adapt continuously to meet evolving consumer expectations.
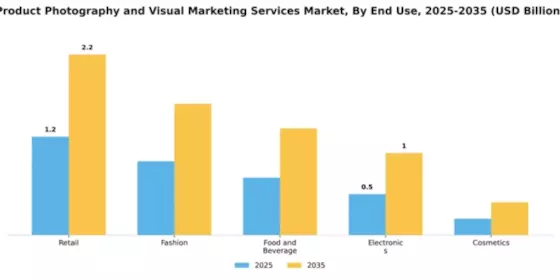
In the Product Photography and Visual Marketing Services Market, the 'End Use' segment illustrates diverse applications among retail, fashion, food and beverage, electronics, and cosmetics. The retail sector claims the largest market share, driven by the vast number of products needing visual representation for online and offline sales. Fashion follows closely, leveraging immersive visual content to enhance consumer engagement and drive purchase decisions.
Retail: Dominant vs. Fashion: Emerging
The retail sector dominates the end-use segment of the Product Photography and Visual Marketing Services Market. As a crucial channel for product visibility, retailers invest significantly in high-quality imagery and marketing visuals. Contrastingly, the fashion industry is rapidly emerging, emphasizing unique and artistic presentations that reflect current trends. With the growing importance of social media and e-commerce, fashion brands are increasingly focused on delivering captivating visual content to entice customers. This dynamic creates a vibrant marketplace where both retail and fashion sectors effectively interact and evolve.
In the Product Photography and Visual Marketing Services Market, Studio Photography holds the largest share due to its controlled environment, consistent quality, and the ability to deliver high-end visuals tailored to product needs. Meanwhile, On-location Photography is rapidly gaining traction, appealing to brands that seek authenticity and context in their visuals by showcasing products in real-world scenarios. This diversifies the offerings available to clients, driving demand for varied settings and styles.
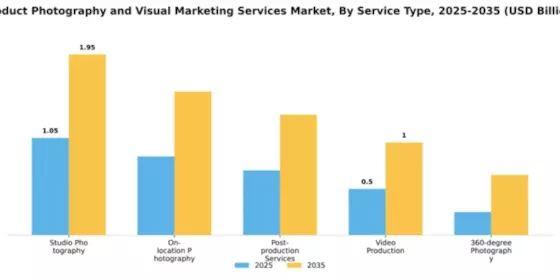
Studio Photography (Dominant) vs. On-location Photography (Emerging)
Studio Photography is recognized as the dominant segment, characterized by its ability to produce high-quality, stylized images with precise lighting and backdrop control. Clients from various industries prefer this approach for product launches and marketing campaigns, where visual impact is crucial. Conversely, On-location Photography is emerging as a key player, leveraging the trend for authentic storytelling in visual marketing. It benefits brands aiming to connect deeply with their target audience through real-life environments. Brands are increasingly investing in this segment to enhance relatability, appealing to consumer desires for genuine experiences and narratives.
Get more detailed insights about Product Photography and Visual Marketing Services Market Request Free Sample
North America continues to lead the Product Photography and Visual Marketing Services Market, holding a significant share of 1.75B in 2024. The region's growth is driven by a robust e-commerce sector, increasing demand for high-quality visuals, and advancements in technology. Regulatory support for digital marketing and advertising further fuels this growth, making it a prime location for visual service providers. The competitive landscape is characterized by major players such as Shutterstock, Getty Images, and Adobe, which dominate the market. The presence of innovative platforms like Fiverr and Canva also enhances the region's offerings. With a focus on quality and creativity, North America is set to maintain its leadership position in the global market.
Europe's Product Photography and Visual Marketing Services Market is valued at 1.1B, reflecting a growing demand for creative visual content. Factors such as the rise of online retail, increased social media engagement, and a focus on brand storytelling are driving this growth. Regulatory frameworks promoting digital innovation and consumer protection are also pivotal in shaping the market landscape. Leading countries like the UK, Germany, and France are at the forefront, with a mix of established firms and emerging startups. Key players such as Adobe and Canva are complemented by local agencies, creating a vibrant ecosystem. The competitive environment encourages innovation, making Europe a dynamic player in the global market.
The Asia-Pacific region, with a market size of 0.9B, is rapidly emerging in the Product Photography and Visual Marketing Services sector. The growth is fueled by increasing internet penetration, a booming e-commerce industry, and a young, tech-savvy population. Regulatory initiatives aimed at enhancing digital marketing practices are also contributing to this upward trend, making the region a focal point for visual services. Countries like China, India, and Australia are leading the charge, with a mix of local and international players. Companies such as 99designs and Snapwire are gaining traction, while established firms like Adobe are expanding their reach. The competitive landscape is vibrant, with a strong emphasis on innovation and quality, positioning Asia-Pacific as a key player in the global market.
The Middle East and Africa region, valued at 0.75B, presents significant growth opportunities in the Product Photography and Visual Marketing Services Market. Factors such as increasing smartphone usage, a growing middle class, and the expansion of e-commerce are driving demand for high-quality visual content. Regulatory support for digital marketing initiatives is also enhancing the market's potential. Leading countries like South Africa and the UAE are at the forefront, with a mix of local startups and international firms. The competitive landscape is evolving, with key players beginning to establish a presence. As the region continues to develop, it is poised to become an important player in the global visual marketing landscape.
The Product Photography and Visual Marketing Services Market is characterized by a dynamic competitive landscape, driven by the increasing demand for high-quality visual content across various digital platforms. Key players such as Shutterstock (US), Getty Images (US), and Adobe (US) are at the forefront, leveraging their extensive libraries and technological innovations to enhance user experience. These companies are strategically positioned to capitalize on the growing trend of e-commerce and social media marketing, which necessitates compelling visual storytelling. Their operational focus includes digital transformation initiatives, partnerships with emerging brands, and the integration of AI technologies to streamline content creation and distribution, collectively shaping a competitive environment that emphasizes quality and accessibility.In terms of business tactics, companies are increasingly localizing their services to cater to diverse markets, optimizing supply chains to ensure timely delivery of visual content. The market structure appears moderately fragmented, with a mix of established players and niche providers. This fragmentation allows for a variety of offerings, yet the collective influence of major companies like Shutterstock (US) and Getty Images (US) tends to dominate market trends and pricing strategies, creating a competitive dynamic that encourages innovation and differentiation.In November Shutterstock (US) announced a strategic partnership with a leading e-commerce platform to enhance its visual content offerings. This collaboration aims to provide tailored photography solutions that meet the specific needs of online retailers, thereby expanding Shutterstock's market reach and reinforcing its position as a key player in the visual marketing space. The strategic importance of this partnership lies in its potential to drive revenue growth through increased demand for customized visual content, aligning with the broader trend of personalized marketing.Similarly, in October 2025, Adobe (US) launched a new suite of AI-driven tools designed to streamline the product photography process for businesses. This initiative not only enhances the efficiency of content creation but also positions Adobe as a leader in integrating advanced technology into visual marketing services. The strategic significance of this development is profound, as it reflects a shift towards automation and innovation, enabling businesses to produce high-quality visuals at a faster pace, thus meeting the evolving demands of the market.In September Getty Images (US) expanded its global footprint by acquiring a regional photography agency in Asia. This acquisition is expected to bolster Getty's local content offerings and enhance its competitive edge in the rapidly growing Asian market. The strategic importance of this move lies in its potential to diversify Getty's portfolio and provide clients with localized content that resonates with regional audiences, thereby strengthening its market position.As of December the competitive trends within the Product Photography and Visual Marketing Services Market are increasingly defined by digitalization, sustainability, and the integration of AI technologies. Strategic alliances are becoming more prevalent, as companies recognize the value of collaboration in enhancing service offerings and expanding market reach. Looking ahead, competitive differentiation is likely to evolve from traditional price-based competition to a focus on innovation, technological advancements, and supply chain reliability. This shift suggests that companies that prioritize these elements will be better positioned to thrive in an increasingly competitive landscape.






The Product Photography and Visual Marketing Services Market is projected to grow at a 5.79% CAGR from 2025 to 2035, driven by technological advancements and increasing e-commerce demand.
New opportunities lie in:
By 2035, the market is expected to be robust, reflecting substantial growth and innovation.
| MARKET SIZE 2024 | 3.5(USD Billion) |
| MARKET SIZE 2025 | 3.7(USD Billion) |
| MARKET SIZE 2035 | 6.5(USD Billion) |
| COMPOUND ANNUAL GROWTH RATE (CAGR) | 5.79% (2025 - 2035) |
| REPORT COVERAGE | Revenue Forecast, Competitive Landscape, Growth Factors, and Trends |
| BASE YEAR | 2024 |
| Market Forecast Period | 2025 - 2035 |
| Historical Data | 2019 - 2024 |
| Market Forecast Units | USD Billion |
| Key Companies Profiled | Shutterstock (US), Getty Images (US), Adobe (US), Fiverr (IL), 99designs (AU), Snapwire (US), Dreamstime (US), Stocksy (CA), Canva (AU) |
| Segments Covered | Application, End Use, Service Type |
| Key Market Opportunities | Integration of augmented reality in Product Photography and Visual Marketing Services Market enhances consumer engagement and experience. |
| Key Market Dynamics | Rising demand for high-quality visual content drives innovation and competition in product photography and visual marketing services. |
| Countries Covered | North America, Europe, APAC, South America, MEA |
The market valuation was 3.5 USD Billion in 2024.
The market is projected to reach 6.5 USD Billion by 2035.
The expected CAGR is 5.79% during the forecast period 2025 - 2035.
Key application segments include E-commerce, Social Media, and Advertising, with valuations expected to rise significantly.
The retail sector had a valuation of 1.2 USD Billion in 2024 and is projected to grow to 2.2 USD Billion by 2035.
Key players such as Shutterstock and Getty Images are instrumental in shaping market trends and driving innovation.
The fashion segment was valued at 0.9 USD Billion in 2024 and is expected to reach 1.6 USD Billion by 2035.
Services include Studio Photography, On-location Photography, and Post-production Services, among others.
The food and beverage sector had a valuation of 0.7 USD Billion in 2024, with growth anticipated to 1.3 USD Billion by 2035.
Video production services were valued at 0.5 USD Billion in 2024 and are projected to grow to 1.0 USD Billion by 2035.


Kindly complete the form below to receive a free sample of this Report

“This is really good guys. Excellent work on a tight deadline. I will continue to use you going forward and recommend you to others. Nice job”


“Thanks. It’s been a pleasure working with you, please use me as reference with any other Intel employees.”


“Thanks for sending the report it gives us a good global view of the Betaïne market.”


“Thank you, this will be very helpful for OQS.”


“We found the report very insightful! we found your research firm very helpful. I'm sending this email to secure our future business.”


“I am very pleased with how market segments have been defined in a relevant way for my purposes (such as "Portable Freezers & refrigerators" and "last-mile"). In general the report is well structured. Thanks very much for your efforts.”


“I have been reading the first document or the study, ,the Global HVAC and FP market report 2021 till 2026. Must say, good info! I have not gone in depth at all parts, but got a good indication of the data inside!”


“We got the report in time, we really thank you for your support in this process. I also thank to all of your team as they did a great job.”


“The Automotive 48V ECU Components Procurement Intelligence Study” was a complex project, but the Market Research Future (MRFR) team handled it with quality, agility, and customer-centricity. They delivered all requested data on time and within the agreed scope. The team, including Shubhendra Anand and Rahul Gotadki, was always readily available to clarify questions and swiftly implement necessary adjustments, driving the project to a successful conclusion within a very demanding timeframe.
I would also like to specifically commend Akshay Agarwal for his responsiveness and support at every stage—from our initial inquiry on May 6th through to final delivery on June 18th. His dedication made the entire process seamless.”



