Segmentation Quick Reference
| Dimension | Sub-Segments | Dominant Segment | Fastest Growing Segment |
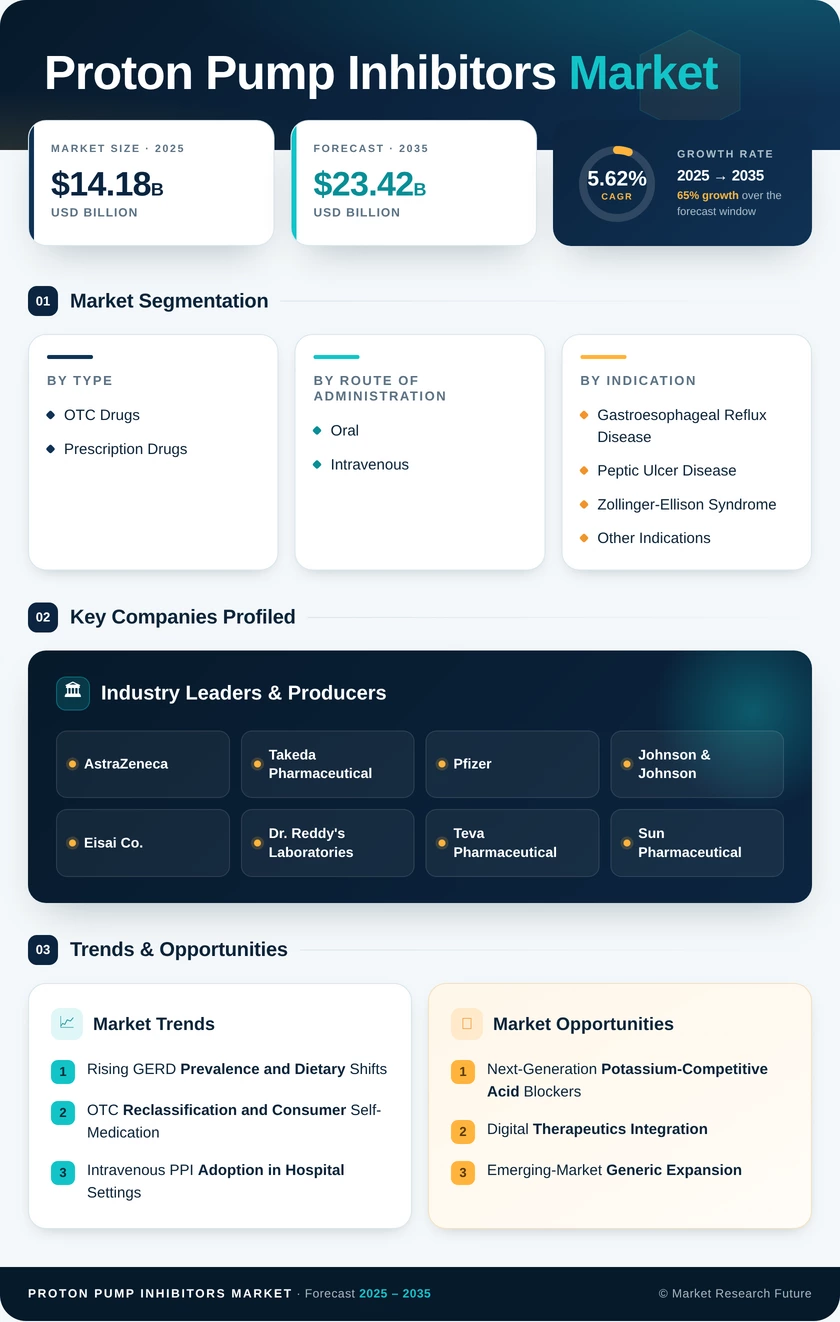
| Drug Type | OTC Drugs, Prescription Drugs | OTC Drugs | Prescription Drugs |
| Route of Administration | Oral, Intravenous | Oral | Intravenous |
| Indication | GERD, Peptic Ulcer Disease, Zollinger-Ellison Syndrome, Other | GERD | Zollinger-Ellison Syndrome |
| Distribution Channel | Hospital Pharmacies, Retail Pharmacies, Online Pharmacies | Hospital Pharmacies | Online Pharmacies |
| Geography | North America, Europe, Asia-Pacific, South America, Middle East & Africa | North America | Asia-Pacific |
Market Segmentation Overview
By Drug Type
| Sub-Segment | Key Trend |
| OTC Drugs | Expanding pharmacy-level consumer access through regulatory reclassification; volume-driven but margin-compressed |
| Prescription Drugs | Specialist-initiated high-dose regimens for erosive esophagitis and rare acid hypersecretory conditions |
OTC drugs continue to dominate unit volumes as self-medication culture grows across developed economies. Prescription drugs, however, are gaining share in value terms as gastroenterologists mandate branded formulations for complex conditions requiring sustained gastric acid suppression beyond standard OTC dosing.
By Route of Administration
| Sub-Segment | Key Trend |
| Oral | Delayed-release capsules and orally disintegrating tablets remain the preferred outpatient format |
| Intravenous | Rapid adoption in ICU stress ulcer prophylaxis and acute upper GI bleeding management |
Oral administration remains the default route for the vast majority of acid reflux medication prescriptions globally. Intravenous formulations are carving a premium niche within hospital settings, commanding per-dose prices significantly above oral equivalents due to their critical-care utility and patent-protected delivery systems.
By Indication
| Sub-Segment | Key Trend |
| Gastroesophageal Reflux Disease | Highest prevalence indication globally; first-line omeprazole therapy dominates treatment algorithms |
| Peptic Ulcer Disease | H. pylori eradication protocols sustain steady prescription volumes |
| Zollinger-Ellison Syndrome | Orphan-drug pricing and lifelong dosing requirements drive the fastest CAGR |
| Other Indications | NSAID-induced gastropathy and Barrett's esophagus monitoring protocols |
GERD remains the primary revenue engine, but the niche Zollinger-Ellison segment commands disproportionate value due to required high-dose, long-duration stomach ulcer medication regimens that generate recurring premium revenue.
By Distribution Channel
| Sub-Segment | Key Trend |
| Hospital Pharmacies | Institutional procurement anchored by IV PPI formulary mandates |
| Retail Pharmacies | Walk-in OTC purchases and first-fill prescription dispensing |
| Online Pharmacies | Telehealth-bundled subscriptions and direct-to-consumer GERD treatment drug delivery |
Hospital pharmacies retain distribution dominance due to institutional procurement volumes and the growing IV PPI segment. Online pharmacies are the disruptive force, with subscription-model acid reflux medication platforms reshaping consumer access and compressing traditional retail pharmacy margins.