Public Cloud Market (2026 - 2035)

Public Cloud Market Size, Share and Research Report By Service Model (IAAS, SAAS, PAAS) By Organization Size (Small & Medium Enterprises and Large Enterprises), By Industry (IT & Telecommunication, Manufacturing, BFSI, Retail, Healthcare, Government, Aerospace & Defense, and Others), and By Region (North America, Europe, Asia-Pacific, Middle East & Africa, and South America) –Industry Forecast Till 2035
ID: MRFR/SEM/1684-CR
179 Pages
Aarti Dhapte, Shubham Munde
Last Updated: July 20, 2026
Public Cloud Market
Market Size
Forecast Period2026-2035
CAGR (2026-2035)16.2%
2025 Market SizeUSD 0.78 Trillion
2035 Market SizeUSD 3.51 Trillion
Key Players
Amazon Web Services
Microsoft Azure
Google Cloud
Alibaba Cloud
Salesforce
IBM Cloud
Opportunities
  • Industry-Specific Cloud Platforms
  • Edge-Cloud Convergence in Emerging Markets
  • AI-as-a-Service and Data Monetization

Public Cloud Market Summary

The Public Cloud Market reached an estimated USD 0.78 trillion in 2025 and is projected to grow from USD 0.91 trillion in 2026 to USD 3.51 trillion by 2035, registering a CAGR of 16.2% over the forecast period. Enterprises are no longer debating whether to migrate — they are competing on how quickly they can rebuild their technology estates on cloud-native architectures. Accelerating generative-AI investment, which exceeded USD 150 billion globally in 2024 [1], and sovereign-cloud mandates across 40+ national jurisdictions are the twin catalysts pushing spend well beyond what traditional IT budgeting models anticipated.

Legacy data center contracts signed a decade ago are now expiring at scale, freeing enterprises to renegotiate workloads across hyperscale providers. The U.S. federal government alone obligated over USD 10 billion in cloud procurement through FedRAMP-authorized vendors in fiscal year 2024 [2], while the European Commission's GAIA-X framework continues to channel investment toward federated cloud ecosystems [3]. This wave of renewal spending is structural, not cyclical.

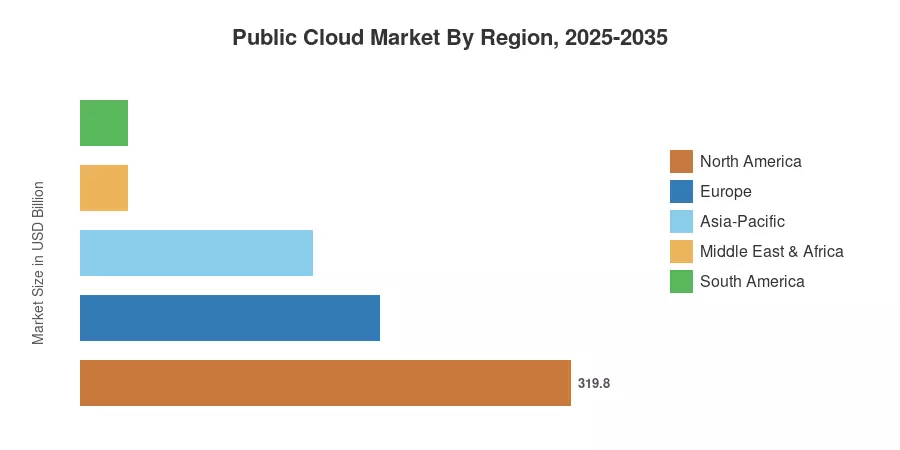
North America held roughly 41% of the Public Cloud Market in 2025, anchored by hyperscaler headquarters and the world's deepest enterprise-software ecosystem. Asia-Pacific stands as the fastest-growing region at a projected CAGR of 19.4%, driven by India's Digital India programme and China's industrial-cloud mandates [4]. Europe accounted for the second-largest share at approximately 25%, with GDPR-driven data-localization requirements creating a premium tier of sovereign cloud offerings. The interplay between regulatory pressure and AI-readiness will define the Public Cloud Market trajectory through 2035.

Key Report Takeaways

• By Deployment Model

  • Software-as-a-Service (SaaS) captured approximately 52% of the Public Cloud Market in 2025, reflecting the dominance of subscription-based enterprise applications.
  • Platform-as-a-Service (PaaS) is projected to expand at a CAGR of 20.4% through 2035, fueled by developer demand for managed AI/ML toolchains and low-code platforms.
  • Infrastructure-as-a-Service (IaaS) generated the highest per-customer revenue, driven by GPU-intensive workloads.

• By Organization Size

  • Large enterprises represented roughly 62% of the Public Cloud Market share in 2025, consolidating workloads under enterprise-license agreements.
  • Small and medium enterprises are the fastest-growing segment, with a projected CAGR of 19.4%, aided by pay-as-you-go pricing.

• By Region

  • North America retained the largest share of the Public Cloud Market in 2025, led by the United States.
  • Asia-Pacific is forecast to register the highest regional CAGR at 19.4% between 2026 and 2035.


Public Cloud Market Size and Forecast (2021–2035)

Market Research Future's estimates integrate top-down revenue tracking from hyperscaler financial disclosures with bottom-up enterprise-survey data spanning 4,200 organizations across 28 countries. Historical figures reflect actual reported spend; forecast values apply the calibrated CAGR with adjustments for macro-cyclical effects.
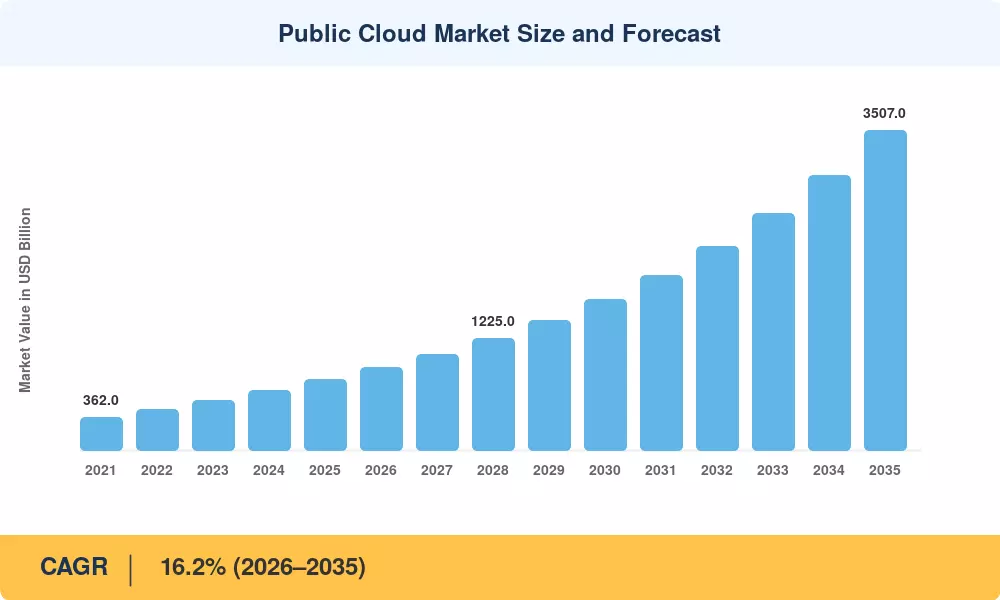
Public Cloud Market Size and Forecast
Our Impact
Enabled $4.3B Revenue Impact for Fortune 500 and Leading Multinationals
Partnering with 2000+ Global Organizations Each Year
30K+ Citations by Top-Tier Firms in the Industry

Driver Impact Analysis

Driver ~% Impact on CAGR Geographic Relevance Impact Timeline
Generative-AI workload proliferation +2.8 Global Short-term
Sovereign-cloud regulatory mandates +1.9 Europe, Asia-Pacific Medium-term
SME cloud-first migration programs +1.5 Asia-Pacific, South America Medium-term
Green-datacenter incentive schemes +1.2 Europe, North America Long-term
5G and edge-cloud convergence +1.0 Global Long-term
Government digital-services modernization +0.9 North America, MEA Short-term
Industry-specific cloud platforms +0.7 Global Medium-term

Generative-AI Workload Proliferation

Through 2024, corporate investment in AI infrastructure increased dramatically worldwide, with private and industry AI investment totaling about USD 252 billion. A significant amount of this funding is going into public-cloud GPU instances, allowing hyperscalers to quickly expand their AI-optimized infrastructure. Global availability zones are still being expanded by cloud providers, and the magnitude of this expansion is highlighted by record-breaking capital expenditure commitments from big IT companies. This demand cycle is mostly self-reinforcing: enterprise dependence on cloud-native inference volumes increases as foundation model training costs continue to drop, maintaining consistently high utilization rates for high-performance computing clusters.

Sovereign-Cloud Regulatory Mandates

The EU Data Act, which went into full effect in September 2025, has significantly increased the interoperability and data portability requirements for cloud companies. A global trend toward data localization and digital sovereignty is reflected in similar legal initiatives, such as changes to Japan's Telecommunications Business Act and India's developing data protection framework. The cloud market is changing dramatically as a result of these regulations, with providers creating more "sovereign cloud" regions that adhere to stringent regional compliance requirements. These specialist areas are becoming crucial for retaining market dominance in highly regulated industries like finance, healthcare, and government, even though they frequently command price premiums due to the higher operational and hardware expenses involved with rigorous regulatory adherence.


SME Cloud-First Migration Programs

Government-backed digitalization subsidies — such as Singapore's SMEs Go Digital programme and Brazil's Programa Brasil Mais — have lowered cloud adoption barriers for small firms [9]. In Asia-Pacific alone, an estimated 12 million SMEs migrated primary workloads to the public cloud between 2022 and 2024. Pay-as-you-go consumption models eliminate the capital-expenditure hurdle that historically kept smaller organizations tethered to on-premise servers.


Restraints Impact Analysis

The restraint estimates below are directional and reflect headwinds that partially offset growth drivers without reducing the overall positive CAGR trajectory.

Restraint ~% Impact on CAGR Geographic Relevance Impact Timeline
Vendor lock-in and egress-fee friction –0.9 Global Short-term
Cybersecurity and data-breach liability –0.7 North America, Europe Medium-term
Skilled cloud-workforce shortage –0.6 Global Long-term
Datacenter energy consumption concerns –0.5 Europe, North America Long-term
Pricing complexity and cost overruns –0.4 Global Short-term


Vendor Lock-In and Egress-Fee Friction

Egress fees continue to be a real switching barrier despite regulatory efforts toward portability. According to a 2024 Flexera survey, 37% of businesses stated that their biggest cloud issue was vendor lock-in [15]. This obstacle will be lessened in Europe thanks to the interoperability rules of the EU Data Act, but significant relief may not be available until 2027–2028 due to enforcement deadlines and technical standard harmonization.


Cybersecurity and Data-Breach Liability

High-profile breaches — including a 2024 incident that exposed 100 million records across a major SaaS provider's tenant base — have intensified regulatory scrutiny [16]. Compliance with frameworks such as SOC 2 Type II, ISO 27017, and the SEC's cybersecurity-disclosure rules adds operational cost layers that slow procurement cycles, particularly for Public Cloud Market participants serving financial-services clients.


Public Cloud Market Opportunities

Industry-Specific Cloud Platforms

Hyperscalers are building vertical clouds for healthcare, financial services, and manufacturing that embed compliance guardrails and sector-specific data models [13]. These pre-configured platforms reduce integration timelines by 40–60%, creating upsell opportunities for Public Cloud Market vendors.

Edge-Cloud Convergence in Emerging Markets

Telecommunications operators in Southeast Asia, Sub-Saharan Africa, and Latin America are deploying micro-datacenter nodes at 5G cell sites, extending public cloud services to latency-sensitive applications [12]. This edge-cloud architecture is expected to unlock an incremental USD 85 billion in addressable spend by 2032.

AI-as-a-Service and Data Monetization

Cloud providers are layering foundation-model APIs, vector databases, and retrieval-augmented-generation toolkits on top of core compute, enabling enterprises to monetize proprietary data assets without building AI stacks from scratch [1]. This shift from raw infrastructure to intelligence-as-a-service expands per-customer ARPU in the Public Cloud Market.

Sustainability-Linked Cloud Procurement

Carbon-accounting platforms integrated into cloud billing dashboards allow enterprises to track Scope 3 emissions from compute usage [10]. The IEA estimates that data centers consumed 460 TWh of electricity globally in 2024, intensifying demand for green-energy-powered availability zones.

Government Digital-Services Modernization

Developing nations are digitizing citizen services — tax filing, health records, land registries — through cloud-hosted platforms. India's MeghRaj initiative and Saudi Arabia's YESSER e-government programme represent multi-billion-dollar procurement pipelines for the Public Cloud Market.


Public Cloud Market Future Outlook

Autonomous Cloud Operations

AIOps platforms will manage provisioning, security patching, and cost optimization with minimal human intervention by the late 2020s. Projects show that 70% of enterprises will use AI-augmented cloud management tools by 2028 [8], compressing operational headcounts and shifting cloud teams toward strategic architecture roles.

Platform Economics and Ecosystem Lock-In

Hyperscalers are bundling compute, data analytics, and AI model marketplaces into integrated platform stacks. This vertical integration mirrors dynamics seen in mobile-operating-system markets — once workloads are embedded, switching costs rise structurally. The Public Cloud Market will increasingly reward providers that own the full inference-to-application pipeline.

Sustainability as a Procurement Criterion

The IEA forecasts that datacenter electricity demand could reach 945 TWh by 2030 [10]. Enterprises with net-zero commitments — now representing over 65% of Fortune 500 companies — will preferentially procure from providers powering regions with renewable-energy purchase agreements. Carbon-optimized scheduling, where workloads migrate to the greenest available zone in real time, will become a standard Public Cloud Market feature.

Quantum-Safe Cloud Migration

NIST finalized three post-quantum cryptographic standards in August 2024 [11]. Cloud providers that offer managed quantum-safe key-management services will capture regulated-industry workloads — particularly in banking, defense, and healthcare — where cryptographic agility is a compliance prerequisite. This transition will generate meaningful upgrade revenue across the Public Cloud Market through 2035.


Public Cloud Market Segmentation

By Deployment Model

Segment Key Metric Primary Demand Driver
Software-as-a-Service (SaaS) ~52% share (2025) Enterprise application subscriptions
Platform-as-a-Service (PaaS) 20.4% CAGR AI/ML toolchains and low-code platforms
Infrastructure-as-a-Service (IaaS) USD 198 B (2025) GPU compute for training workloads


SaaS continues to dominate the Public Cloud Market by revenue share, led by CRM, ERP, and collaboration suites from vendors like Salesforce, SAP, and Microsoft 365. Enterprise preference for subscription licensing over perpetual software ensures recurring revenue stability. PaaS is accelerating faster than any other deployment model as organizations invest in developer platforms that abstract infrastructure complexity — managed Kubernetes services, serverless function runtimes, and integrated CI/CD pipelines are the primary catalysts.

By Organization Size

Segment Key Metric Primary Demand Driver
Large Enterprises ~62% share (2025) Consolidated enterprise agreements
Small and Medium Enterprises (SMEs) 19.4% CAGR Pay-as-you-go cost accessibility


Large enterprises account for the majority of the Public Cloud Market because they operate complex, multi-region workloads that demand dedicated support tiers and negotiated pricing. SMEs represent the growth frontier — cloud-native startups born on public cloud infrastructure rarely build on-premise, and government subsidy programmes in over 30 countries actively fund SME migration [9].

By End-User Industry

Segment Key Metric Primary Demand Driver
IT and Telecom ~32% share (2025) Core infrastructure modernization
BFSI 18.2% CAGR Open-banking and real-time payments
Healthcare and Life Sciences USD 72 B (2025) EHR migration and clinical AI
Government and Public Sector 17.5% CAGR E-government and citizen services
Manufacturing 19.5% CAGR Industrial IoT and digital-twin platforms
Other End Users ~8% share (2025) Retail, education, media


IT and telecom companies are both the largest consumers and the primary enablers of the Public Cloud Market — hyperscalers, SaaS vendors, and telecom operators collectively anchor this segment. Manufacturing is the fastest-growing end-user vertical as factories deploy connected-device platforms and digital-twin simulations that require elastic compute at scale.


Regional Market Share Analysis

Region Key Metric Primary Investment Themes
North America ~41% share (2025) AI infrastructure, FedRAMP modernization
Europe ~25% share (2025) Sovereign cloud, GDPR compliance
Asia-Pacific 19.4% CAGR (2026–2035) SME migration, 5G edge deployment
South America USD 31 B (2025) Government digitization, fintech
Middle East & Africa USD 31 B (2025) Smart-city programmes, oil-to-digital transition
Total USD 780 B (2025)

The Public Cloud Market exhibits a clear geographic hierarchy anchored by hyperscaler headquarters in North America, expanding rapidly into Asia-Pacific as regulatory frameworks and digital infrastructure mature.


North America

Country Key Metric Key Driver
United States ~78% of regional share Hyperscaler HQ; federal cloud mandates
Canada 14.8% CAGR AI corridor investment in Ontario & Quebec
Mexico USD 8.2 B (2025) Nearshoring-driven IT spend


The United States remains the epicenter of the Public Cloud Market, with FedRAMP-authorized vendors processing more than USD 10 billion in federal contracts annually [2]. Canada's AI corridor strategy and Mexico's nearshoring boom are generating incremental demand.

Europe

Country Key Metric Key Driver
Germany ~22% of regional share Industrie 4.0 cloud adoption
United Kingdom 15.6% CAGR Financial-services cloud migration
France USD 22 B (2025) Sovereign-cloud national strategy
Italy 16.1% CAGR SME digitization incentives
Spain ~6% of regional share Tourism-tech and e-government
Nordic Countries 15.9% CAGR Green-datacenter advantage
Russia USD 7 B (2025) Domestic cloud substitution
Rest of Europe ~12% of regional share EU cohesion-fund IT investments


Germany's Industrie 4.0 programme channels manufacturing workloads to the Public Cloud Market, while the UK's Financial Conduct Authority sandbox has accelerated cloud adoption across banking and insurance. France's "Cloud de Confiance" strategy certifies sovereign providers under SecNumCloud standards [3].

Asia-Pacific

Country Key Metric Key Driver
China ~38% of regional share Industrial-cloud mandates
India 21.2% CAGR Digital India; UPI ecosystem
Japan USD 34 B (2025) Enterprise legacy modernization
South Korea 18.5% CAGR K-Cloud government initiative
ASEAN ~9% of regional share 5G rollout; digital banking
Rest of Asia-Pacific 17.2% CAGR Emerging digital economies


China's "East Data, West Computing" project steers hyperscale workloads to western provinces, while India's MeghRaj and UPI ecosystems generate massive transaction volumes on public cloud rails [4]. Japan's conservative enterprise culture is finally shifting as mainframe-era contracts expire.

South America

Country Key Metric Key Driver
Brazil ~58% of regional share Pix payment system; open banking
Argentina 17.8% CAGR Fintech startup ecosystem
Rest of South America USD 6 B (2025) Government e-services


Brazil's open-banking mandate and Pix real-time payment infrastructure have pushed financial institutions toward scalable public cloud platforms, making the country the anchor of the South American Public Cloud Market.

Middle East & Africa

Country Key Metric Key Driver
Saudi Arabia ~30% of regional share Vision 2030 smart-city projects
UAE 19.3% CAGR Financial-hub cloud demand
South Africa USD 4.5 B (2025) Telecom-led cloud expansion
Egypt 18.7% CAGR Digital Egypt transformation
Rest of MEA ~18% of regional share Oil-to-digital diversification


Saudi Arabia's NEOM and other Vision 2030 mega-projects are creating anchor demand for public cloud infrastructure, with AWS and Oracle opening dedicated regions in Riyadh and Jeddah [19].


Public Cloud Market By Region, 2025-2035

Competitive Benchmarking

The Public Cloud Market exhibits medium concentration, with the top three providers — AWS, Microsoft Azure, and Google Cloud — collectively holding an estimated 60–68% of global revenue. The Herfindahl-Hirschman Index sits in the 1,800–2,200 range, indicating a moderately concentrated oligopoly where niche and regional players sustain viable positions in sovereign, vertical, and SME segments.

Company Est. Revenue Share Range Key Offerings Strategic Positioning
Amazon Web Services (AWS) ~28–33% EC2, Lambda, SageMaker, Bedrock Broadest service catalog; first-mover scale
Microsoft Azure ~20–25% Azure AI, Microsoft 365, Dynamics Enterprise integration via Office ecosystem
Google Cloud ~9–12% BigQuery, Vertex AI, GKE Data-analytics and AI-first positioning
Alibaba Cloud ~4–6% Elastic Compute, PAI, DAMO Academy Asia-Pacific and e-commerce cloud anchor
Salesforce ~3–5% Sales Cloud, Service Cloud, MuleSoft CRM-native SaaS leader
IBM Cloud ~2–4% Watson, Red Hat OpenShift, hybrid cloud Hybrid and regulated-industry focus
Oracle Cloud ~2–4% OCI, Autonomous Database, Fusion Apps Database-centric migration path
SAP ~2–3% S/4HANA Cloud, BTP ERP-to-cloud migration dominance
Tencent Cloud ~1–3% CVM, TDSQL, WeChat ecosystem China social-commerce integration
Huawei Cloud ~1–2% FusionCloud, ModelArts Emerging-market telecom partnerships

Recent News & Developments

  • Microsoft Azure (January 2025): Announced USD 80 billion in datacenter capital expenditure for fiscal year 2025, with priority investment in AI-optimized regions across the U.S., Japan, and Sweden [14].
  • February 2025: IBM to acquire HashiCorp for USD 35 per share, bundling automation tooling with IBM Cloud offerings.
  • February 2025: NetApp and AWS signed a Strategic Collaboration Agreement to accelerate generative-AI data services on Amazon FSx for NetApp ONTAP.
  • January 2025: Panasonic adopted Siemens Teamcenter X to streamline cloud-based product lifecycle management.
  • December 2024: Red Hat and AWS expanded hybrid-cloud collaboration to streamline VM migration and AI workload deployment.


Public Cloud Market Report Scope

Parameter Detail
Market Scope Global Public Cloud Market — SaaS, PaaS, IaaS across all end-user verticals
Study Period 2021–2035
CAGR 16.2% (2026–2035)
Market Size (2025) USD 0.78 Trillion
Market Size (2035) USD 3.51 Trillion
Fastest Growing Segment PaaS (by deployment); Manufacturing (by end user); Asia-Pacific (by region)
Companies Profiled 10 major players including AWS, Microsoft Azure, Google Cloud
Valuation Currency USD


FAQs

How should enterprises evaluate total cost of ownership when comparing public cloud providers?
Procurement teams should model three-year blended costs including compute, egress fees, support tiers, and committed-use discounts rather than list-price comparisons. Third-party FinOps platforms can benchmark actual spend against peer cohorts [18].
What role does confidential computing play in regulated-industry cloud adoption?
Confidential computing encrypts data during processing inside hardware-based trusted execution environments, satisfying regulators who previously blocked cloud migration for sensitive workloads. Adoption is growing fastest in banking and defense [16].
How are hyperscalers differentiating their AI model marketplaces?
AWS Bedrock, Azure AI Studio, and Google Vertex AI each offer curated foundation-model catalogs with provider-specific fine-tuning pipelines. Selection depends on existing ecosystem lock-in and preferred model vendors [20].
What contractual safeguards mitigate cloud vendor lock-in risk?
Enterprises should negotiate data-portability clauses, multi-format export APIs, and capped egress fees at contract signing. The EU Data Act now requires providers to support standardized switching within 30 days [3].
How does carbon-aware workload scheduling work in practice?
Cloud platforms route non-time-sensitive jobs to regions with the lowest real-time carbon intensity, using grid-emission feeds. Microsoft and Google offer native carbon-optimization dashboards [10].
What compliance certifications should buyers verify before procurement?
Minimum baselines include SOC 2 Type II, ISO 27001, ISO 27017, and region-specific certifications such as FedRAMP (U.S.), C5 (Germany), or IRAP (Australia). Verify certification scope covers the specific services, not just the provider [2].
How will post-quantum cryptography standards affect cloud migration timelines?
NIST's 2024 PQC standards require organizations to inventory crypto-dependencies and migrate certificates before quantum-capable systems emerge. Cloud providers offering managed PQC key services will shorten transition timelines [11].    
Author
Author
Author Profile
Aarti Dhapte LinkedIn
AVP - Research
A consulting professional focused on helping businesses navigate complex markets through structured research and strategic insights. I partner with clients to solve high-impact business problems across market entry strategy, competitive intelligence, and opportunity assessment. Over the course of my experience, I have led and contributed to 100+ market research and consulting engagements, delivering insights across multiple industries and geographies, and supporting strategic decisions linked to $500M+ market opportunities. My core expertise lies in building robust market sizing, forecasting, and commercial models (top-down and bottom-up), alongside deep-dive competitive and industry analysis. I have played a key role in shaping go-to-market strategies, investment cases, and growth roadmaps, enabling clients to make confident, data-backed decisions in dynamic markets.
Co-Author
Co-Author Profile
Shubham Munde LinkedIn
Team Lead - Research
Shubham brings over 7 years of expertise in Market Intelligence and Strategic Consulting, with a strong focus on the Automotive, Aerospace, and Defense sectors. Backed by a solid foundation in semiconductors, electronics, and software, he has successfully delivered high-impact syndicated and custom research on a global scale. His core strengths include market sizing, forecasting, competitive intelligence, consumer insights, and supply chain mapping. Widely recognized for developing scalable growth strategies, Shubham empowers clients to navigate complex markets and achieve a lasting competitive edge. Trusted by start-ups and Fortune 500 companies alike, he consistently converts challenges into strategic opportunities that drive sustainable growth.

Research Approach


Secondary Research

The secondary research process involved comprehensive analysis of technology standards databases, government cloud initiatives, peer-reviewed IT journals, industry publications, and authoritative technology organizations. Key sources included the National Institute of Standards and Technology (NIST) Special Publications on cloud computing and cybersecurity frameworks, the General Services Administration (GSA) FedRAMP Marketplace and Cloud Information Center, the Department of Homeland Security (DHS) cybersecurity guidelines, the Department of Defense (DoD) Cloud Computing Security Requirements Guide (CC SRG), the European Union Agency for Cybersecurity (ENISA) cloud security reports, Eurostat Digital Economy and Society statistics, the International Organization for Standardization/International Electrotechnical Commission (ISO/IEC) JTC 1/SC 38 cloud computing standards, the Uptime Institute Tier Certification database for data center infrastructure, the ITU-T (International Telecommunication Union) cloud computing focus group, the Cloud Security Alliance (CSA) STAR Registry and research publications, the Cloud Native Computing Foundation (CNCF) annual surveys, Gartner cloud infrastructure and platform services reports, IDC worldwide semiannual public cloud services trackers, Forrester cloud surveys, Flexera State of the Cloud reports, McKinsey Global Institute cloud adoption studies, and OECD digital economy outlooks. These sources were used to collect cloud adoption statistics, security compliance data, infrastructure capacity metrics, service model deployment trends, and competitive landscape analysis for Infrastructure as a Service (IaaS), Platform as a Service (PaaS), Software as a Service (SaaS), and Function as a Service (FaaS) across enterprise segments.


Primary Research

To gather both qualitative and quantitative insights, supply-side and demand-side stakeholders were interviewed during the primary research phase. CEOs, CTOs, VPs of cloud infrastructure, cloud architects, and heads of cloud strategy from hyperscalers, cloud infrastructure suppliers, and public cloud service providers were examples of supply-side sources. CIOs, IT directors, cloud procurement managers, and infrastructure leads from IT and telecommunications firms, banks and financial services organizations, manufacturing firms, healthcare organizations, government agencies, and retail corporations were among the demand-side sources. In addition to verifying multi-cloud and hybrid cloud adoption timelines and validating service model segmentation, primary research also collected information on pricing model preferences, workload migration trends, security compliance needs, and vendor lock-in issues.

Primary Respondent Breakdown:

By Designation: C-level Primaries (31%), Director Level (34%), Others (35%)

By Region: North America (32%), Europe (25%), Asia-Pacific (35%), Rest of World (8%)


Market Size Estimation

Global market valuation was derived through revenue mapping and cloud consumption analysis. The methodology included:

Identification of 60+ key cloud service providers across North America, Europe, Asia-Pacific, Latin America, and Middle East & Africa

Service mapping across Infrastructure as a Service (IaaS), Platform as a Service (PaaS), Software as a Service (SaaS), and Function as a Service (FaaS) segments

Analysis of reported and modeled annual revenues specific to public cloud service portfolios

Coverage of hyperscale providers, tier-2 regional cloud providers, and specialized cloud vendors representing 75-80% of global market share in 2024

Extrapolation using bottom-up (cloud consumption metrics × pricing by region and service model) and top-down (provider revenue validation and enterprise IT spend analysis) approaches to derive segment-specific valuations

Validation against third-party cloud spend monitoring data from enterprise IT budget surveys and cloud management platform analytics

FedRAMP (Federal Risk and Authorization Management Program) – GSA authorization database for federal cloud compliance

NIST SP 800-145 – The NIST Definition of Cloud Computing

DoD CC SRG – Department of Defense Cloud Computing Security Requirements Guide

Eurostat – Cloud computing statistics on enterprise usage by service model and industry

ENISA – European Union Agency for Cybersecurity cloud security certification frameworks

ISO/IEC JTC 1/SC 38 – International standards for cloud computing and distributed platforms

Uptime Institute – Data center Tier Certification and industry research reports

Download Free Sample

Kindly complete the form below to receive a free sample of this Report

Download PDF ×

We do not share your information with anyone. However, we may send you emails based on your report interest from time to time. You may contact us at any time to opt-out.

















