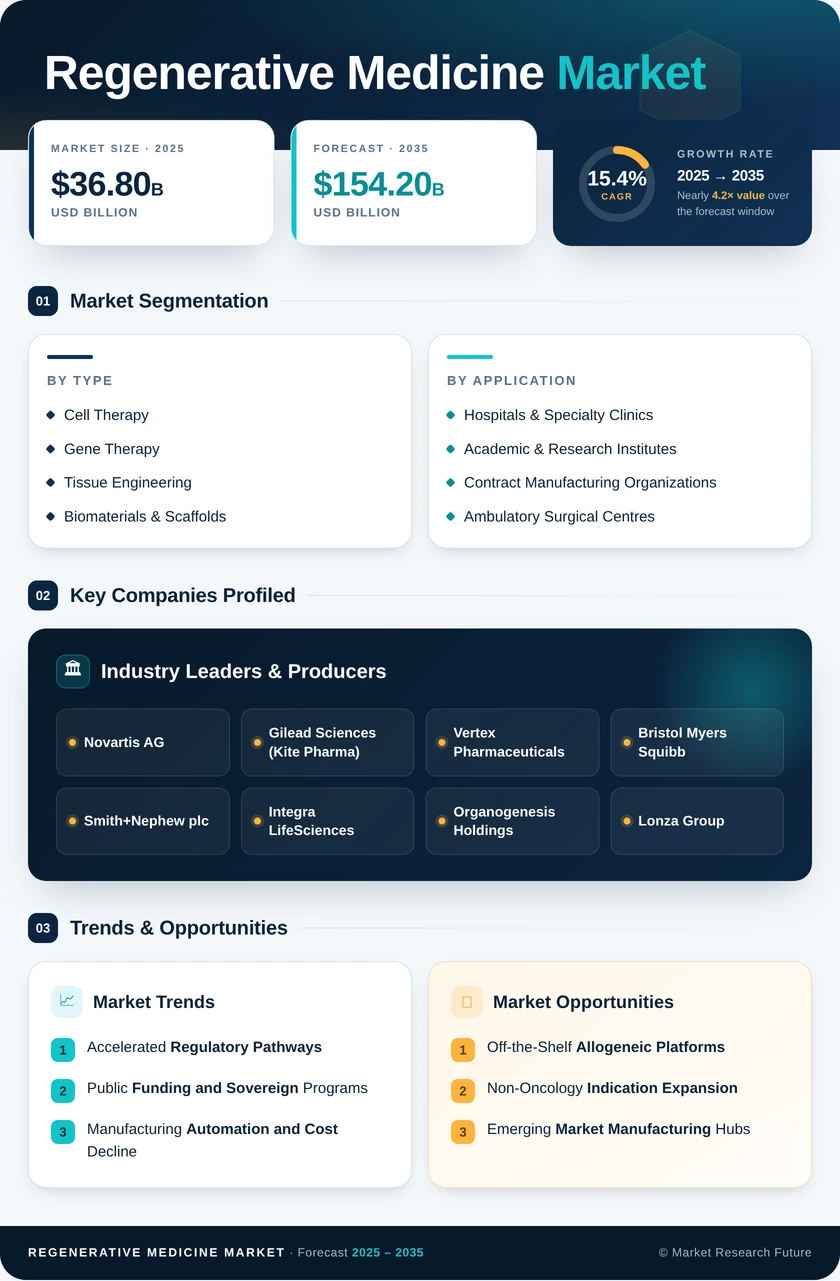
Regenerative Medicine Market (2026 - 2035)

Regenerative Medicine Market Research Report: Size, Share, Trend Analysis By Applications (Orthopedics, Neurology, Cardiology, Dermatology, Oncology), By Product Type (Cell Therapy, Gene Therapy, Tissue Engineering, Stem Cell Therapy), By End Users (Hospitals, Research Laboratories, Pharmaceutical Companies, Academic Institutions), By Therapeutic Area (Musculoskeletal Disorders, Cognitive Disorders, Cardiovascular Diseases, Chronic Wounds) and By Regional (North America, Europe, South America, Asia Pacific, Middle East and Africa) - Growth Outlook & Industry Forecast 2025 To 2035

Forecast Period
2026-2035
CAGR
15.4%
2025 Market Size
USD 36.8 Billion
2035 Market Size
USD 154.2 Billion
Healthcare ● Updated August 2026 Report ID: MRFR/HC/1649-CR | Pages: 200 | Author: Satyendra Maurya, Rahul Gotadki
  1. 1 Market Summary |
    1. 1.1 Study Assumptions & Market Definition |
    2. 1.2 Scope of the Study |
    3. 1.3 Research Methodology
  2. 2 Key Report Takeaways |
    1. 2.1 By Technology |
    2. 2.2 By Sector |
    3. 2.3 By Geography
  3. 3 Market Size & Forecast (2021–2035) |
    1. 3.1 Historical Market Size (2021–2025) |
    2. 3.2 Current & Forecast Market Size (2026–2035) |
    3. 3.3 Year-over-Year Growth Analysis
  4. 4 Driver Impact Analysis |
    1. 4.1 Accelerated Regulatory Pathways |
    2. 4.2 Public Funding and Sovereign Programs |
    3. 4.3 Manufacturing Automation and Cost Decline
  5. 5 Restraints Impact Analysis |
    1. 5.1 Therapy Pricing and Payer Resistance |
    2. 5.2 Manufacturing Complexity and Batch Failure |
    3. 5.3 Specialized Site Infrastructure Gaps
  6. 6 Opportunities |
    1. 6.1 Off-the-Shelf Allogeneic Platforms |
    2. 6.2 Non-Oncology Indication Expansion |
    3. 6.3 Emerging Market Manufacturing Hubs |
    4. 6.4 Outcomes-Based Contracting and Data Monetization |
    5. 6.5 Contract Development and Manufacturing Services
  7. 7 Regional Market Share & Country-Level Analysis |
    1. 7.1 North America | |
      1. 7.1.1 United States | |
      2. 7.1.2 Canada | |
      3. 7.1.3 Mexico |
    2. 7.2 Europe | |
      1. 7.2.1 Germany | |
      2. 7.2.2 United Kingdom | |
      3. 7.2.3 France | |
      4. 7.2.4 Switzerland | |
      5. 7.2.5 Rest of Europe |
    3. 7.3 Asia-Pacific | |
      1. 7.3.1 China | |
      2. 7.3.2 Japan | |
      3. 7.3.3 India | |
      4. 7.3.4 South Korea | |
      5. 7.3.5 Australia | |
      6. 7.3.6 Rest of Asia-Pacific |
    4. 7.4 South America | |
      1. 7.4.1 Brazil | |
      2. 7.4.2 Argentina | |
      3. 7.4.3 Rest of South America |
    5. 7.5 Middle East & Africa | |
      1. 7.5.1 Saudi Arabia | |
      2. 7.5.2 United Arab Emirates | |
      3. 7.5.3 Israel | |
      4. 7.5.4 South Africa | |
      5. 7.5.5 Rest of Middle East & Africa
  8. 8 Future Outlook (2026–2035) |
    1. 8.1 Automation and Machine Learning in Manufacturing |
    2. 8.2 Platform Economics and Modular Approval |
    3. 8.3 Payment Architecture Redesign |
    4. 8.4 Global Access and Manufacturing Decentralization
  9. 9 Market Segmentation Analysis |
    1. 9.1 By Therapy Type | |
      1. 9.1.1 Cell Therapy | |
      2. 9.1.2 Gene Therapy | |
      3. 9.1.3 Tissue Engineering | |
      4. 9.1.4 Biomaterials & Scaffolds |
    2. 9.2 By Application | |
      1. 9.2.1 Oncology | |
      2. 9.2.2 Musculoskeletal & Orthopedics | |
      3. 9.2.3 Dermatology & Wound Care | |
      4. 9.2.4 Ophthalmology | |
      5. 9.2.5 Cardiovascular | |
      6. 9.2.6 Neurology & Others |
    3. 9.3 By End User | |
      1. 9.3.1 Hospitals & Specialty Clinics | |
      2. 9.3.2 Academic & Research Institutes | |
      3. 9.3.3 Contract Manufacturing Organizations | |
      4. 9.3.4 Ambulatory Surgical Centres
  10. 10 Competitive Landscape |
    1. 10.1 Market Concentration Analysis |
    2. 10.2 Competitive Benchmarking Matrix |
    3. 10.3 Company Profiles
  11. 11 Recent News & Developments
  12. 12 Report Scope & Methodology
  13. 13 Detailed Sources & Citations
  14. 14 Frequently Asked Questions
  15. 15 LIST OF TABLES |
  16. TABLE 1 Global Regenerative Medicine Market Size & Forecast, by Revenue (USD Billion), 2021–2035 |
  17. TABLE 2 Global Regenerative Medicine Market – Year-over-Year Growth Analysis, 2021–2035 |
  18. TABLE 3 Driver Impact Analysis – Global Regenerative Medicine Market, 2026–2035 |
  19. TABLE 4 Restraint Impact Analysis – Global Regenerative Medicine Market, 2026–2035 |
  20. TABLE 5 Global Regenerative Medicine Market Size, by Region, 2021–2035 (USD Billion) |
  21. TABLE 6 North America Regenerative Medicine Market Size, by Country, 2021–2035 (USD Billion) |
  22. TABLE 7 Europe Regenerative Medicine Market Size, by Country, 2021–2035 (USD Billion) |
  23. TABLE 8 Asia-Pacific Regenerative Medicine Market Size, by Country, 2021–2035 (USD Billion) |
  24. TABLE 9 South America Regenerative Medicine Market Size, by Country, 2021–2035 (USD Billion) |
  25. TABLE 10 Middle East & Africa Regenerative Medicine Market Size, by Country, 2021–2035 (USD Billion) |
  26. TABLE 11 Global Regenerative Medicine Market Size, by Therapy Type, 2021–2035 (USD Billion) |
  27. TABLE 12 Global Regenerative Medicine Market Size, by Application, 2021–2035 (USD Billion) |
  28. TABLE 13 Global Regenerative Medicine Market Size, by End User, 2021–2035 (USD Billion) |
  29. TABLE 14 North America Regenerative Medicine Market Size, by Therapy Type, 2021–2035 (USD Billion) |
  30. TABLE 15 North America Regenerative Medicine Market Size, by Application, 2021–2035 (USD Billion) |
  31. TABLE 16 Europe Regenerative Medicine Market Size, by Therapy Type, 2021–2035 (USD Billion) |
  32. TABLE 17 Europe Regenerative Medicine Market Size, by Application, 2021–2035 (USD Billion) |
  33. TABLE 18 Asia-Pacific Regenerative Medicine Market Size, by Therapy Type, 2021–2035 (USD Billion) |
  34. TABLE 19 Asia-Pacific Regenerative Medicine Market Size, by Application, 2021–2035 (USD Billion) |
  35. TABLE 20 South America Regenerative Medicine Market Size, by Therapy Type, 2021–2035 (USD Billion) |
  36. TABLE 21 Middle East & Africa Regenerative Medicine Market Size, by Therapy Type, 2021–2035 (USD Billion) |
  37. TABLE 22 United States Regenerative Medicine Market Size, by Application, 2021–2035 (USD Billion) |
  38. TABLE 23 Japan Regenerative Medicine Market Size, by Therapy Type, 2021–2035 (USD Billion) |
  39. TABLE 24 China Regenerative Medicine Market Size, by Application, 2021–2035 (USD Billion) |
  40. TABLE 25 Competitive Benchmarking Matrix – Global Regenerative Medicine Market, 2026 |
  41. TABLE 26 Company Profiles – Key Players, Global Regenerative Medicine Market |
  42. TABLE 27 Recent Developments & Strategic Announcements, 2023–2025 |
  43. TABLE 28 Report Scope & Methodology Summary |
  44. TABLE 29 Detailed Sources & Citations Index
  45. 16 LIST OF FIGURES |
  46. FIGURE 1 Global Regenerative Medicine Market – Market Dynamics Overview |
  47. FIGURE 2 Industry Value Chain Analysis – Regenerative Medicine |
  48. FIGURE 3 Porter's Five Forces Analysis – Regenerative Medicine |
  49. FIGURE 4 Global Regenerative Medicine Market Size Trend, 2021–2035 (USD Billion) |
  50. FIGURE 5 Year-over-Year Growth Trajectory, 2022–2035 (%) |
  51. FIGURE 6 Market Share by Therapy Type, 2025 vs 2035 (%) |
  52. FIGURE 7 Market Share by Application, 2025 (%) |
  53. FIGURE 8 Market Share by End User, 2025 (%) |
  54. FIGURE 9 Regional Market Share Distribution, 2025 (%) |
  55. FIGURE 10 Regional CAGR Comparison, 2026–2035 (%) |
  56. FIGURE 11 North America Country-Level Share Breakdown, 2025 (%) |
  57. FIGURE 12 Asia-Pacific Country-Level Share Breakdown, 2025 (%) |
  58. FIGURE 13 Competitive Landscape – Estimated Revenue Share Positioning, 2026 |
  59. FIGURE 14 Strategic Positioning Matrix – Key Players |
  60. FIGURE 15 Driver vs Restraint Impact Weighting Chart
Share::
Request Free Sample

Segmentation Quick Reference

DimensionSub-SegmentsDominant SegmentFastest Growing Segment
By Therapy TypeCell Therapy; Gene Therapy; Tissue Engineering; Biomaterials & ScaffoldsCell TherapyGene Therapy
By ApplicationOncology; Musculoskeletal & Orthopedics; Dermatology & Wound Care; Ophthalmology; Cardiovascular; Neurology & OthersOncologyOphthalmology
By End UserHospitals & Specialty Clinics; Academic & Research Institutes; Contract Manufacturing Organizations; Ambulatory Surgical CentresHospitals & Specialty ClinicsContract Manufacturing Organizations
By RegionNorth America; Europe; Asia-Pacific; South America; Middle East & AfricaNorth AmericaAsia-Pacific


Market Segmentation Overview

By Therapy Type

Sub-SegmentKey Trend
Cell TherapyMovement from late-line to earlier-line oncology treatment protocols
Gene TherapyEditing-based approaches displacing viral vector-only platforms
Tissue EngineeringConvergence with surgical device channels and 3D bioprinting
Biomaterials & ScaffoldsBioresorbable and growth-factor-loaded constructs gaining surgeon preference.


Therapy type remains the most commercially meaningful cut of the data because each category faces a distinct manufacturing and reimbursement reality. Cell therapy holds the revenue lead on approved oncology franchises, while gene therapy's growth rate reflects a pipeline converting faster than any other modality.

By Application

Sub-SegmentKey Trend
OncologySolid-tumor entries broadening the addressable population beyond blood cancers
Musculoskeletal & OrthopedicsOffice-based orthobiologic procedures normalizing regenerative care
Dermatology & Wound CareBioengineered skin substitutes displacing conventional grafting
OphthalmologyClean efficacy endpoints accelerating regulatory review.
CardiovascularHeart failure programmes advancing toward pivotal readouts.
Neurology & OthersEarly-stage momentum in neurodegenerative and spinal repair


Application mix explains the gap between revenue concentration and patient reach. Oncology dominates dollars, but musculoskeletal and wound care applications treat far larger populations and shape clinician familiarity across general practice.

By End User

Sub-SegmentKey Trend
Hospitals & Specialty ClinicsAccreditation requirements sustaining treatment concentration
Academic & Research InstitutesInvestigator-initiated trials feeding commercial pipelines
Contract Manufacturing OrganizationsCapacity reservations becoming a competitive differentiator.
Ambulatory Surgical CentresOutpatient migration for lower-acuity regenerative procedures


End-user structure will loosen as point-of-care manufacturing matures. Hospitals hold the delivery monopoly today, but the fastest value creation sits with contract manufacturers who monetize scarcity regardless of which clinical programme succeeds.




Share::
Request Free Sample
Download PDF ×

We do not share your information with anyone. However, we may send you emails based on your report interest from time to time. You may contact us at any time to opt-out.