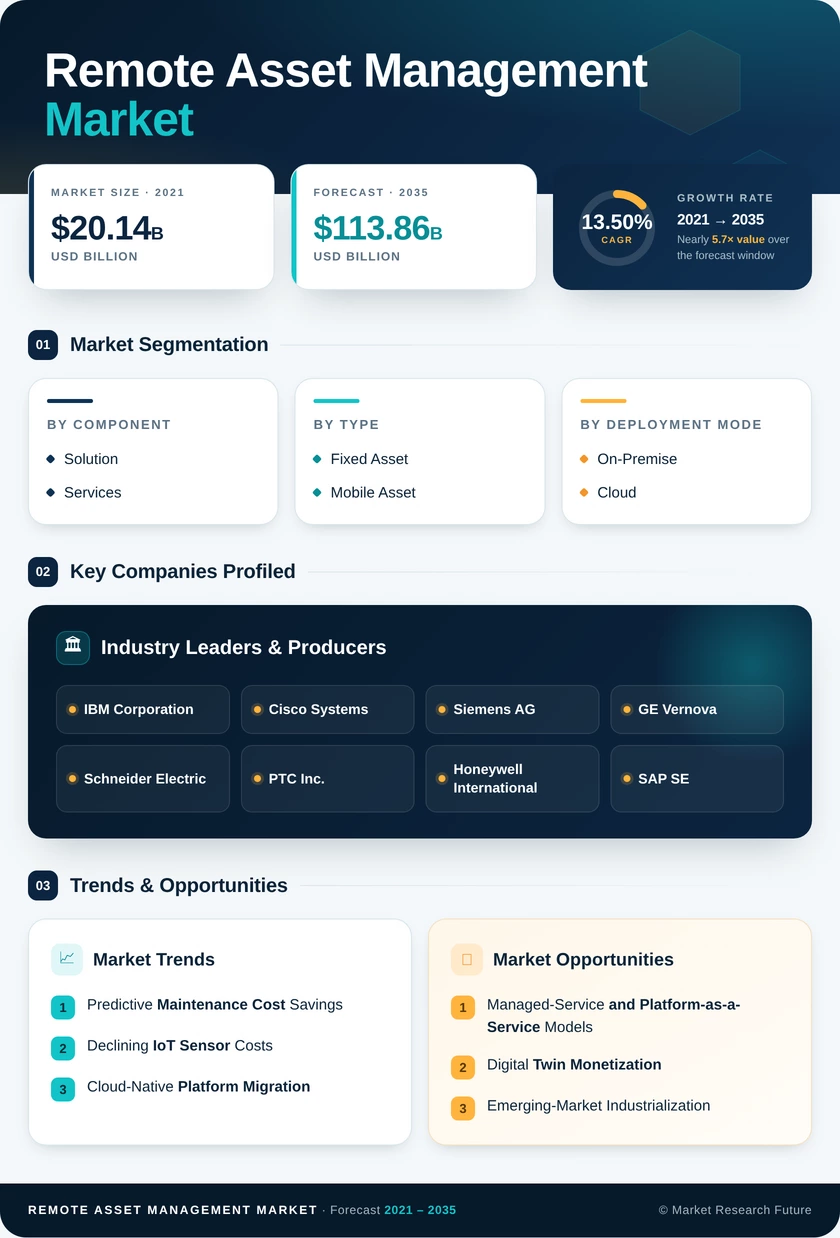
Remote Asset Management Market (2026 - 2035)

ID: MRFR/ICT/1842-HCR
100 Pages
Apoorva Priyadarshi
Last Updated: July 20, 2026
Remote Asset Management Market Research Report: Information by Solutions (Predictive Maintenance, Analytics, Asset Condition Monitoring & Performance Management), by Application (Automation, Healthcare and Wellness, Retail, Utilities, Smart Grids, and Production Monitoring), And By Region (North America, Europe, Asia-Pacific, And Rest Of The World) –Market Forecast Till 2035.
Remote Asset Management Market
Market Size
Forecast Period2026-2035
CAGR (2026-2035)13.50%
2025 Market SizeUSD 32.10 Billion
2035 Market SizeUSD 113.86 Billion
Key Players
IBM Corporation
Cisco Systems
Siemens AG
GE Vernova
Schneider Electric
PTC Inc.
Opportunities
  • Managed-Service and Platform-as-a-Service Models
  • Digital Twin Monetization
  • Emerging-Market Industrialization
  1. 1 Market Overview |
    1. 1.1 Study Assumptions & Market Definition |
    2. 1.2 Scope of the Study |
    3. 1.3 Research Methodology
  2. 2 Market Summary & Key Takeaways
  3. 3 Market Dynamics |
    1. 3.1 Market Drivers Analysis | |
      1. 3.1.1 Predictive Maintenance Cost Savings | |
      2. 3.1.2 Declining IoT Sensor Costs | |
      3. 3.1.3 Cloud-Native Platform Migration | |
      4. 3.1.4 5G and LPWAN Network Rollouts | |
      5. 3.1.5 Regulatory Compliance Mandates | |
      6. 3.1.6 Digital Twin and AI Convergence | |
      7. 3.1.7 Sustainability and ESG Reporting |
    2. 3.2 Market Restraints Analysis | |
      1. 3.2.1 Cybersecurity and Data-Breach Risk | |
      2. 3.2.2 Legacy System Integration Complexity | |
      3. 3.2.3 High Initial Deployment Costs for SMEs | |
      4. 3.2.4 Skilled Workforce Shortages | |
      5. 3.2.5 Data Sovereignty and Regulatory Fragmentation |
    3. 3.3 Market Opportunity Analysis | |
      1. 3.3.1 Managed-Service and Platform-as-a-Service Models | |
      2. 3.3.2 Digital Twin Monetization | |
      3. 3.3.3 Emerging-Market Industrialization | |
      4. 3.3.4 ESG Compliance and Carbon Accounting | |
      5. 3.3.5 Autonomous Operations and Edge AI |
    4. 3.4 Industry Value Chain Analysis |
    5. 3.5 Porter's Five Forces Analysis
  4. 4 Remote Asset Management Market Size & Forecast (2021–2035) |
    1. 4.1 Historical Market Size (2021–2025) |
    2. 4.2 Current & Forecast Market Size (2026–2035) |
    3. 4.3 Market Size by Revenue (USD Billion) |
    4. 4.4 Year-over-Year Growth Analysis
  5. 5 Segmentation Analysis |
    1. 5.1 By Component | |
      1. 5.1.1 Solution | |
      2. 5.1.2 Services |
    2. 5.2 By Type | |
      1. 5.2.1 Fixed Asset | |
      2. 5.2.2 Mobile Asset |
    3. 5.3 By Deployment Mode | |
      1. 5.3.1 On-Premise | |
      2. 5.3.2 Cloud |
    4. 5.4 By End-User | |
      1. 5.4.1 Manufacturing | |
      2. 5.4.2 Healthcare | |
      3. 5.4.3 Retail | |
      4. 5.4.4 Energy and Utilities | |
      5. 5.4.5 Transportation and Logistics | |
      6. 5.4.6 Other End-Users
  6. 6 Regional Analysis |
    1. 6.1 North America | |
      1. 6.1.1 United States | |
      2. 6.1.2 Canada | |
      3. 6.1.3 Mexico |
    2. 6.2 Europe | |
      1. 6.2.1 Germany | |
      2. 6.2.2 United Kingdom | |
      3. 6.2.3 France | |
      4. 6.2.4 Italy | |
      5. 6.2.5 Spain | |
      6. 6.2.6 Nordic Countries | |
      7. 6.2.7 Russia | |
      8. 6.2.8 Rest of Europe |
    3. 6.3 Asia-Pacific | |
      1. 6.3.1 China | |
      2. 6.3.2 India | |
      3. 6.3.3 Japan | |
      4. 6.3.4 South Korea | |
      5. 6.3.5 ASEAN | |
      6. 6.3.6 Rest of Asia-Pacific |
    4. 6.4 South America | |
      1. 6.4.1 Brazil | |
      2. 6.4.2 Argentina | |
      3. 6.4.3 Rest of South America |
    5. 6.5 Middle East & Africa | |
      1. 6.5.1 Saudi Arabia | |
      2. 6.5.2 UAE | |
      3. 6.5.3 South Africa | |
      4. 6.5.4 Egypt | |
      5. 6.5.5 Rest of MEA
  7. 7 Competitive Landscape |
    1. 7.1 Market Share Analysis (2025) |
    2. 7.2 Competitive Benchmarking Matrix |
    3. 7.3 Company Profiles | |
      1. 7.3.1 IBM Corporation | |
      2. 7.3.2 Cisco Systems | |
      3. 7.3.3 Siemens AG | |
      4. 7.3.4 GE Vernova | |
      5. 7.3.5 Schneider Electric | |
      6. 7.3.6 PTC Inc. | |
      7. 7.3.7 Honeywell International | |
      8. 7.3.8 SAP SE | |
      9. 7.3.9 Rockwell Automation | |
      10. 7.3.10 Hitachi Ltd.
  8. 8 Future Outlook & Strategic Recommendations (2026–2035) |
    1. 8.1 AI-Driven Autonomous Asset Operations |
    2. 8.2 Platform Economics and Ecosystem Consolidation |
    3. 8.3 Sustainability-Linked Asset Lifecycle Management |
    4. 8.4 Convergence of Physical and Digital Infrastructure
  9. 9 Recent Developments & News
  10. 10 Frequently Asked Questions (FAQs)
  11. 11 Report Scope & Methodology |
    1. 11.1 Study Period & Base Year |
    2. 11.2 Data Sources & Citations |
    3. 11.3 Abbreviations
  12. 12 LIST OF TABLES |
  13. TABLE 1 Remote Asset Management Market Size & Forecast, by Revenue (USD Billion), 2021–2035 |
  14. TABLE 2 Remote Asset Management Market – Year-over-Year Growth Analysis, 2021–2035 |
  15. TABLE 3 Remote Asset Management Market – Driver Impact Analysis |
  16. TABLE 4 Remote Asset Management Market – Restraint Impact Analysis |
  17. TABLE 5 Remote Asset Management Market Size, by Component, 2021–2035 (USD Billion) |
  18. TABLE 6 Remote Asset Management Market Size, by Type, 2021–2035 (USD Billion) |
  19. TABLE 7 Remote Asset Management Market Size, by Deployment Mode, 2021–2035 (USD Billion) |
  20. TABLE 8 Remote Asset Management Market Size, by End-User, 2021–2035 (USD Billion) |
  21. TABLE 9 Remote Asset Management Market Size, by Region, 2021–2035 (USD Billion) |
  22. TABLE 10 North America Remote Asset Management Market Size, by Country, 2021–2035 (USD Billion) |
  23. TABLE 11 Europe Remote Asset Management Market Size, by Country, 2021–2035 (USD Billion) |
  24. TABLE 12 Asia-Pacific Remote Asset Management Market Size, by Country, 2021–2035 (USD Billion) |
  25. TABLE 13 South America Remote Asset Management Market Size, by Country, 2021–2035 (USD Billion) |
  26. TABLE 14 Middle East & Africa Remote Asset Management Market Size, by Country, 2021–2035 (USD Billion) |
  27. TABLE 15 Competitive Benchmarking Matrix – Remote Asset Management Market, 2025 |
  28. TABLE 16 Company Profiles – Key Players, Remote Asset Management Market |
  29. TABLE 17 Recent Developments & Strategic Announcements, 2023–2025 |
  30. TABLE 18 North America Remote Asset Management Market Size, by Component, 2021–2035 (USD Billion) |
  31. TABLE 19 North America Remote Asset Management Market Size, by Type, 2021–2035 (USD Billion) |
  32. TABLE 20 North America Remote Asset Management Market Size, by Deployment Mode, 2021–2035 (USD Billion) |
  33. TABLE 21 North America Remote Asset Management Market Size, by End-User, 2021–2035 (USD Billion) |
  34. TABLE 22 Europe Remote Asset Management Market Size, by Component, 2021–2035 (USD Billion) |
  35. TABLE 23 Europe Remote Asset Management Market Size, by Type, 2021–2035 (USD Billion) |
  36. TABLE 24 Europe Remote Asset Management Market Size, by Deployment Mode, 2021–2035 (USD Billion) |
  37. TABLE 25 Europe Remote Asset Management Market Size, by End-User, 2021–2035 (USD Billion) |
  38. TABLE 26 Asia-Pacific Remote Asset Management Market Size, by Component, 2021–2035 (USD Billion) |
  39. TABLE 27 Asia-Pacific Remote Asset Management Market Size, by Type, 2021–2035 (USD Billion) |
  40. TABLE 28 Asia-Pacific Remote Asset Management Market Size, by Deployment Mode, 2021–2035 (USD Billion) |
  41. TABLE 29 Asia-Pacific Remote Asset Management Market Size, by End-User, 2021–2035 (USD Billion) |
  42. TABLE 30 South America Remote Asset Management Market Size, by Component, 2021–2035 (USD Billion) |
  43. TABLE 31 South America Remote Asset Management Market Size, by Type, 2021–2035 (USD Billion) |
  44. TABLE 32 South America Remote Asset Management Market Size, by Deployment Mode, 2021–2035 (USD Billion) |
  45. TABLE 33 South America Remote Asset Management Market Size, by End-User, 2021–2035 (USD Billion) |
  46. TABLE 34 Middle East & Africa Remote Asset Management Market Size, by Component, 2021–2035 (USD Billion) |
  47. TABLE 35 Middle East & Africa Remote Asset Management Market Size, by Type, 2021–2035 (USD Billion) |
  48. TABLE 36 Middle East & Africa Remote Asset Management Market Size, by Deployment Mode, 2021–2035 (USD Billion) |
  49. TABLE 37 Middle East & Africa Remote Asset Management Market Size, by End-User, 2021–2035 (USD Billion) |
  50. TABLE 38 Report Scope & Methodology Summary |
  51. TABLE 39 Detailed Sources and Citations
  52. 13 LIST OF FIGURES |
  53. FIGURE 1 Remote Asset Management Market Dynamics (Drivers, Restraints, Opportunities) |
  54. FIGURE 2 Industry Value Chain Analysis |
  55. FIGURE 3 Porter's Five Forces Analysis |
  56. FIGURE 4 Remote Asset Management Market Size Trend (USD Billion), 2021–2035 |
  57. FIGURE 5 Remote Asset Management Market Share, by Component (2025) |
  58. FIGURE 6 Remote Asset Management Market Share, by Type (2025) |
  59. FIGURE 7 Remote Asset Management Market Share, by Deployment Mode (2025) |
  60. FIGURE 8 Remote Asset Management Market Share, by End-User (2025) |
  61. FIGURE 9 Remote Asset Management Market Share, by Region (2025) |
  62. FIGURE 10 North America Remote Asset Management Market – Country Share (2025) |
  63. FIGURE 11 Europe Remote Asset Management Market – Country Share (2025) |
  64. FIGURE 12 Asia-Pacific Remote Asset Management Market – Country Share (2025) |
  65. FIGURE 13 South America Remote Asset Management Market – Country Share (2025) |
  66. FIGURE 14 Middle East & Africa Remote Asset Management Market – Country Share (2025) |
  67. FIGURE 15 Competitive Landscape – Market Share Analysis (2025) |
  68. FIGURE 16 Competitive Benchmarking Radar Chart

Segmentation Quick Reference

DimensionSub-SegmentsDominant SegmentFastest Growing Segment
By ComponentSolution, ServicesSolutionServices
By TypeFixed Asset, Mobile AssetFixed AssetMobile Asset
By Deployment ModeOn-Premise, CloudOn-PremiseCloud
By End-UserManufacturing, Healthcare, Retail, Energy and Utilities, Transportation and Logistics, Other End-UsersManufacturingTransportation and Logistics
By GeographyNorth America, Europe, Asia-Pacific, South America, Middle East & AfricaNorth AmericaAsia-Pacific


Market Segmentation Overview

By Component

Sub-SegmentKey Trend
SolutionShift toward unified analytics suites integrating APM, predictive maintenance, and digital twin modules
ServicesRising demand for managed services and consulting as enterprises outsource monitoring operations


The Component dimension reflects the core commercial structure of the Remote Asset Management Market. Solution revenue is driven by recurring platform licensing, while Services growth signals a maturing market where implementation complexity favors specialist partners.

By Type

Sub-SegmentKey Trend
Fixed AssetSensor densification across power plants, refineries, and manufacturing production lines
Mobile AssetGPS-telematics convergence with asset health monitoring in fleet and logistics operations


Fixed and Mobile asset types address fundamentally different operational requirements. Fixed assets demand high-frequency vibration and thermal monitoring, while mobile assets prioritize location tracking, geofencing, and usage-based maintenance scheduling.

By Deployment Mode

Sub-SegmentKey Trend
On-PremiseSustained adoption in defense, nuclear, and regulated financial services environments
CloudRapid migration driven by hyperscaler industrial IoT offerings and SaaS pricing models


Deployment mode selection is increasingly determined by regulatory posture. Industries with strict data residency mandates maintain on-premise installations, while cost-sensitive and multi-site operators gravitate toward cloud-native architectures.

By End-User

Sub-SegmentKey Trend
ManufacturingOEE optimization and predictive quality management
HealthcareMedical device uptime, cold chain integrity, and hospital facility management
RetailRefrigeration monitoring, HVAC asset management, and loss prevention
Energy and UtilitiesGrid asset monitoring, pipeline integrity, and renewable energy plant management
Transportation and LogisticsFleet telematics, container tracking, and rail infrastructure monitoring
Other End-UsersAgriculture precision monitoring, construction equipment tracking, public infrastructure


The End-User dimension captures the breadth of applications for remote asset management across the industrial economy. Manufacturing and Energy and Utilities together represent over half of total market revenue, while Transportation and Logistics is the fastest-expanding vertical due to e-commerce supply chain requirements.


 

Download PDF ×

We do not share your information with anyone. However, we may send you emails based on your report interest from time to time. You may contact us at any time to opt-out.