Remote Patient Monitoring Market (2026 - 2035)

Remote Patient Monitoring Market Research Report: Size, Share, Trend Analysis By Types (Devices and Services), By Applications (Cancer, Cardiovascular Diseases, and Diabetes), By End-User (Payers, Providers, and Patients), And By Region (North America, Europe, Asia-Pacific, And Rest Of The World) - Growth Outlook & Industry Forecast 2025 To 2035

Forecast Period
2026-2035
CAGR
18.5%
2025 Market Size
USD 79.48 Billion
2035 Market Size
USD 438.77 Billion
Healthcare ● Updated August 24, 2026 Report ID: MRFR/HC/9421-HCR | Pages: 120 | Author: Rahul Gotadki, Vikita Thakur

Remote Patient Monitoring Market Summary

The Remote Patient Monitoring Market reached USD 79.48 Billion in 2025 and opens the forecast window at USD 95.27 Billion in 2026, climbing to USD 438.77 Billion by 2035 at an 18.5% CAGR. Two catalysts explain the slope. The U.S. Centers for Medicare & Medicaid Services expanded permanent reimbursement for remote physiologic and therapeutic monitoring codes, converting a pandemic-era workaround into billable standard practice [1]. Alongside that, the European Health Data Space regulation, adopted in 2025, obliges member states to make interoperable patient data available across borders — a structural unlock for cross-market platform vendors [2].

Hardware is changing underneath the billing codes. Hospitals are retiring tethered bedside telemetry and single-function spot-check devices in favour of low-power sensor patches, cellular-native gateways, and cloud analytics layers that flag decompensation hours before a nurse would. Sensor bill-of-materials costs have fallen roughly 40% since 2021, and venture funding into digital health monitoring platforms exceeded USD 6.1 billion in 2024 [3]. Private 5G deployments inside hospital campuses now cut telemetry latency to sub-100 milliseconds, making continuous arrhythmia surveillance clinically defensible outside the ICU [4].

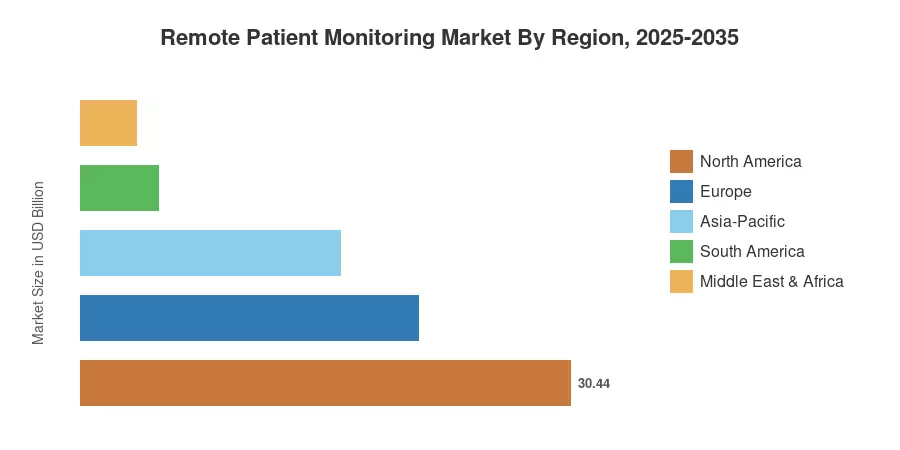
Geographically, North America holds 38.3% of the Remote Patient Monitoring Market on the back of mature reimbursement and dense payer-provider integration. Asia-Pacific compounds fastest at 20.3% through 2035, propelled by China's county-hospital digitisation push and India's Ayushman Bharat Digital Mission. Europe ranks second, anchored by Germany's DiGA fast-track pathway, which pays for approved digital therapeutics within statutory insurance. The next decade belongs to whoever converts device telemetry into reimbursable clinical decisions.


Key Report Takeaways

• By Technology

  • Specialized disease-specific monitors commanded 37.3% of the Remote Patient Monitoring Market in 2025, the single largest device category
  • Wearable sensor patches are advancing at an 18.7% CAGR through 2035, the fastest device-type trajectory
  • Vital-sign monitors generated USD 25.04 Billion in 2025 revenue

• By Sector

  • Cardiovascular applications accounted for 28.0% of 2025 revenue
  • Diabetes management expands at a 19.0% CAGR to 2035
  • Hospitals and clinics contributed USD 40.77 billion in 2025 within the Remote Patient Monitoring Market

• By Region

  • North America held a 38.3% share in 2025
  • Asia-Pacific posts a 20.3% CAGR through 2035
  • Europe delivered USD 20.98 Billion in 2025 revenue


Market Size and Forecast (2021–2035)

Figures below blend bottom-up device shipment modelling with top-down payer claims analysis. Historical values reconcile against CMS remote monitoring claim volumes, national health accounts data, and audited segment disclosures from twelve publicly listed device manufacturers. Forecast years apply adoption-curve modelling calibrated to reimbursement expansion schedules across the Remote Patient Monitoring Market.
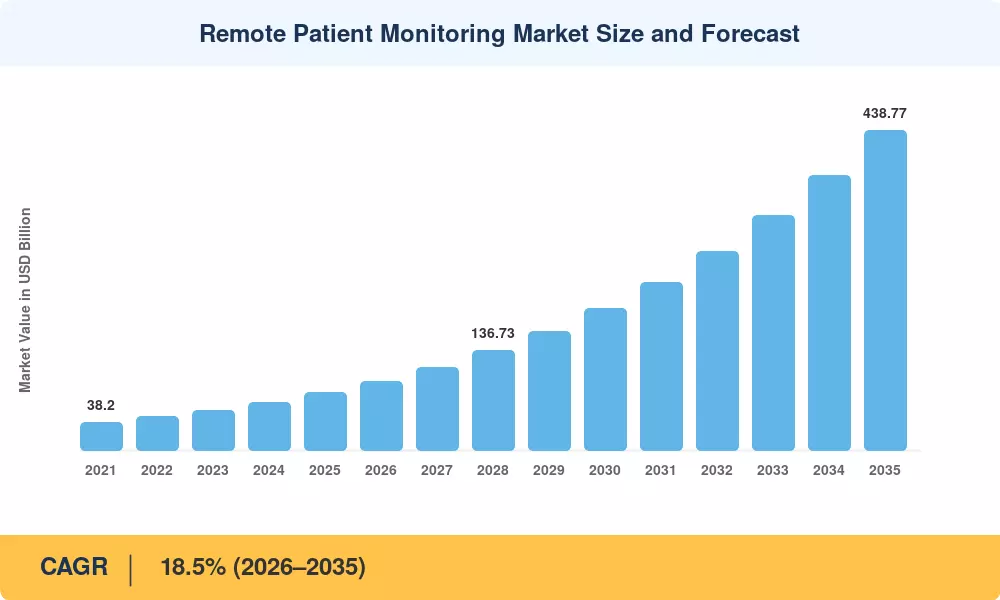
Remote Patient Monitoring Market Size and Forecast
Our Impact
Enabled $4.3B Revenue Impact for Fortune 500 and Leading Multinationals
Partnering with 2000+ Global Organizations Each Year
30K+ Citations by Top-Tier Firms in the Industry

Driver Impact Analysis

Driver ~% Impact on CAGR Geographic Relevance Impact Timeline
Permanent reimbursement expansion 4.6 North America, Europe Short-term (≤2 yr)
Ageing population and chronic burden 3.9 Global Long-term (≥4 yr)
Sensor miniaturisation and cost decline 3.1 Global Medium-term (2–4 yr)
Hospital capacity constraints 2.7 North America, Europe Short-term (≤2 yr)
AI-driven deterioration prediction 2.4 North America, Asia-Pacific Medium-term (2–4 yr)
Value-based care contracting 1.9 North America Long-term (≥4 yr)
5G and edge connectivity rollout 1.4 Asia-Pacific, Middle East Medium-term (2–4 yr)


Permanent Reimbursement Expansion

Money moved first, and clinicians followed. CMS now reimburses remote physiologic monitoring at roughly USD 43 to USD 62 per patient per month across the setup, device-supply, and treatment-management code families, with more than 1.2 million Medicare beneficiaries billed under these codes in 2024 [1]. That per-member economics converts monitoring from a cost centre into a contribution-margin line for physician groups. Germany's DiGA pathway operates on parallel logic, granting provisional statutory reimbursement for twelve months while real-world evidence accumulates [10].

Ageing Population and Chronic Disease Burden

Demographics supply the demand floor. The share of people aged 65 and over across OECD nations climbs from 18% in 2024 to an estimated 24% by 2040, and this cohort consumes roughly three times the per-capita health expenditure of working-age adults [6]. Cardiovascular disease alone accounts for nearly 20.5 million annual deaths globally [11]. Continuous surveillance offers the only economically viable way to manage that caseload without proportionally expanding inpatient beds.

Hospital Capacity Constraints

Beds became the binding constraint. Average occupancy across U.S. acute-care hospitals held above 75% through 2024, and readmission penalties under the Hospital Readmissions Reduction Program cost participating institutions roughly USD 320 million in a single fiscal year [7]. Hospital-at-home programmes, now operating at more than 380 approved U.S. sites, depend entirely on remote surveillance infrastructure to remain clinically safe.

AI-Driven Deterioration Prediction

Algorithms changed the value proposition from data collection to early warning. Validated sepsis and heart-failure prediction models running on continuous vitals streams have demonstrated 6-to-18-hour lead times before clinical recognition, with one multi-site study reporting a 20% relative reduction in 30-day heart-failure readmissions [8].


Restraints Impact Analysis

Restraint ~% Drag on CAGR Geographic Relevance Impact Timeline
Cybersecurity and breach liability -2.6 Global Short-term (≤2 yr)
Data-localisation and sovereignty rules -2.1 Asia-Pacific, Europe Medium-term (2–4 yr)
Clinician alarm fatigue and workflow burden -1.8 North America, Europe Short-term (≤2 yr)
Reimbursement gaps outside the U.S. -1.5 South America, Africa Long-term (≥4 yr)
Patient adherence and digital literacy -1.1 Global Medium-term (2–4 yr)


Cybersecurity and Breach Liability

The attack surface expanded more quickly than security budgets increased due to connected devices. Over 180 million records were compromised in U.S. healthcare data breaches in 2024, and the average cost per breach was USD 9.8 million, the highest of any industry for the fourteenth year in a row [12]. Manufacturers must now submit software bills of materials and coordinated vulnerability disclosure plans in accordance with FDA premarket cybersecurity regulations under Section 524B, which lengthens the normal clearance schedule by four to seven months.


Clinician Alarm Fatigue

Clinical capacity is exceeded by the signal volume. Nursing personnel in high-alert facilities silence warnings within seconds of triggering, and studies of continuous monitoring installations show that between 72% and 99% of physiologic alarms are not actionable [13]. Health organizations are favoring suppliers with clinically validated triage layers and prolonging evaluation cycles by requiring proven alarm-precision benchmarks prior to acquisition.


Reimbursement Gaps Outside the United States

Coverage remains patchy beyond a handful of high-income systems. Most South American and African payers lack dedicated billing codes for continuous physiologic monitoring, pushing costs onto out-of-pocket channels in markets where household health spending already exceeds 30% of total expenditure [14].


Remote Patient Monitoring Market Opportunities

Hospital-at-Home Programme Scaling

Acute-care substitution is the largest addressable prize. With more than 380 U.S. sites approved under the Acute Hospital Care at Home waiver and equivalent pilots running in Australia and Spain, each converted bed-day requires a monitoring stack costing a fraction of inpatient capacity [7]. Vendors bundling devices, connectivity, and 24/7 command-centre staffing capture recurring revenue rather than one-time hardware margin.

Emerging-Market Leapfrog Deployments

India, Indonesia, and Nigeria are skipping the wired-telemetry generation entirely. India's Ayushman Bharat Digital Mission has issued over 700 million health accounts, creating identity rails that make longitudinal chronic disease remote monitoring feasible at national scale [16]. Low-cost cuffless blood-pressure and pulse-oximetry devices priced under USD 30 open rural volumes that premium vendors cannot economically serve.

Data Monetisation and Evidence-as-a-Service

Longitudinal physiologic datasets have independent commercial value. Pharmaceutical sponsors paid an estimated USD 1.4 billion for decentralised trial infrastructure in 2024, and continuous-monitoring cohorts materially shorten endpoint collection windows [17]. Device vendors are launching de-identified real-world evidence subscriptions priced per therapeutic area, a gross-margin profile closer to software than hardware.

Payer-Embedded Chronic Care Bundles

Insurers are becoming direct buyers within the Remote Patient Monitoring Market. Medicare Advantage plans covering more than 34 million U.S. lives increasingly fund monitoring devices as supplemental benefits, because avoided admissions accrue directly to plan margin [9]. Contracts structured on shared savings rather than device sales shift vendor incentives toward outcome accountability.

Interoperability-Native Platform Consolidation

Fragmented device fleets create integration revenue. Health systems typically operate seven to eleven distinct monitoring vendors, and FHIR-native middleware that normalises those streams into a single EHR flowsheet resolves a concrete procurement pain point [2].


Remote Patient Monitoring Market Future Outlook

Autonomous Clinical Triage

Monitoring stops being observational and becomes decisional. By the early 2030s, expect FDA-cleared autonomous triage agents that adjudicate low-acuity alerts without human review, mirroring the regulatory precedent set by autonomous diabetic retinopathy screening. The Remote Patient Monitoring Market shifts pricing from per-device to per-adjudicated-event as a result [8].

Platform Economics and Vendor Consolidation

Orchestration software seizes the excess when hardware margins shrink near commodity levels. Software-weighted revenue mixes are already favored by acquisition multiples by a factor of about three, and health systems that consolidate from nine vendors to two will reward whoever owns the normalization layer [17].


Diagnostics Convergence

Wearables absorb functions previously requiring lab visits — cuffless blood pressure, non-invasive glucose trending, hydration and electrolyte proxies. Each cleared claim expands the addressable clinical workflow, and the WHO projects non-communicable diseases will account for 86% of the 90 million annual deaths anticipated by 2050 [11].

Regulatory Harmonisation and Data Sovereignty

There are two opposing forces at work. While national localization laws in Saudi Arabia, China, and India promote containment, the European Health Data Space promotes portability. By default, vendors catering to the global remote patient monitoring market will use federated architectures, processing at the edge and exporting only inferences that are drawn [2].


Remote Patient Monitoring Market Segmentation

By Device Type

Segment Metric (2025) Primary Demand Driver
Specialized Disease-Specific Monitors 37.3% share Cardiac and glucose management protocols
Vital-Sign Monitors USD 25.04 Billion Hospital-at-home and post-acute programmes
Wearable Sensor Patches 18.7% CAGR Continuous ambulatory ECG adoption
Implantable & Ingestible Devices 8.2% share Heart-failure pressure sensing
Other Device Types USD 3.66 Billion Peripheral and accessory demand


Disease-specific monitors lead the Remote Patient Monitoring Market because reimbursement attaches to conditions, not to sensors. Continuous glucose monitors and implantable loop recorders carry established billing pathways and clinical guideline endorsement, which shortens hospital procurement cycles considerably. Wearable sensor patches grow fastest from a smaller base — disposable ECG patches now dominate ambulatory arrhythmia workups that Holter monitors previously owned, and single-use economics generate repeat revenue that durable hardware cannot match.

By Application

Segment Metric (2025) Primary Demand Driver
Cardiovascular Diseases 28.0% share Heart-failure readmission penalties
Diabetes Management 19.0% CAGR CGM reimbursement broadening
Respiratory & COPD USD 14.15 Billion Post-exacerbation surveillance
Neurological Disorders 12.1% share Epilepsy and movement disorder tracking
Oncology USD 7.39 Billion Treatment-toxicity symptom monitoring
Other Applications 11.4% share Maternal and post-surgical care


Cardiovascular applications hold primacy in the Remote Patient Monitoring Market largely because heart failure carries the sharpest financial penalty for readmission and the clearest early-warning signal set. Diabetes management compounds fastest as continuous glucose monitoring migrates from Type 1 into the far larger Type 2 and pre-diabetic populations, a shift accelerated by payer coverage decisions across 2024 and 2025 [5].

By End User

Segment Metric (2025) Primary Demand Driver
Hospitals & Clinics USD 40.77 Billion Capacity constraints and readmission risk
Home-Care Settings 20.6% CAGR Hospital-at-home waiver expansion
Ambulatory Surgical Centres 9.8% share Post-discharge recovery surveillance
Other End Users 5.3% share Long-term care and payer programmes


Hospitals remain the dominant purchasing channel across the Remote Patient Monitoring Market, holding institutional budgets and integration capability that smaller settings lack. Home-care settings grow considerably faster, since every avoided admission converts inpatient cost into a monitoring subscription — a trade health systems increasingly make deliberately [7].


Regional Market Share Analysis

Region Metric (2025) Primary Investment Themes
North America 38.3% share Reimbursement-led scaling, hospital-at-home
Europe USD 20.98 Billion EHDS interoperability, DiGA reimbursement
Asia-Pacific 20.3% CAGR (2026–2035) County-hospital digitisation, low-cost devices
South America USD 4.85 Billion Private-payer chronic care pilots
Middle East & Africa 4.4% share Sovereign health-transformation programmes
Total USD 79.48 Billion

Regional distribution across the Remote Patient Monitoring Market reflects reimbursement maturity more than population size.


North America

Country Metric Key Driver
US 84.6% share of region CMS permanent RPM code reimbursement
Canada USD 2.71 Billion Provincial virtual-care funding envelopes
Mexico 17.9% CAGR IMSS chronic disease programme expansion


North America anchors the Remote Patient Monitoring Market because billing infrastructure arrived before clinical consensus did. U.S. providers billed remote monitoring codes for over 1.2 million Medicare beneficiaries in 2024, and the Hospital Readmissions Reduction Program supplies a standing financial penalty that monitoring directly mitigates [1] [7]. Canada's approach is slower and provincially fragmented, with Ontario and British Columbia funding virtual-care envelopes independently.

Europe

Country Metric Key Driver
Germany 23.8% share of region DiGA statutory reimbursement pathway
UK USD 3.86 Billion NHS virtual wards expansion
France 15.1% share of region Ma Santé 2022 telemonitoring tariffs
Italy 18.2% CAGR PNRR digital health allocation
Spain USD 1.72 Billion Regional chronic care programmes
Nordic Countries 7.4% share of region Mature EHR interoperability
Russia 14.6% CAGR Domestic device substitution policy
Rest of Europe USD 2.31 Billion EHDS harmonisation spillover


Europe's growth is policy-manufactured. The NHS committed to operating 10,000 virtual ward beds, and Italy allocated roughly EUR 4 billion of its national recovery plan to territorial healthcare digitisation [18]. Germany remains the reimbursement reference case, with more than 60 applications listed on the DiGA registry [10].

Asia-Pacific

Country Metric Key Driver
China 34.2% share of region County-hospital upgrade programme
India 23.4% CAGR Ayushman Bharat Digital Mission rails
Japan USD 3.94 Billion Super-aged demographic structure
South Korea 9.6% share of region Nationwide 5G medical infrastructure
ASEAN 21.7% CAGR Private hospital chain investment
Rest of Asia-Pacific USD 1.58 Billion Donor-funded primary care programmes


Asia-Pacific delivers the steepest trajectory in the Remote Patient Monitoring Market. China's National Health Commission targeted upgraded diagnostic and monitoring capability across more than 1,000 county-level hospitals, while India's digital health accounts surpassed 700 million [16] [19]. Japan's constraint is inverted — abundant reimbursement, scarce clinical labour — making automation the purchase rationale.

South America

Country Metric Key Driver
Brazil 52.7% share of region ANS supplementary health coverage rules
Argentina USD 0.87 Billion Private obra social chronic programmes
Rest of South America 17.4% CAGR Urban private hospital adoption


Brazil sets regional pace through its regulated supplementary health sector, which covers roughly 51 million lives and increasingly mandates chronic-care management protocols [20]. Public-sector adoption trails badly, constrained by procurement cycles and device import tariffs.

Middle East & Africa

Country Metric Key Driver
Saudi Arabia 27.9% share of region Vision 2030 Health Sector Transformation
UAE USD 0.71 Billion Malaffi and Riayati health data exchanges
South Africa 18.6% CAGR Private medical scheme adoption
Egypt 9.2% share of region Universal health insurance rollout
Rest of MEA USD 0.94 Billion Donor-funded NCD programmes


Sovereign programmes dominate here. Saudi Arabia's Health Sector Transformation Programme commits substantial capital to virtual care platforms including the Seha Virtual Hospital, which reported serving more than 400,000 patients across 170 connected facilities [21].


Remote Patient Monitoring Market By Region, 2025-2035

Competitive Benchmarking

Concentration sits in the moderate band. The estimated Herfindahl-Hirschman Index of roughly 640 and a top-five combined share near 34% describe a market where scale matters, but no participant dictates terms. Medical device incumbents compete against consumer-electronics entrants and venture-funded software platforms, and the boundary between clinical-grade and consumer-grade hardware keeps eroding as FDA clearances accumulate on wrist-worn products.

Company Est. Revenue Share Range Key Offerings for Remote Patient Monitoring Market Strategic Positioning
Koninklijke Philips N.V. ~9–12% Enterprise telemetry, patient monitors, eICU Broadest hospital installed base
Abbott Laboratories ~7–10% Continuous glucose monitoring, cardiac rhythm Category leader in diabetes sensing
Medtronic plc ~6–9% Implantable loop recorders, glucose systems Implantable-to-cloud continuum
GE HealthCare ~5–8% Acute-care monitoring, mobile telemetry Deep OEM and service relationships
Dexcom, Inc. ~4–7% Continuous glucose monitoring platforms Pure-play sensing scale economics
ResMed Inc. ~4–6% Sleep and respiratory cloud monitoring Largest connected respiratory fleet
Masimo Corporation ~3–5% Non-invasive oximetry, hospital automation Signal-quality differentiation
Baxter International Inc. ~3–5% Connected care, vital-sign platforms Post-acute and long-term care depth
Boston Scientific Corporation ~2–4% Cardiac device remote follow-up Electrophysiology channel strength
OMRON Healthcare ~2–4% Connected blood pressure, consumer sensing Consumer-to-clinical bridge
BIOTRONIK SE & Co. KG ~1–3% Home monitoring for cardiac implants Long-tenure European footprint
Nihon Kohden Corporation ~1–3% Patient monitoring and telemetry systems Asia-Pacific institutional presence


Recent News & Developments

  • Abbott (March 2025): Received clearance for a dual glucose-ketone continuous sensor, extending sensing beyond glycaemia into metabolic risk stratification [5]
  • Philips (November 2024): Announced expanded acute telehealth partnership covering additional U.S. health system ICU beds, deepening command-centre recurring revenue [22]


  • European Commission (March 2025): European Health Data Space regulation entered into force, mandating cross-border interoperability of electronic health records [2]
  • Medtronic (June 2024): Launched an AI-enabled cardiac monitoring workflow reducing false-positive arrhythmia alerts materially in validation testing [23]


  • Saudi Ministry of Health (February 2025): Expanded the Seha Virtual Hospital network to additional connected facilities under Vision 2030 [21]
  • Dexcom (August 2024): Began U.S. commercial availability of an over-the-counter glucose biosensor, opening a non-prescription channel [25]


Remote Patient Monitoring Market Report Scope

Parameter Detail
Market Scope Global remote physiologic and therapeutic monitoring devices, connectivity, platforms, and associated services
Study Period 2021–2035 (Historical 2021–2024; Base Year 2025; Forecast 2026–2035)
CAGR 18.5% (2026–2035)
Market Size Checkpoints USD 79.48 Billion (2025); USD 95.27 Billion (2026); USD 438.77 Billion (2035)
Fastest Growing Segments Wearable sensor patches; diabetes management; home-care settings; Asia-Pacific
Companies Profiled 12 leading participants in the Remote Patient Monitoring Market
Valuation Currency USD Billion, constant 2025 prices

FAQs

What procurement pitfalls should health systems avoid when tendering in the Remote Patient Monitoring Market?
Contracts that price per device rather than per monitored patient-month leave buyers exposed when fleets sit idle. Insist on alarm-precision service levels and FHIR export rights written into the master agreement [13].
How should investors evaluate valuation multiples in this space?
Weight recurring software and service revenue far above hardware revenue, since orchestration layers command roughly triple the multiple of device sales. Attrition rate on monitored patient cohorts is the single most predictive metric [17].
Does the Remote Patient Monitoring Market face meaningful antitrust or channel-lock scrutiny?
Regulators have focused on interoperability rather than concentration. Information-blocking enforcement in the U.S. and mandatory data portability under European rules effectively cap proprietary lock-in strategies [2].
What integration challenges most often derail deployments?
Mapping device telemetry into existing EHR flowsheets consumes more implementation hours than the hardware rollout itself. Health systems running multiple monitoring vendors face compounding normalisation costs without middleware [12].
How do consumer wearables compare with clinical-grade devices for reimbursement purposes?
Payers generally require FDA-cleared measurement claims and documented accuracy against reference standards. Consumer devices increasingly qualify for specific cleared functions, though rarely for full physiologic panels [5].
Which emerging use cases will expand the Remote Patient Monitoring Market beyond chronic care?
Post-surgical recovery surveillance and oncology treatment-toxicity tracking are scaling fastest among newer applications. Both attach to existing episode-based payment structures rather than requiring new codes [8].
What liability exposure do providers carry for missed alerts?
Standard of care is still forming, but documented escalation protocols and defined monitoring hours materially reduce exposure. Providers should contractually clarify whether the vendor or the clinical team owns first-line alert review [13].    
Author
Author
Author Profile
Rahul Gotadki LinkedIn
Research Manager
He holds an experience of about 9+ years in Market Research and Business Consulting, working under the spectrum of Life Sciences and Healthcare domains. Rahul conceptualizes and implements a scalable business strategy and provides strategic leadership to the clients. His expertise lies in market estimation, competitive intelligence, pipeline analysis, customer assessment, etc.
Co-Author
Co-Author Profile
Vikita Thakur LinkedIn
Senior Research Analyst
She holds an experience of about 5+ years in market research and business consulting projects for sectors such as life sciences, medical devices, and healthcare IT. She possesses a robust background in data analysis, market estimation, competitive intelligence, pipeline analysis market trend identification, and consumer behavior insights. Her expertise lies in technical Sales support, client interaction and project management, designing and implementing market research studies, conducting competitive analysis, and synthesizing complex data into actionable recommendations that drive business growth.
Share::
Request Free Sample

Research Approach


Secondary Research

The secondary research process involved comprehensive analysis of regulatory databases, peer-reviewed medical journals, digital health publications, and authoritative health organizations. Key sources included the US Food & Drug Administration (FDA) 510(k) Premarket Notification Database and Digital Health Center of Excellence, Centers for Medicare & Medicaid Services (CMS) Telehealth and RPM Billing Guidelines, European Commission Medical Device Coordination Group (MDCG) for CE marking under MDR, National Institute for Health and Care Excellence (NICE) Digital Health Guidance, International Telecommunication Union (ITU) e-Health Standards, American Telemedicine Association (ATA) Clinical Guidelines and Best Practices, Healthcare Information and Management Systems Society (HIMSS) Analytics, American Heart Association (AHA) Remote Cardiovascular Monitoring Guidelines, American Diabetes Association (ADA) Standards of Care for Diabetes Technology, National Health Service (NHS) England Digital Remote Monitoring Framework, National Institutes of Health (NIH)/National Library of Medicine (PubMed/MEDLINE) for randomized controlled trials on RPM efficacy, Centers for Disease Control and Prevention (CDC) Chronic Disease Indicators and Health IT Adoption Statistics, World Health Organization (WHO) Global Observatory for eHealth and Noncommunicable Disease (NCD) Surveillance, Office of the National Coordinator for Health IT (ONC) Interoperability Standards, Kaiser Family Foundation (KFF) Telehealth Policy Tracking, and national health ministry reports from key markets including Health Canada, TGA (Australia), PMDA (Japan), and NMPA (China). These sources were utilized to collect device approval data, procedure/monitoring statistics, clinical efficacy studies, reimbursement policy changes, chronic disease prevalence demographics, and competitive landscape analysis for cardiac monitors, glucose monitoring systems, vital sign sensors, pulse oximeters, blood pressure monitors, and integrated RPM software platforms.


Primary Research

To gather both qualitative and quantitative insights, supply-side and demand-side stakeholders were interviewed during the primary research phase. CEOs, CTOs, VPs of Digital Health Strategy, heads of regulatory affairs, directors of medical affairs, and commercial directors from companies that produce medical devices, RPM platforms, telemedicine services, and linked sensor OEMs were among the supply-side sources. Chief Medical Information Officers (CMIOs), Chief Clinical Officers, VP of Telehealth Operations, directors of remote care programs, board-certified cardiologists, endocrinologists, pulmonologists, primary care physicians, administrators of home health agencies, executives of accountable care organizations (ACOs), and procurement leads from hospital systems, ambulatory surgery centers, integrated delivery networks (IDNs), and payer organizations were among the demand-side sources. In addition to verifying AI-enabled diagnostic pipeline timelines and validating market segmentation (devices vs. services deployment models), primary research also collected information on clinical adoption barriers, reimbursement coding strategies (CPT 99453-99458, 99091), interoperability issues (HL7 FHIR adoption), and competitive pricing dynamics.

Primary Respondent Breakdown:

By Designation: C-level Primaries (40%), Director Level (35%), Others (25%)

By Region: North America (32%), Europe (30%), Asia-Pacific (28%), Rest of World (10%)


Market Size Estimation

Global market valuation was derived through revenue mapping, device shipment tracking, and service subscription analysis. The methodology included:

Identification of 40+ key manufacturers and platform providers across North America, Europe, Asia-Pacific, Latin America, and Middle East & Africa, including specialized cardiac monitoring device makers, diabetes management technology firms, and enterprise RPM software vendors

Product mapping across vital sign monitors, blood glucose monitors, cardiac event monitors (MCT/patch), blood pressure cuffs, pulse oximeters, weight scales, respiratory monitors, wearables (smartwatches/biosensors), and software-as-a-service (SaaS) monitoring platforms

Analysis of reported annual revenues and estimated service revenues specific to RPM portfolios, including hardware sales, monthly per-patient monitoring fees, and chronic care management (CCM) program revenues

Coverage of manufacturers and platform providers representing 70-75% of global market share in 2024, with triangulation of private company estimates through partnerships and deployment announcements

Extrapolation using bottom-up approach (device unit shipments × ASP by country + active monitored patient base × average monthly service revenue) and top-down approach (public company segment reporting validation and total digital health market percentage allocation) to derive segment-specific valuations for cardiovascular monitoring, diabetes management, oncology surveillance, and respiratory disease tracking applications

Share::
Request Free Sample
Download Free Sample

Kindly complete the form below to receive a free sample of this Report

* Please use a valid business email

Share::
Request Free Sample
Download PDF ×

We do not share your information with anyone. However, we may send you emails based on your report interest from time to time. You may contact us at any time to opt-out.
















