Residential Real Estate Market (2026 - 2035)

Residential Real Estate Market Research Report By Property Type (Single-Family Homes, Multi-Family Homes, Condos, Townhouses, Vacation Homes), By Purchase Purpose (Primary Residence, Investment Property, Second Home, Rental Property), By Buyer Profile (First-Time Homebuyers, Move-Up Buyers, Luxury Buyers, Investors), By Financing Method (Cash Purchase, Conventional Loan, FHA Loan, VA Loan), and By Regional : Global Opportunity Analysis and Industry Forecast, 2025 - 2035
ID: MRFR/PCM/10057-HCR
111 Pages
Snehal Singh
Last Updated: July 02, 2026
Residential Real Estate Market
Market Size
Forecast Period2026-2035
CAGR (2026-2035)6.50%
2025 Market SizeUSD 11.67 Trillion
2035 Market SizeUSD 21.87 Trillion
Key Players
China Vanke Co. Ltd.
Country Garden Holdings
D.R. Horton Inc.
Lennar Corporation
Sun Hung Kai Properties
Vonovia SE
Opportunities
  • Modular and Industrialized Construction
  • Affordable-Housing Public-Private Partnerships
  • PropTech Data Monetization and Platform Models

Residential Real Estate Market Summary

The Residential Real Estate Market was valued at USD 11.67 trillion in 2025 and is projected to reach USD 12.41 trillion by 2026, advancing to USD 21.87 trillion by 2035 at a CAGR of 6.50% during the 2026–2035 forecast period. Persistent housing undersupply across major economies, coupled with government-led construction programs in India, Brazil, and Saudi Arabia, continues to channel both public and private capital into the Residential Real Estate Market at an accelerating pace. Mortgage-support schemes and approvals reform in these countries have stabilized pre-sales pipelines and de-risked project delivery, drawing institutional investors who were historically focused on commercial assets [1].

A technological transformation is reshaping how housing is designed, sold, and managed. Legacy paper-based permitting, manual construction scheduling, and fragmented property management systems are giving way to Building Information Modeling (BIM), proptech transaction platforms, and AI-driven property valuations. The European Union's revised Energy Performance of Buildings Directive (EPBD) has committed member states to near-zero-emission newbuilds by 2030, redirecting an estimated EUR 275 billion annually toward retrofits and low-emissions construction across the continent's aging housing stock [3][4].

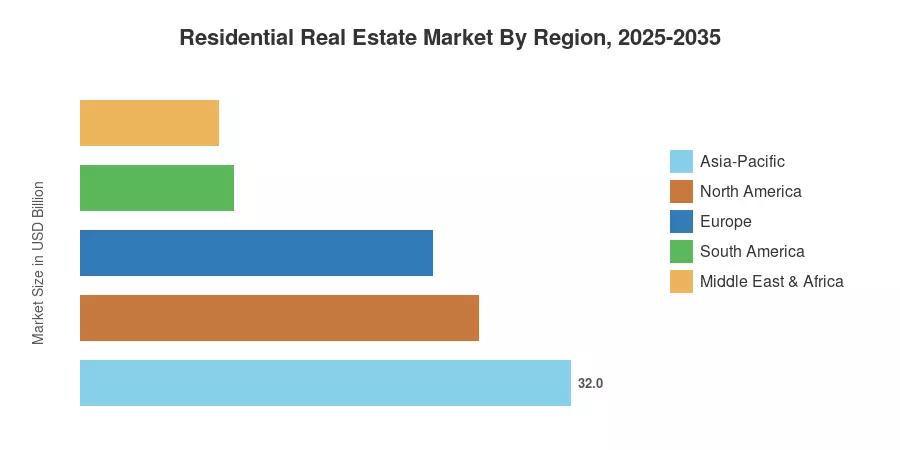
Asia-Pacific commands the largest share of the Residential Real Estate Market at 32.0% of global value and is simultaneously the fastest-growing region, projected at a 7.45% CAGR through 2035. North America holds the second-largest position with a 26.0% share, underpinned by resilient single-family demand and institutional rental expansion. Europe accounts for 23.0% of global activity, with renovation-led investment increasingly outpacing greenfield construction. As urbanization accelerates across emerging economies, the Residential Real Estate Market is positioned for sustained expansion through the next decade.


Key Report Takeaways

• By Property Type

  • Apartments and condominiums held a 55.0% share of the Residential Real Estate Market in 2025, driven by urban density preferences and transit-oriented development policies across Asia-Pacific and Europe.
  • Villas and landed houses are forecast to grow at a 6.72% CAGR during 2026–2035, reflecting demand for spacious living formats in suburban and peri-urban corridors post-pandemic.

• By Price Band

  • Mid-market units accounted for 44.0% of 2025 transaction volumes, supported by government-backed mortgage programs and first-time-buyer subsidies.
  • The luxury and super-prime segment is projected to expand at a 6.75% CAGR through 2035, fueled by cross-border wealth migration and branded-residence partnerships.

• By Business Model

  • The secondary market represented 57.0% of activity in the Residential Real Estate Market in 2025, as established housing stock turnover remains the primary transaction channel globally.
  • Primary sales are set to grow at a 7.12% CAGR through 2035 as large-scale master-planned communities enter delivery phases in India, the Middle East, and Southeast Asia.

• By Mode of Sale

  • Outright sales captured 58.0% of transaction activity in 2025.
  • Rentals are forecast to grow at a 7.25% CAGR during 2026–2035, as affordability pressure and lifestyle preferences shift tenure patterns in developed markets.

• By Region

  • Asia-Pacific led the Residential Real Estate Market with a 32.0% share in 2025 and is expected to post the fastest CAGR of 7.45% through 2035.
  • North America held a 26.0% share, while Europe accounted for 23.0% of global value.


Residential Real Estate Market Size and Forecast (2021–2035)

Market sizing draws on national housing-start data, property-registration databases, central-bank mortgage statistics, and proprietary developer surveys across 42 countries. Historical values (2021–2024) reflect audited transaction records and government housing ministry releases. Forecast values (2026–2035) apply econometric models incorporating population growth, urbanization rates, interest-rate scenarios, and policy pipelines.
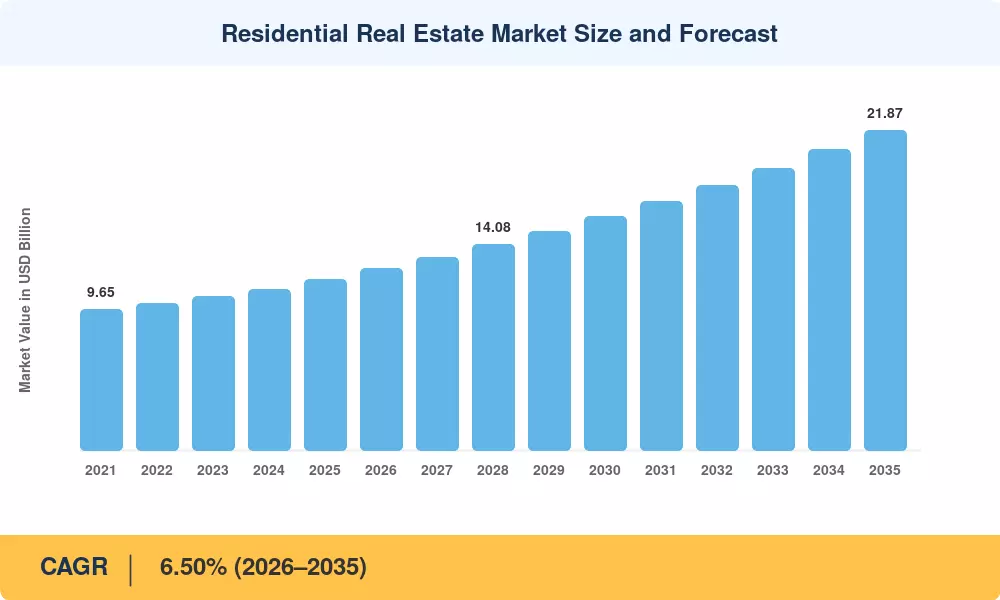
Residential Real Estate Market Size and Forecast
Our Impact
Enabled $4.3B Revenue Impact for Fortune 500 and Leading Multinationals
Partnering with 2000+ Global Organizations Each Year
30K+ Citations by Top-Tier Firms in the Industry

Driver Impact Analysis

Driver ~% Impact on CAGR Geographic Relevance Impact Timeline
Chronic housing undersupply 22–25% Global Long-term
Government housing programs 18–21% India, Brazil, Saudi Arabia Medium-term
Institutional rental investment 15–18% North America, Europe Medium-term
Urbanization and demographic growth 14–16% Asia-Pacific, Africa Long-term
Energy-efficiency retrofit mandates 10–12% Europe Medium-term
Proptech and digital transaction platforms 8–10% Global Short-term
Mortgage-rate stabilization 6–8% North America, Europe Short-term


Chronic Housing Undersupply

The single most potent driver of the residential real estate market is still housing deficits in the biggest economies in the world. According to National Association of Realtors and Freddie Mac analyses published in 2024, the shortage in the United States alone is predicted to be between 4.0 and 7.2 million units, while the shortfall in the United Kingdom is more than 1.2 million dwellings in comparison to household formation patterns [1][14]. Over several decades, these disparities encourage both public and private construction investment and maintain rising pricing pressure.


Government Housing Programs

Large-scale fiscal commitments are reshaping supply pipelines in key emerging markets. India's Pradhan Mantri Awas Yojana (PMAY) Urban 2.0 has allocated INR 2.0 lakh crore (approximately USD 24 billion) to deliver an additional 10 million urban units by 2028 [7]. Saudi Arabia's Sakani program targets a 70% homeownership rate by 2030, backed by subsidized loans and land-grant mechanisms that have already facilitated over 600,000 housing solutions since 2017 [9]. Brazil's Minha Casa, Minha Vida reboot in 2023 raised income eligibility ceilings and restarted subsidized construction that had stalled during the prior administration [15].

Institutional Rental Investment

A historically dispersed segment of the residential real estate market is becoming more professional because of build-to-rent (BTR) and single-family rental (SFR) platforms. Institutional investors invested more than USD 68 billion in purpose-built rental communities worldwide in 2024, a 12% increase from the previous year [8]. In order to generate long-term rental revenue, REITs and sovereign wealth funds are funding new multifamily constructions and purchasing stabilized portfolios in the US, Germany, and Japan.


Proptech and Digital Transaction Platforms

Digital mortgage origination, AI-powered property valuation, and blockchain-based title registries are compressing transaction timelines and reducing friction costs by 20–35% in early-adopter markets [12]. India's RERA-mandated digitization of project registrations and the UAE's tokenized real-estate frameworks represent regulatory tailwinds that accelerate proptech adoption within the Residential Real Estate Market [16].


Restraints Impact Analysis

Restraint ~% Impact on CAGR Geographic Relevance Impact Timeline
Elevated mortgage rates and affordability erosion –18 to –22% North America, Europe Short-term
Construction-cost inflation –14 to –17% Global Medium-term
Regulatory and zoning bottlenecks –10 to –13% US, UK, Australia Long-term
Geopolitical uncertainty and capital-flow restrictions –8 to –10% China, Russia, Turkey Medium-term
Climate-risk repricing and insurance withdrawal –5 to –7% US coastal, SE Asia Long-term


Elevated Mortgage Rates and Affordability Erosion

Central-bank tightening cycles that began in 2022 pushed average 30-year fixed rates in the United States above 7% by late 2023, effectively locking millions of potential buyers out of the Residential Real Estate Market. While rates have moderated, the affordability gap — measured by the ratio of median home price to median household income — remains above 5× in 78% of US metropolitan areas, the widest since 1985 [5][14]. Similar dynamics in the UK, Canada, and Australia are channeling would-be buyers into rental tenure, capping transaction volumes even as underlying demand remains strong.

Construction-Cost Inflation

Between 2020 and 2024, the total cost of building inputs increased by more than 38% due to supply-chain disruptions, shortages of skilled labor, and price increases for steel, concrete, and lumber [17]. Particularly in the mid-market and cheap segments of the residential real estate market, where price limitations are the tightest, these increased expenses reduce developer margins and postpone project debuts. Although 3D printing and modular construction provide long-term relief, their present market penetration is still less than 5% of all house starts worldwide.


Climate-Risk Repricing

Insurers have withdrawn from or dramatically repriced coverage in high-exposure coastal and wildfire zones across Florida, California, and Southeast Asia, adding 15–30% to annual carrying costs for homeowners in affected areas [19]. This repricing is beginning to deflate valuations in the Residential Real Estate Market in climate-vulnerable geographies, a trend that will intensify as physical risk models become more granular through the forecast period.


Residential Real Estate Market Opportunities

Modular and Industrialized Construction

Off-site manufacturing of housing modules can reduce build times by 30–50% and cut waste by up to 80% compared to traditional methods [17]. Governments in the UK, Singapore, and Sweden are embedding modular-construction incentives into public procurement rules, creating a pipeline exceeding USD 40 billion through 2030 that benefits developers positioned in the Residential Real Estate Market with factory-capacity investments.

Affordable-Housing Public-Private Partnerships

The global affordable-housing gap is estimated at 440 million units by the World Bank, representing a multi-trillion-dollar addressable opportunity for the Residential Real Estate Market [20]. Tax-increment financing, inclusionary zoning mandates, and cross-subsidy models — where luxury-plot sales fund affordable-unit delivery — are scaling rapidly in India, Brazil, and sub-Saharan Africa.

PropTech Data Monetization and Platform Models

Digitized property registries, automated valuation models, and tenant-management platforms are generating transaction-level datasets that can be monetized through subscription analytics, dynamic pricing engines, and credit-scoring integrations. The global proptech sector attracted USD 13.5 billion in venture funding in 2024, with residential platforms capturing 62% of that total [12].

Green Retrofit and Net-Zero Conversion

Europe's EPBD mandates require minimum energy-performance standards for all existing housing by 2033, unlocking an estimated EUR 275 billion annual retrofit opportunity across the Residential Real Estate Market [3]. Green-bond financing for residential retrofits grew 45% year-over-year in 2024, and lenders are increasingly offering preferential mortgage rates for energy-efficient homes.

Senior-Living and Multigenerational Housing

The need for integrated senior-living communities and multigenerational housing forms in the residential real estate market is being driven by aging populations in the US, Japan, and Germany. By 2030, Japan alone is expected to need 1.5 million more age-friendly housing units, creating a white-space opportunity for operators and developers that can integrate healthcare [21].


Residential Real Estate Market Future Outlook

AI-Driven Property Operations

Artificial intelligence will become foundational to the Residential Real Estate Market's operational layer over the next decade. Automated tenant screening, predictive maintenance scheduling, and dynamic rent optimization are expected to reduce property-management operating costs by 18–25% by 2030 [12]. Large institutional landlords managing portfolios exceeding 10,000 units will gain the earliest advantages, but SaaS platforms will democratize these capabilities for mid-market operators by 2032.

Platform Economics and Fractional Ownership

Tokenized ownership and fractional-investment platforms are lowering entry barriers to the Residential Real Estate Market for retail investors, particularly in high-value urban centers. Regulatory sandboxes in the UAE, Singapore, and the UK are testing securities-grade frameworks for tokenized property, and the IEA estimates that fractional platforms could channel USD 1.4 trillion in new capital into housing assets by 2035 [16][25].

Net-Zero Construction Supercycle

Decarbonization mandates will trigger a generational construction supercycle within the Residential Real Estate Market. The International Energy Agency estimates that achieving net-zero building emissions by 2050 requires tripling the annual rate of residential energy retrofits globally, a commitment equivalent to USD 3.5 trillion in cumulative investment between 2025 and 2040 [3][4]. Mass-timber construction, low-carbon concrete, and integrated photovoltaic facades will transition from niche applications to mainstream specifications.

ESG Reporting and Green-Finance Integration

Sustainability-linked lending and ESG disclosure requirements are rewiring capital allocation in the Residential Real Estate Market. The EU Taxonomy for Sustainable Activities now covers residential mortgages, and green-bond issuance for housing projects exceeded USD 52 billion globally in 2024 [4]. Developers with verified green-building certifications (LEED, BREEAM, EDGE) are accessing 30–50 basis-point interest-rate discounts, creating a tangible economic incentive for the entire value chain to align with net-zero pathways through 2035.


Residential Real Estate Market Segmentation

By Property Type

Segment Key Metric Primary Demand Driver
Apartments & Condominiums 55.0% share (2025) Urban density, transit-oriented development
Villas & Landed Houses 6.72% CAGR (2026–2035) Suburban migration, lifestyle preferences


Apartments and condominiums dominate the Residential Real Estate Market's property-type landscape, accounting for 55.0% of global value in 2025. High-rise and mid-rise formats are the default product in Asia-Pacific's megacities, where land scarcity and zoning regulations favor vertical development. Shanghai, Mumbai, and Jakarta collectively permitted over 1.2 million apartment units in 2024, a 9% increase over 2023 [6]. Villas and landed houses, while a smaller share, are expanding at a faster CAGR of 6.72% as remote-work adoption and suburban-infrastructure investment sustain demand for larger-footprint formats in the Residential Real Estate Market, particularly across the US Sun Belt, India's tier-2 cities, and the Gulf states [9].

By Price Band

Segment Key Metric Primary Demand Driver
Affordable 28.0% share (2025) Government subsidy programs, first-time buyers
Mid-Market 44.0% share (2025) Dual-income households, mortgage accessibility
Luxury / Super-Prime 6.75% CAGR (2026–2035) Cross-border wealth, branded residences


Mid-market units continue to form the backbone of the Residential Real Estate Market, representing 44.0% of 2025 transaction volumes. This segment benefits from government-backed mortgage guarantees (such as FHA loans in the US and PMAY-linked subsidies in India) that sustain buyer access despite affordability headwinds. The luxury and super-prime segment, while smaller in volume terms, is the fastest-growing price band at a 6.75% CAGR, propelled by branded-residence collaborations (Four Seasons, Aman, Mandarin Oriental) that command 25–35% price premiums over comparable unbranded units in cities like Dubai, Miami, and London [25].

By Business Model

Segment Key Metric Primary Demand Driver
Secondary (Resale) 57.0% share (2025) Established housing-stock turnover
Primary (New Sales) 7.12% CAGR (2026–2035) Master-planned community deliveries


The secondary market holds a 57.0% share of the Residential Real Estate Market, reflecting the dominance of existing-home transactions in mature economies where housing stock turnover drives the bulk of activity. Primary sales are growing faster at 7.12% CAGR as major developers in India, Saudi Arabia, and Southeast Asia deliver large-scale master-planned communities funded by institutional capital and government incentives.

By Mode of Sale

Segment Key Metric Primary Demand Driver
Outright Sales 58.0% share (2025) Homeownership preference, wealth accumulation
Rentals 7.25% CAGR (2026–2035) Affordability constraints, lifestyle flexibility


Outright sales remain the dominant transaction mode in the Residential Real Estate Market at 58.0% of 2025 activity, supported by deeply embedded homeownership aspirations across most cultures. Rentals, however, represent the fastest-growing mode at 7.25% CAGR, driven by structural affordability pressure that is pushing first-time buyers — particularly in gateway cities — toward professional rental platforms. Build-to-rent investment in the US, UK, and Germany surpassed USD 68 billion in 2024 [8], and this capital commitment is expanding the institutional-grade rental stock available within the Residential Real Estate Market through the forecast period.


Regional Market Share Analysis

Region Key Metric Primary Investment Themes
Asia-Pacific 32.0% share (2025) Mass urbanization, government affordable schemes, smart-city corridors
North America 26.0% share (2025) Institutional rental, suburban SFR, proptech adoption
Europe 23.0% share (2025) Energy retrofits, build-to-rent scaling, migration-led demand
South America 10.0% share (2025) Social-housing programs, mortgage subsidy expansion
Middle East & Africa 9.0% share (2025) Vision 2030 mega-projects, diaspora investment, youth demographics
Total 100%

The Residential Real Estate Market exhibits a concentration tilt toward Asia-Pacific, where rapid urbanization, population scale, and government housing programs converge to sustain the region's dominance through the forecast period.


North America

Country Key Metric Key Driver
United States 82.0% of regional share Housing-shortage backlog, institutional BTR
Canada 11.5% of regional share Immigration-driven demand, densification policy
Mexico 6.5% of regional share INFONAVIT reform, nearshoring-linked housing demand


The United States dominates the North American Residential Real Estate Market, where single-family starts recovered to a 1.42-million annualized rate by Q4 2024 despite elevated borrowing costs [14]. Canada's federal Housing Accelerator Fund has committed CAD 4 billion to fast-track 750,000 new units by 2031, while Mexico's INFONAVIT pension-to-mortgage reform is expanding credit access to informal-sector workers who represent roughly half the labor force [22].

Europe

Country Key Metric Key Driver
Germany 6.18% CAGR (2026–2035) BTR institutional scaling, refugee-driven demand
United Kingdom 5.95% CAGR (2026–2035) Planning reform, affordable-housing mandates
France USD 1.34 Trillion (2025) Renovation subsidies, MaPrimeRénov' program
Italy 5.72% CAGR (2026–2035) Superbonus-driven retrofits, tourism-linked housing
Spain USD 0.48 Trillion (2025) Golden-visa phaseout, domestic demand recovery
Nordic Countries 5.85% CAGR (2026–2035) Modular construction leadership, green-building mandates
Russia USD 0.31 Trillion (2025) Government mortgage subsidies, domestic-capital containment
Rest of Europe 5.60% CAGR (2026–2035) EU cohesion funds, accession-market urbanization


The European Residential Real Estate Market is being reshaped by the twin forces of energy-performance regulation and institutional capital entry into rental housing. Germany's build-to-rent pipeline exceeded EUR 12 billion in committed capital in 2024, while France's MaPrimeRénov' scheme disbursed EUR 5.6 billion for residential energy upgrades in 2023 alone [3][23].

Asia-Pacific

Country Key Metric Key Driver
China 38.0% of regional share Policy stabilization, tier-2/3 city urbanization
India 7.85% CAGR (2026–2035) PMAY-Urban 2.0, metro expansion corridors
Japan USD 0.62 Trillion (2025) Senior-housing demand, asset-reflation policies
South Korea 6.90% CAGR (2026–2035) New-town mega-projects, reconstruction wave
ASEAN 7.52% CAGR (2026–2035) Rapid urbanization, foreign-buyer liberalization
Rest of Asia-Pacific USD 0.28 Trillion (2025) Infrastructure-linked township development


Asia-Pacific's leadership in the Residential Real Estate Market reflects the sheer scale of housing demand generated by its urbanizing population base. China's State Council introduced over 30 demand-side support measures in 2024 — including mortgage-rate floors removal, down-payment reductions, and local-government property buybacks — to stabilize a housing sector that accounts for roughly 29% of GDP [6][18]. India's metro-rail expansion across 27 cities is catalyzing transit-oriented development corridors that will absorb a significant share of the 10 million PMAY-Urban 2.0 units planned through 2028 [7].

South America

Country Key Metric Key Driver
Brazil 68.0% of regional share Minha Casa Minha Vida relaunch, Selic-rate easing
Argentina 5.48% CAGR (2026–2035) Peso stabilization, mortgage-market formalization
Rest of South America USD 0.37 Trillion (2025) Mining-corridor housing, remittance-financed builds


Brazil anchors the South American Residential Real Estate Market, where the relaunched Minha Casa, Minha Vida program contracted 580,000 units in 2024 — the highest volume in a decade. The program's expanded income-eligibility ceiling (to BRL 8,000/month) and subsidized interest rates have rekindled private-developer participation, particularly in the Northeast and Midwest regions [15].

Middle East & Africa

Country Key Metric Key Driver
Saudi Arabia 7.62% CAGR (2026–2035) Vision 2030 Sakani program, NEOM-adjacent demand
UAE 34.0% of regional share Expo-legacy infrastructure, golden-visa inflows
South Africa USD 0.14 Trillion (2025) Social-housing backlog, FLISP subsidies
Egypt 7.28% CAGR (2026–2035) New Administrative Capital, population growth
Rest of MEA USD 0.18 Trillion (2025) Youth demographics, diaspora remittances


The Middle East & Africa Residential Real Estate Market is driven by ambitious state-led urbanization programs. Saudi Arabia's Sakani program delivered 418,000 housing solutions in 2023, putting the Kingdom on track for its 70% homeownership target by 2030 [9]. In Egypt, the New Administrative Capital east of Cairo has attracted over USD 58 billion in committed investment and is anchoring a residential corridor that will house an estimated 6.5 million people upon full completion [24].


Residential Real Estate Market By Region, 2025-2035

Competitive Benchmarking

The Residential Real Estate Market exhibits medium concentration, with the top five players accounting for an estimated 12–16% of global transaction value. The sector remains highly fragmented due to the localized nature of land acquisition, permitting, and construction, though institutional consolidation — particularly in rental operations — is gradually raising concentration levels. The Herfindahl-Hirschman Index (HHI) for the global market is estimated below 500, indicating a competitive structure characterized by thousands of regional developers, national champions, and a small tier of multinational operators.

Company Est. Revenue Share Range Key Offerings Strategic Positioning
China Vanke Co. Ltd. ~3–5% Mixed-use townships, property management China's largest diversified developer by units delivered
Country Garden Holdings ~2–4% Affordable and mid-market housing, smart communities Scale-focused suburban developer across 280+ Chinese cities
D.R. Horton Inc. ~2–3% Entry-level and move-up single-family homes America's largest homebuilder by volume
Lennar Corporation ~1.5–2.5% Single-family, multifamily, financial services Vertically integrated US homebuilder with mortgage arm
Sun Hung Kai Properties ~1–2% Premium residential, mixed-use, property investment Hong Kong and mainland China luxury-residential leader
Vonovia SE ~1–2% Multifamily rental, energy-efficient retrofits Europe's largest residential landlord by units (~550,000)
DLF Limited ~1–1.5% Luxury and super-luxury residential, plotted developments India's premium-segment market leader in NCR
Brookfield Asset Management ~1–1.5% Build-to-rent, multifamily, mixed-use Global alternative-asset manager with USD 50B+ real estate AUM
Mitsui Fudosan Co. Ltd. ~0.8–1.2% Condominiums, rental apartments, senior housing Japan's largest integrated real-estate company
PulteGroup Inc. ~0.8–1.2% Active adult, first-time buyer, move-up homes US builder with segment-focused brand portfolio


Recent News & Developments

  • D.R. Horton (October 2024): Reported the delivery of 89,690 homes in FY2024, maintaining its position as the largest US homebuilder in the Residential Real Estate Market despite a 4% decline in average selling prices driven by an entry-level product mix shift [14].


  • Government of India (August 2024): Launched PMAY-Urban 2.0 with a total outlay of INR 10 lakh crore (USD 120 billion, including private leverage), targeting 10 million additional urban housing units by 2028, significantly expanding the Residential Real Estate Market's addressable pipeline in India [7].
  • Saudi Arabia's Sakani Program (June 2024): Surpassed 600,000 cumulative housing solutions, with the Ministry of Housing confirming that homeownership among Saudi nationals reached 63.4% — up from 47% in 2017 [9].
  • Brookfield Asset Management (March 2024): Closed a USD 10.2 billion real-estate flagship fund with allocations to multifamily and build-to-rent strategies across North America and Europe [8].
  • China State Council (May 2024): Issued a 30-point housing stabilization package removing mortgage-rate floors nationally, reducing minimum down payments to 15% for first-time buyers, and authorizing local governments to purchase unsold inventory for conversion into subsidized rental stock [18].


  • European Commission (December 2023): Published the final text of the revised Energy Performance of Buildings Directive, mandating minimum energy-performance standards for existing housing by 2033 and zero-emission newbuilds from 2030 [3].


Residential Real Estate Market Report Scope

Parameter Detail
Market Scope Global Residential Real Estate Market, covering new construction, resale, and rental transactions across all property types and price bands
Study Period 2021–2035
CAGR 6.50% (2026–2035)
Base-Year Market Size USD 11.67 Trillion (2025)
Forecast-End Market Size USD 21.87 Trillion (2035)
Fastest Growing Segment Rentals (by mode of sale, 7.25% CAGR)
Companies Profiled 10 major global developers, REITs, and institutional operators
Valuation Currency USD (Trillion)


FAQs

How does mortgage-rate volatility affect the timing of Residential Real Estate Market investments?
Rate increases of 100+ basis points typically reduce transaction volumes by 8–12% within six months, but they also widen rental yields, making buy-to-let strategies more attractive in rate-peak environments [5]. Investors who acquired during the 2023 rate peak in the US captured 15–20% price appreciation by 2025.
What distinguishes build-to-rent from traditional multifamily development in the Residential Real Estate Market?
Build-to-rent projects are purpose-designed for long-term occupancy with amenity packages, professional management, and institutional-grade maintenance, unlike for-sale apartments later converted to rentals [8]. This operational model commands 10–15% rent premiums over converted stock.
How are branded residences reshaping pricing dynamics in the Residential Real Estate Market?
Partnerships with luxury hospitality brands (Four Seasons, Aman) generate 25–35% price premiums over comparable unbranded projects in the same submarket [25]. Buyers pay for guaranteed service standards and resale-value insulation.
What role does modular construction play in addressing the Residential Real Estate Market's supply gap?
Factory-built modules cut project timelines by 30–50% and reduce on-site labor needs by up to 70%, directly addressing skilled-worker shortages [17]. Adoption remains below 5% of global starts but is scaling rapidly in Sweden, Singapore, and the UK.
How does climate-risk repricing affect property valuations in the Residential Real Estate Market?
Properties in FEMA-designated flood zones and wildfire-interface areas have experienced 7–15% valuation discounts since 2022 as insurers withdraw or reprice coverage [19]. This trend is redirecting capital toward climate-resilient inland markets.
What financing mechanisms support affordable-segment growth in the Residential Real Estate Market?
Cross-subsidy models, tax-increment financing, and development-finance institutions (DFIs) collectively fund over USD 45 billion annually in below-market-rate housing globally [20]. Government guarantees on affordable-segment mortgages reduce lender risk and widen credit access.
How are digital twins and BIM reshaping project delivery in the Residential Real Estate Market?
Digital twins reduce design-coordination errors by 40–60% and cut rework costs by up to 25% during construction [12]. Adoption is highest among large-scale developers in the UAE and Singapore, where regulatory mandates require BIM-Level-2 submissions.    
Author
Author
Author Profile
Snehal Singh LinkedIn
Manager - Research
High acumen in analyzing complex macro & micro markets with more than 6 years of work experience in the field of market research. By implementing her analytical skills in forecasting and estimation into market research reports, she has expertise in Packaging, Construction, and Equipment domains. She handles a team size of 20-25 resources and ensures smooth running of the projects, associated marketing activities, and client servicing.

Research Approach


Secondary Research

The secondary research process involved comprehensive analysis of property transaction databases, housing market reports, peer-reviewed urban planning journals, government housing publications, and authoritative real estate organizations. Key sources included the US Department of Housing and Urban Development (HUD), US Census Bureau, European Mortgage Federation (EMF), European Central Bank (ECB) Real Estate Statistics, National Association of Realtors (NAR), Royal Institution of Chartered Surveyors (RICS), International Monetary Fund (IMF) Global Housing Watch, OECD Affordable Housing Database, World Bank Urban Development Indicators, UN-Habitat World Cities Report, Bank for International Settlements (BIS) Property Price Statistics, national central banks (Federal Reserve, Bank of England, Bank of Japan), housing ministry reports from key markets, Freddie Mac Primary Mortgage Market Survey, and Mortgage Bankers Association (MBA) industry data.

Statistics on housing transactions, mortgage lending information, property price indices, demographic migration patterns, zoning laws, and market landscape analysis for single-family, condominium, multi-family, and vacation properties were gathered from these sources.


Primary Research

In order to gather both qualitative and quantitative insights, supply-side and demand-side stakeholders were interviewed during the primary research process. CEOs, VPs of Business Development, regional sales directors, and technology leaders from PropTech firms, real estate brokerages, and property developers were examples of supply-side suppliers. Residential developers, real estate brokers and agents, mortgage lenders, property managers, and procurement leads from building companies, housing associations, and investment trusts were examples of demand-side suppliers. In addition to gathering information on buyer preference patterns, price tactics, mortgage rate sensitivities, and regulatory compliance dynamics, primary research validated market segmentation and development pipeline timetables.

Primary Respondent Breakdown:

By Designation: C-level Primaries (40%), Director Level (25%), Others (35%)

By Region: North America (32%), Europe (30%), Asia-Pacific (28%), Rest of World (10%)


Market Size Estimation

Housing unit volume analysis and transaction value mapping were used to get the global market valuation. The methodology comprised:

Finding more than fifty important brokerage houses, developers, and PropTech platforms across North America, Europe, Asia-Pacific, Latin America, and the Middle East

Mapping property types for townhouses, single-family homes, condos, multi-family homes, and vacation homes

Examination of annual transaction volumes for residential property segments, both reported and modeled

coverage of businesses that account for 75–80% of the world market in 2024

Extrapolating segment-specific valuations utilizing top-down (brokerage/development revenue validation) and bottom-up (housing starts × median price per country) methods

By adding reliable government and industry sources and modifying the primary research percentages as needed, this methodology tailors your dermal filler research structure to the residential real estate market.

Download Free Sample

Kindly complete the form below to receive a free sample of this Report

Download PDF ×

We do not share your information with anyone. However, we may send you emails based on your report interest from time to time. You may contact us at any time to opt-out.
















