Reusable Launch Vehicles Market

Key Players: SpaceX, Rocket Lab, Blue Origin, ArianeGroup, United Launch Alliance, CASC (China), Northrop Grumman, Relativity Space

Reusable Launch Vehicles Market

Reusable Launch Vehicles Market Size, Share, Industry Trend & Analysis Research Report By Type (Partially Reusable, Fully Reusable), By Configuration (Two-Stage-to-Orbit (TSTO), By Single-Stage-to-Orbit (SSTO)), By Payload Class (Small, Medium, Heavy), By End User (Commercial, Defense & Government), By Mission (Satellite Deployment, Human Spaceflight, Cargo Resupply & Other), By Geography (North America, Europe, Asia-Pacific, South America, Middle East & Africa) - Forecast to 2035.
ID: MRFR/AD/23351-HCR
128 Pages
Shubham Munde, Sejal Akre
Last Updated: June 17, 2026

Reusable Launch Vehicles Market Summary

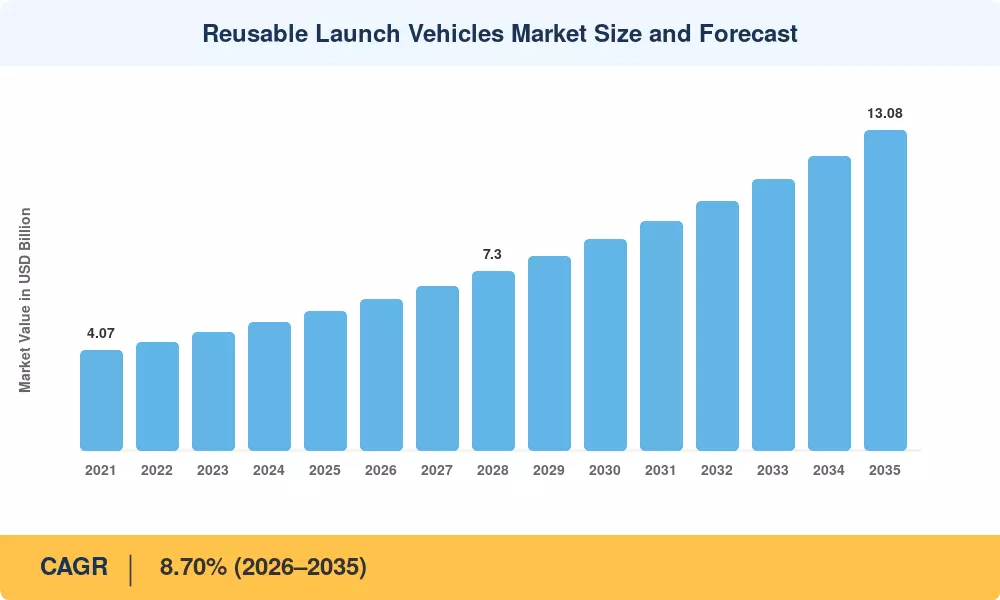
The reusable launch vehicles market was valued at USD 5.68 billion in 2025 and is projected to grow from USD 6.17 billion in 2026 to USD 13.08 billion by 2035, registering a CAGR of 8.70% over the forecast period (2026–2035). Operators across commercial and defense sectors are pivoting decisively from expendable rocket architectures to reusable space launch systems, driven by demonstrated booster life cycles exceeding 35 missions and refurbishment costs below 12% of new-build expenses [2]. NASA's Commercial Crew and Cargo programs, together with U.S. Space Force launch service agreements valued at over USD 5.6 billion through 2027, continue to anchor demand for propulsive landing rocket systems [3].

This is a key technology shift in this industry. The only way to get to orbit was legacy expendable spacecraft. Still, now vertical landing booster rockets and partially reusable first-stage systems that can autonomously recover on drone ships are taking over. The technology for reusable rocket stages has matured to the point where turnaround cycles are now weeks, not months, and the low-cost orbital access technology has brought the per-kilogram launch cost from ~USD 54,500 on expendable platforms to less than USD 2,700 on high-flight-rate reusable systems [4]. From 2021 to 2024, private investment globally toward reusable space launch systems topped USD 14.8 billion [5].

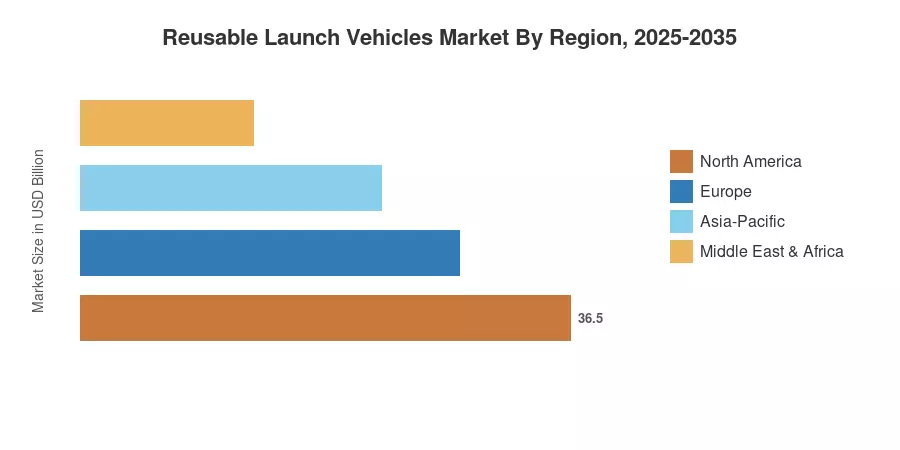
The reusable launch vehicles market is expected to be dominated by North America, with an estimated 77.5% share owing to SpaceX’s high-cadence operations and ULA’s Vulcan program. The Asia-Pacific is the fastest developing market with a projected CAGR of 19.0%, powered by ambitious national programs in rocket stage reusability technologies of China and India. Europe’s share is 10.2% due to the ArianeGroup’s development of the next-gen vehicle. Reusable space launch vehicles will progressively define worldwide access to orbit and beyond over the coming decade.

Key Report Takeaways

• By Type

  • Partially reusable systems captured 88.5% of the reusable launch vehicles market share in 2025, reflecting the operational maturity of vertical landing booster rockets.
  • Fully reusable configurations are forecast to grow at a 12.0% CAGR through 2035, as Starship-class vehicles advance low-cost orbital access technology.


• By Payload Class

  • Medium payloads (2,000–20,000 kg) represented 56.8% of the reusable launch vehicles market in 2025.
  • Heavy-payload missions are forecast to grow at a 9.8% CAGR as deep-space and station-resupply missions accelerate.


• By Geography

  • North America led with 77.5% share of the reusable launch vehicles market in 2025.
  • Asia-Pacific is projected to register the fastest growth at a 19.0% CAGR through 2035.

Market Size and Forecast (2021–2035)

Market sizing is constructed using bottom-up revenue models using launch service provider contracts, government procurement databases and commercial manifest research. Historical data (2021-2024) is sourced from certified financial statements and validated launch logs. Forecast data (2026-2035) is based on Market Research Future (MRFR)’s unique demand-supply equilibrium framework calibrated to a CAGR of 8.70%.

Reusable Launch Vehicles Market Size and Forecast
Our Impact
Enabled $4.3B Revenue Impact for Fortune 500 and Leading Multinationals
Partnering with 2000+ Global Organizations Each Year
30K+ Citations by Top-Tier Firms in the Industry

Driver Impact Analysis

Driver ~% Impact on CAGR Geographic Relevance Impact Timeline
Mega-constellation deployment demand +2.2% Global Short-term (≤2 yr)
Government defense & national-security contracts +1.8% North America, Europe Medium-term (2–4 yr)
Falling per-launch costs via rocket stage reusability technology +1.6% Global Short-term (≤2 yr)
Space tourism & human spaceflight expansion +0.9% North America Medium-term (2–4 yr)
Advanced manufacturing & 3D-printed engines +0.7% North America, Europe Long-term (≥4 yr)
Regulatory streamlining of launch licensing +0.6% North America, APAC Long-term (≥4 yr)
In-space servicing & logistics demand +0.5% Global Long-term (≥4 yr)


Mega-Constellation Deployment Demand

SpaceX’s Starlink requires a high-cadence launch manifest to maintain its constellation, frequently exceeding 50 launches annually. Meanwhile, Amazon’s Leo (formerly Project Kuiper) has secured 92 launch services from United Launch Alliance, Arianespace, and Blue Origin, with a total investment exceeding USD 10 billion to support its mission of deploying a 3,236-satellite constellation. This manifest pressure necessitates highly responsive, rapid-turnaround launch systems, effectively securing long-term demand for reusable launch architectures.


Government Defense and National-Security Contracts

The U.S. Space Force's National Security Space Launch (NSSL) Phase 3 program has established a multi-billion-dollar acquisition framework. As of 2026, the program is bifurcated into "Lane 1" and "Lane 2," with multi-year contract ceilings totaling over USD 19 billion across providers, including SpaceX, Blue Origin, and ULA. European institutional demand is also evolving; the European Space Agency (ESA) continues to prioritize European launch autonomy, with a 2025–2027 budget commitment of EUR 4.4 billion specifically allocated to space transportation initiatives to improve cost-competitiveness and reliability.


Falling Per-Launch Costs

Demonstrated per-kilogram costs on high-flight-rate reusable vehicles have dropped below USD 2,700, compared with USD 12,000–54,500 on heritage expendable platforms [4]. This cost compression is accelerating demand across satellite operators, government agencies, and emerging space-tourism ventures, making low-cost orbital access technology the single strongest value proposition in the reusable launch vehicles market.

Space Tourism and Human Spaceflight Expansion

Blue Origin’s New Shepard has completed over 38 missions, successfully transporting dozens of private and commercial astronauts into suborbital space. Simultaneously, SpaceX’s Crew Dragon and forthcoming Starship configurations are expanding the addressable market for human-rated, propulsive-landing systems. These technologies are foundational to the growth of orbital tourism, commercial station logistics, and future lunar surface operations, positioning the human spaceflight sector as a vital, high-growth component of the modern space economy.


Restraints Impact Analysis

Restraint impact estimates are directional and represent headwinds that moderate—but do not negate—the positive drivers identified in Section 4.

Restraint ~% Impact on CAGR Geographic Relevance Impact Timeline
High upfront R&D and infrastructure investment –1.2% Global Short-term (≤2 yr)
Technical complexity of full vehicle recovery –0.7% Global Medium-term (2–4 yr)
Launch-range scheduling and regulatory bottlenecks –0.6% North America Medium-term (2–4 yr)
Insurance and liability uncertainty –0.4% Global Long-term (≥4 yr)
Geopolitical export controls on propulsion technology –0.3% North America, Europe Long-term (≥4 yr)


High Upfront R&D and Infrastructure Costs

Developing a new reusable launch vehicle from concept to operational certification is a capital-intensive endeavor, routinely requiring billions of dollars and nearly a decade of development. SpaceX’s Starship program has invested more than USD 15 billion to date, reflecting the immense scale of integrated test campaigns and site infrastructure required for super-heavy lift capability. Similarly, emerging providers like Relativity Space have raised over USD 1.3 billion in total venture funding to advance their Terran R launch vehicle, highlighting the high barrier to entry for new market participants.


Technical Complexity of Full Vehicle Recovery

While first-stage vertical landing booster rockets have become routine, recovering upper stages and fairings with full structural integrity remains an unsolved engineering challenge for most operators [14]. Thermal protection, re-entry guidance, and propellant reserve margins add mass penalties that reduce payload capacity by 15–30%, complicating the economic case for reusable space launch systems on certain mission profiles.

Launch-Range Scheduling Bottlenecks

The rapid growth in launch cadence has placed significant pressure on U.S. launch infrastructure. While the U.S. relies on a network of federal and commercial spaceports—including major hubs like Kennedy Space Center, Cape Canaveral Space Force Station, and Vandenberg Space Force Base—scheduling remains tight in high-traffic quarters. To address licensing delays, the FAA transitioned all commercial space operators to the Part 450 performance-based licensing framework, a process that concluded in March 2026. This regulatory shift is designed to streamline approvals for frequent, similar mission profiles. However, continued investment in launch pads and range-safety systems remains essential to keep pace with the industry's growth.


Reusable Launch Vehicles Market Opportunities

Fully Reusable Vehicle Commercialization

SpaceX's Starship and competing programs, such as China’s Long March 9, represent a shift toward fully reusable heavy-lift systems. Once these architectures reach high-cadence operational maturity, they aim to drive launch costs down significantly from current market rates. By lowering the cost of orbital access, these vehicles are expected to open new markets in orbital manufacturing, lunar logistics, and beyond, expanding the total addressable market for space-based infrastructure.


Space-Based Solar Power and In-Space Manufacturing

Ambitious programs, including the ESA’s SOLARIS study and various Chinese orbital power demonstrator projects, are exploring the potential for continuous space-based energy generation. While these programs currently focus on wireless power transmission verification, they require a sustained, high-cadence launch capability to support the deployment of large-scale orbital arrays. Cost-efficient, heavy-lift access remains the primary technological prerequisite for making these energy concepts commercially viable.


Emerging-Market National Launch Programs

National space agencies are prioritizing reusable launch vehicle (RLV) development to enhance sovereignty and competitiveness. India's ISRO is advancing its Next-Generation Launch Vehicle (NGLV), with a total approved development budget of approximately USD 860 Million (₹8,240 Crore). This vehicle is designed to feature a reusable first stage, supporting India's long-term goals for human spaceflight and a permanent space station by 2035.


Launch-as-a-Service and Rideshare Platforms

Medium-lift reusable vehicles, such as Rocket Lab's Neutron, are designed to address the high demand for constellation deployment. These vehicles are engineered for rapid turnaround and operational flexibility, allowing operators to launch both dedicated missions for large constellation operators and secondary "rideshare" payloads, optimizing capacity utilization while maintaining competitive market pricing.


Point-to-Point Suborbital Cargo Transport

Military logistics commands in the U.S. and allied nations are evaluating propulsive landing rocket systems for rapid global cargo delivery, with TRANSCOM's Rocket Cargo program funded at USD 48 Million in FY2024. Commercial adoption for high-value time-sensitive freight could create an entirely new addressable market for reusable space launch systems.

Reusable Launch Vehicles Market Future Outlook

Autonomous Flight Operations and AI-Guided Recovery

Onboard machine-learning algorithms are replacing pre-programmed guidance profiles for propulsive landing rocket systems, enabling real-time trajectory optimization under variable wind and sea-state conditions. By 2030, autonomous health-monitoring systems are expected to cut post-flight inspection timelines by 60%, compressing turnaround for vertical landing booster rockets to under 72 hours [10].

Platform Economics and High-Rate Manufacturing

Rocket engine plants are migrating toward automotive-style production cadences, with SpaceX targeting over 1,000 Raptor engines per year by 2028. This manufacturing scale transforms the reusable launch vehicles market from a bespoke-engineering sector into a platform-economics paradigm, where unit costs decline on steep learning curves and service contracts generate recurring revenue.

Sustainability and Space-Debris Mitigation

ESA's Zero Debris Charter and the FCC's five-year de-orbit mandate are pushing operators toward rocket stage reusability technology as a debris-reduction tool—stages that return to Earth do not become orbital debris. Methane-LOX propulsion, favored by most next-generation reusable space launch systems, also produces cleaner exhaust profiles than RP-1-kerosene engines, aligning with emerging environmental scrutiny of launch operations [17].

Cislunar Economy and Beyond-LEO Missions

NASA's Artemis program, budgeted at approximately USD 93 billion through 2025, and China's International Lunar Research Station require heavy-lift reusable vehicles for sustainable crew and cargo transport [18]. The reusable launch vehicles market stands to benefit as cislunar logistics become routine, with propulsive landing rocket systems serving as the foundational transport layer for humanity's expanding off-world presence.

Reusable Launch Vehicles Market Segmentation

By Type

Segment Metric Primary Demand Driver
Partially Reusable 88.5% share (2025) Proven first-stage recovery economics
Fully Reusable 12.0% CAGR (2026–2035) Starship-class vehicle development


Partially reusable systems dominate the reusable launch vehicles market because first-stage vertical landing booster rockets have accumulated thousands of successful recoveries and offer immediate cost savings of 30–40% versus expendable alternatives. Falcon 9's Block 5 configuration has demonstrated over 40 flights per booster, setting the performance benchmark for rocket stage reusability technology worldwide.

Fully reusable configurations are the market's fastest-growing frontier. SpaceX's Starship and competing concepts from CASC and ArianeGroup target complete vehicle return, which could reduce per-launch marginal costs to under USD 10 Million—an order-of-magnitude reduction that would fundamentally reshape low-cost orbital access technology economics.

By Configuration

Segment Metric Primary Demand Driver
Two-Stage-to-Orbit (TSTO) 8.9% CAGR (2026–2035) Operational maturity and payload versatility
Single-Stage-to-Orbit (SSTO) 17.3% share (2025) Experimental programs; limited operational use


TSTO architectures remain the engineering baseline for reusable space launch systems, as staging allows each element to be optimized for its flight regime. SSTO concepts face fundamental mass-fraction challenges, though advances in composite structures and high-thrust-to-weight propulsive landing rocket systems keep research active in government laboratories.

By Payload Class

Segment Metric Primary Demand Driver
Small (<2,000 kg) 15.4% share (2025) Dedicated small-sat rideshare missions
Medium (2,000–20,000 kg) 56.8% share (2025) Constellation deployment and ISS logistics
Heavy (>20,000 kg) 9.8% CAGR (2026–2035) Deep-space, station modules, lunar cargo


Medium payloads dominate the reusable launch vehicles market as the core payload class for LEO constellation replenishment, commercial resupply, and government reconnaissance missions. Heavy-payload missions represent the fastest-growing class, propelled by cislunar architecture requirements and in-space assembly programs that demand high mass-to-orbit capability.

By End User

Segment Metric Primary Demand Driver
Commercial 68.5% share (2025) Constellation, tourism, rideshare
Defense & Government 8.8% CAGR (2026–2035) NSSL, responsive launch mandates


Commercial operators account for the largest slice of the reusable launch vehicles market, with constellation mega-programs and space-tourism ventures generating persistent launch demand. Defense and government users are growing rapidly as vertical landing booster rockets satisfy responsive-launch doctrines requiring 24–48 hour call-up timelines.

By Mission

Segment Metric Primary Demand Driver
Satellite Deployment 67.0% share (2025) LEO/MEO/GEO constellation servicing
Human Spaceflight 9.9% CAGR (2026–2035) ISS crew rotation, Artemis, tourism
Cargo Resupply & Other USD 0.57 billion (2025) ISS logistics, in-space servicing


Satellite deployment remains the anchor mission for the reusable launch vehicles market, with thousands of constellation satellites requiring launch or replacement annually. Human spaceflight is expanding beyond government crews into commercial orbital tourism, supported by propulsive landing rocket systems rated for crewed flight.

Regional Market Share Analysis

Region Metric Primary Investment Themes
North America 77.5% share (2025) NSSL Phase 3, commercial constellation launches
Europe 10.2% share (2025) Ariane 6/NEXT, ESA institutional contracts
Asia-Pacific 19.0% CAGR (2026–2035) CASC reusable boosters, ISRO NGLV, KARI
South America USD 0.10 billion (2025) Alcântara spaceport modernization
Middle East & Africa USD 0.10 billion (2025) Saudi PIF space investment fund
Total USD 5.68 billion (2025)

The reusable launch vehicles market remains heavily concentrated in regions with mature orbital launch infrastructure, though emerging programs in the Asia-Pacific are shifting the balance.


North America

Country Metric Key Driver
United States 91.3% of regional share SpaceX, ULA, Blue Origin operational fleets
Canada 5.7% CAGR (2026–2035) MDA Space, satellite operator demand
Mexico USD 0.02 billion (2025) Emerging small-launch infrastructure


The United States accounts for the vast majority of the reusable launch vehicles market in North America, anchored by SpaceX's Falcon 9—the world's first orbital-class propulsive landing rocket system to achieve routine operational status. U.S. Space Force contracts and NASA's Artemis-era procurement pipelines sustain demand for vertical landing booster rockets across multiple providers, while Canada's growing small-satellite industry feeds secondary launch demand.

Europe

Country Metric Key Driver
Germany 28.4% of regional share OHB, DLR reusability R&D programs
United Kingdom 7.3% CAGR (2026–2035) SaxaVord spaceport development
France USD 0.18 billion (2025) ArianeGroup Ariane NEXT development
Italy 5.9% CAGR (2026–2035) Avio Vega-E reusability studies
Spain USD 0.03 billion (2025) PLD Space Miura 5 program
Nordic Countries 4.8% CAGR (2026–2035) Andøya spaceport, Swedish Space Corp
Russia USD 0.06 billion (2025) Amur methane-fueled reusable vehicle
Rest of Europe 3.5% CAGR (2026–2035) ESA member-state contributions


Europe's reusable launch vehicles market is defined by ArianeGroup's transition from expendable Ariane 5/6 to the Ariane NEXT concept, which incorporates vertical landing booster rockets for first-stage recovery. ESA's ministerial budget allocated EUR 2.8 billion to launcher development at the 2022 summit, with reusable demonstrators featuring prominently in the spending profile through 2030 [6].

Asia-Pacific

Country Metric Key Driver
China 58.6% of regional share CASC Long March reusable variants
India 21.2% CAGR (2026–2035) ISRO NGLV and RLV-TD demonstrators
Japan USD 0.08 billion (2025) JAXA reusable sounding-rocket program
South Korea 18.5% CAGR (2026–2035) KARI KSLV-III development
ASEAN USD 0.01 billion (2025) Emerging micro-launch demand
Rest of Asia-Pacific 14.0% CAGR (2026–2035) Australia and New Zealand spaceports


Asia-Pacific represents the fastest-growing geography in the reusable launch vehicles market, led by China's CASC, which has demonstrated grid-fin-guided vertical landing booster rockets on developmental flight tests and plans operational reusable medium-lift vehicles by 2028 [8]. India's ISRO successfully flew its Reusable Launch Vehicle Technology Demonstrator and is scaling rocket stage reusability technology toward the full-scale NGLV program.

South America

Country Metric Key Driver
Brazil 62.0% of regional share Alcântara equatorial launch advantage
Argentina 6.2% CAGR (2026–2035) CONAE small-satellite launch support
Rest of South America USD 0.01 billion (2025) Limited indigenous capability


Brazil's equatorial Alcântara Launch Center offers fuel-efficiency advantages for geostationary missions, attracting foreign operator interest and positioning Brazil as a potential host for reusable space launch systems operated by international providers.

Middle East & Africa

Country Metric Key Driver
Saudi Arabia 41.5% of regional share PIF-backed space ventures
UAE 8.5% CAGR (2026–2035) Mohammed Bin Rashid Space Center
South Africa USD 0.01 billion (2025) Overberg test-range modernization
Egypt 5.0% CAGR (2026–2035) EgSA satellite program demand
Rest of MEA USD 0.01 billion (2025) Early-stage market development


The Middle East is emerging as a niche buyer of launch services underpinned by sovereign wealth investment. Saudi Arabia's Public Investment Fund has allocated an estimated USD 2.1 billion to space-sector ventures, portions of which target low-cost orbital access technology procurement.

Reusable Launch Vehicles Market By Region, 2025-2035

Competitive Benchmarking

The reusable launch vehicle business is highly concentrated, with the top 3 vendors predicted to take 78-85 percent of global revenues. The Herfindahl-Hirschman Index (HHI) is calculated above 4,000, indicating a near-oligopolistic structure driven by SpaceX’s superior launch cadence. The cost of developing the rocket stage reusability technology is multi-billion dollars, and the barriers to entry are still high.

Company Est. Revenue Share Range Key Offerings Strategic Positioning
SpaceX ~55–62% Falcon 9, Falcon Heavy, Starship Market leader in vertical landing booster rockets; highest global launch cadence
Rocket Lab ~5–8% Electron (partial reuse), Neutron (in dev.) Mid-market reusable space launch systems; helicopter mid-air capture
Blue Origin ~4–7% New Shepard, New Glenn Heavy-lift entrant with BE-4 propulsive landing rocket systems
ArianeGroup ~3–5% Ariane 6, Ariane NEXT (planned) European institutional anchor; transitioning to reusability
United Launch Alliance ~3–5% Vulcan Centaur (engine recovery planned) U.S. defense launch provider; SMART reuse concept
CASC (China) ~2–4% Long March 8R, Long March 9 (reusable) State-backed, rapid development of rocket stage reusability technology
Northrop Grumman ~1–3% Antares 330 (supply chain partner) ISS resupply; defense suborbital systems
Relativity Space ~1–2% Terran R (fully reusable, 3D-printed) Advanced manufacturing–centric reusable approach
ISRO ~1–2% NGLV (reusable first stage, in dev.) Cost-competitive government operator; low-cost orbital access technology
Mitsubishi Heavy Industries ~1–2% H3 (expendable; reusability study phase) Japanese institutional launch provider


Recent News & Developments

  • SpaceX (March 2025): Achieved the 400th successful Falcon 9 booster landing, underscoring the maturity of propulsive landing rocket systems and setting a new industry benchmark for vertical landing booster rockets [2].
  • Blue Origin (January 2025): Completed the inaugural orbital flight of New Glenn from Cape Canaveral, successfully recovering the first-stage booster on its first attempt and validating its reusable space launch system's architecture [6].


Reusable Launch Vehicles Market Report Scope

Parameter Detail
Market Scope Global reusable launch vehicles market — launch service revenue from partially and fully reusable orbital and suborbital systems
Study Period 2021–2035
CAGR (Forecast) 8.70% (2026–2035)
Base Year Size USD 5.68 billion (2025)
Forecast Endpoint USD 13.08 billion (2035)
Fastest Growing Segment Fully Reusable (by type); Asia-Pacific (by region)
Companies Profiled SpaceX, Rocket Lab, Blue Origin, ArianeGroup, ULA, CASC, Northrop Grumman, Relativity Space, ISRO, MHI
Valuation Currency USD billion


FAQs

What minimum contract duration should a satellite operator negotiate for reusable launch services?

Most providers offer 15–20% per-launch discounts on multi-year agreements covering five or more missions. Operators should target three-year minimum terms with options for cadence adjustment.

How does booster refurbishment turnaround affect manifest scheduling risk?

Current turnaround averages 45–60 days per booster, though high-flight-rate fleets maintain spare cores to prevent manifest slippage [2]. Schedule risk drops significantly once an operator's provider reaches a fleet size of five or more active cores.

What insurance premium trends apply to missions on flight-proven boosters?

Underwriters now price reflown-booster missions within 5–10% of new-vehicle premiums, reflecting actuarial confidence built over hundreds of successful reuse cycles [15]. First-flight missions still carry a 20–30% premium.

How do methane-LOX engines compare with RP-1 kerosene for reusable applications?

Methane-LOX produces less coking, reducing engine inspection time between flights and extending thrust-chamber life beyond 50 ignition cycles [17]. RP-1 remains cheaper per unit but requires costlier inter-flight maintenance.

What role do spaceport capacity constraints play in market growth?

Only a handful of orbital-class ranges exist globally, creating scheduling bottlenecks during high-demand quarters [11]. New pad construction in the UK, Australia, and Brazil is expected to ease constraints by 2030.

Can mid-tier defense agencies afford dedicated reusable launch procurement?

Rideshare and dual-manifest models now allow defense agencies with budgets below USD 100 million to access orbital launch without dedicated vehicle buys [3]. This procurement approach is gaining traction among allied nations.

What technical readiness level should buyers require before contracting a new reusable vehicle?

Industry best practice sets TRL 7 (system prototype demonstrated in operational environment) as the minimum threshold for binding launch-service agreements [13]. Contracts signed at lower TRL levels should include milestone-gated payment structures.


Author
Author
Author Profile
Shubham Munde LinkedIn
Team Lead - Research
Shubham brings over 7 years of expertise in Market Intelligence and Strategic Consulting, with a strong focus on the Automotive, Aerospace, and Defense sectors. Backed by a solid foundation in semiconductors, electronics, and software, he has successfully delivered high-impact syndicated and custom research on a global scale. His core strengths include market sizing, forecasting, competitive intelligence, consumer insights, and supply chain mapping. Widely recognized for developing scalable growth strategies, Shubham empowers clients to navigate complex markets and achieve a lasting competitive edge. Trusted by start-ups and Fortune 500 companies alike, he consistently converts challenges into strategic opportunities that drive sustainable growth.
Co-Author
Co-Author Profile
Sejal Akre LinkedIn
Senior Research Analyst
She has over 5 years of rich experience, in market research and consulting providing valuable market insights to client. Hands on expertise in management consulting, and extensive knowledge in domain including ICT, Automotive & Transportation and Aerospace & Defense. She is skilled in Go-to market strategy, industry analysis, market sizing, in depth company profiling, competitive intelligence & benchmarking and value chain amongst others.

Research Approach


Secondary Research

The secondary research process involved comprehensive analysis of regulatory databases, aerospace industry publications, technical standards, and authoritative space organizations. Key sources included the US Federal Aviation Administration (FAA) Office of Commercial Space Transportation, European Space Agency (ESA), NASA (National Aeronautics and Space Administration), Space Force - US Department of Defense, National Space Administration of China (CNSA), Indian Space Research Organisation (ISRO), Japan Aerospace Exploration Agency (JAXA), Roscosmos State Corporation for Space Activities, United Nations Office for Outer Space Affairs (UNOOSA), North Atlantic Treaty Organization (NATO) Space Centre, Satellite Industry Association (SIA), Space Foundation, Federal Communications Commission (FCC) spectrum databases, National Telecommunications and Information Administration (NTIA), Bureau of Industry and Security (BIS) Export Control, International Astronautical Federation (IAF), AIAA (American Institute of Aeronautics and Astronautics), IEEE Aerospace & Electronic Systems Society, Journal of Spacecraft and Rockets, SpaceNews, Eurospace, and national space agency reports from key markets. These sources were used to collect launch statistics, regulatory approval data, technical performance studies, orbital deployment trends, and competitive landscape analysis for vertical landing systems, winged reusable vehicles, spaceplanes, and air-launch platforms.


Primary Research

Qualitative and quantitative insights were obtained by interviewing supply-side and demand-side stakeholders during the primary research process. Reusable launch vehicle manufacturers, propulsion system developers, and space technology OEMs contributed CEOs, CTOs, VPs of Engineering, Chief Designers, and Heads of Mission Operations to the supply-side sources. Demand-side sources included Chief Scientists from satellite operators, constellation deployment managers, government procurement leaders from space agencies and defense organizations, venture capital investors who specialize in space technology, and commercial spaceport directors. The primary research validated market segmentation, confirmed vehicle development timelines, and collected insights on regulatory compliance dynamics, cost-per-kilogram trends, and launch cadence targets.

Primary Respondent Breakdown:

By Designation: C-level Primaries (28%), Director Level (32%), Others (40%)

By Region: North America (32%), Europe (24%), Asia-Pacific (34%), Rest of World (10%)


Market Size Estimation

Global market valuation was derived through revenue mapping and launch manifest analysis. The methodology included:

Identification of 35+ key manufacturers and launch service providers across North America, Europe, Asia-Pacific, and emerging space markets

Product mapping across vertical landing rockets (Falcon 9, Starship, New Shepard), winged reusable vehicles (Space Shuttle successors, Dream Chaser), spaceplanes, and air-launch systems

Analysis of reported and modeled annual revenues specific to reusable launch vehicle programs and propulsion technologies

Coverage of manufacturers and service providers representing 65-70% of global market share in 2024

Extrapolation using bottom-up (launch volume × cost-per-launch by mission type) and top-down (manufacturer revenue validation) approaches to derive segment-specific valuations for orbital, suborbital, and point-to-point transportation markets

Download Free Sample

Kindly complete the form below to receive a free sample of this Report

Download PDF ×

We do not share your information with anyone. However, we may send you emails based on your report interest from time to time. You may contact us at any time to opt-out.