


Ride Sharing Size
Market Size Snapshot
| Year | Value |
|---|---|
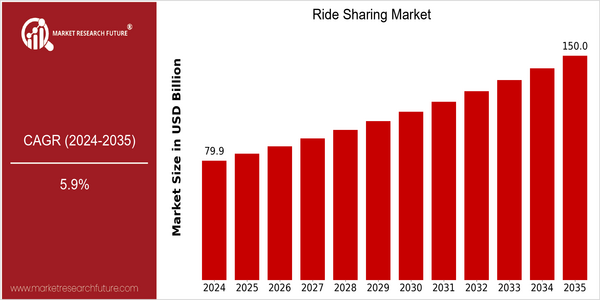
| 2024 | USD 79.88 Billion |
| 2035 | USD 150.0 Billion |
| CAGR (2025-2035) | 5.9 % |
Note – Market size depicts the revenue generated over the financial year
The global ride-hailing market is set to soar. In 2024, it’s estimated to reach $79 billion, and by 2035, that figure is expected to jump to $158 billion. The annual compound growth rate for the entire period is 5.9 per cent, indicating a very robust expansion in the industry. The key growth drivers are rising urbanization, rising fuel costs and the growing preference for shared mobility. In addition, technological developments such as the introduction of mobile applications and the use of GPS have made the service more accessible and efficient, which is further bolstering its popularity. In the meantime, the big players such as Uber, Lyft and Didi Chuxing are investing heavily in technological solutions and strategic alliances to strengthen their offerings and further expand their market share. For instance, the recent move by Uber to introduce electric vehicles into its fleet and to partner with public transportation systems are two examples of how the ride-hailing companies are adapting to the evolving mobility landscape.
Regional Market Size
Regional Deep Dive
The ride-hailing market is experiencing a dynamic growth in different regions, driven by technological advances, changing consumer preferences, and regulatory frameworks. In North America, the market is characterized by a high adoption of mobile technology and a strong demand for convenience, while Europe is experiencing an increase in regulatory frameworks, aimed at ensuring safety and security. The Asia-Pacific region is growing rapidly, as urbanization and the growing middle class drive demand. The Middle East and Africa are experiencing innovation, as local needs are being addressed through local solutions. Latin America, with its own unique socio-economic challenges, is also adapting ride-hailing models to fit its diverse markets. The combination of these factors is driving significant growth across all regions.
Europe
- The European Union's stringent regulations on emissions are prompting ride-sharing companies to transition to electric fleets, with companies like Bolt and Free Now leading the charge in several major cities.
- Innovative partnerships between ride-sharing platforms and public transportation systems, such as the collaboration between Uber and local transit authorities in London, are enhancing mobility solutions and reducing congestion.
Asia Pacific
- In countries like India, the rise of local players such as Ola is challenging global giants, with unique offerings tailored to local preferences, including auto-rickshaw ride-sharing.
- The rapid urbanization in cities like Jakarta and Bangkok is driving demand for ride-sharing services, leading to increased competition and innovation in service delivery.
Latin America
- In Brazil, the ride-sharing market is witnessing significant growth due to the increasing smartphone penetration and urban mobility challenges, with companies like 99 and Uber competing fiercely.
- Regulatory changes in countries like Mexico are creating a more structured environment for ride-sharing operations, which is expected to enhance safety and service quality.
North America
- The introduction of new regulations in cities like New York and San Francisco is pushing ride-sharing companies to adopt more sustainable practices, such as electric vehicle integration, which is expected to reshape operational models.
- Companies like Uber and Lyft are investing heavily in autonomous vehicle technology, with pilot programs underway that could revolutionize the ride-sharing experience and reduce operational costs.
Middle East And Africa
- In the UAE, the government is promoting ride-sharing through initiatives like the Dubai Autonomous Transportation Strategy, which aims to have 25% of all transportation in Dubai be autonomous by 2030.
- Local companies such as Careem are adapting their services to cater to cultural preferences, including women-only ride options, which is expected to enhance user trust and expand their customer base.
Did You Know?
“In 2022, it was estimated that ride-sharing services accounted for over 20% of all urban transportation in major cities worldwide, highlighting their growing importance in urban mobility.” — example.com
Segmental Market Size
The Ride-Hailing industry is growing fast, driven by urbanization and the trend towards on-demand transport. The need for cheap mobility and the awareness of the environment have led to a shift from private car ownership to shared transport. Regulatory policies are also becoming increasingly favorable to Ride-Hailing, enhancing its appeal. The current stage of development of Ride-Hailing is that of mass adoption. In North America, the industry is dominated by companies such as Uber and Lyft, while in China it is by Didi Chuxing. The most important applications are urban commuting, airport transfers, and last-mile delivery. There are also services aimed at specific customer groups, such as senior citizens or women. Growth is being further fueled by the drive towards electric vehicles and the introduction of new regulations on emissions. The use of mobile applications and GPS navigation is improving the experience for users and boosting the industry’s operational efficiency.
Future Outlook
Ride-hailing services are projected to grow from $ 79.88 billion in 2024 to $ 150 billion in 2035, with a CAGR of 5.9 percent. The trend is based on the trend of urbanization, the shift towards sharing mobility, and the demand for convenient and cost-effective transportation. Ride-hailing services will account for 20 percent of urban travel in 2035, driven by the integration of artificial intelligence and machine learning. , the improvement of service quality, and the efficiency of operation. The rise of self-driving vehicles and the improvement of smart phone applications will change the ride-hailing industry. The government's support for reducing carbon emissions and promoting sustainable development will also accelerate the development of the industry. Electric vehicles are also expected to be added to the car-hailing fleet. The use of micro-mobility, such as e-scooters and e-bikes, will also attract more people. Adapt to the trend, and take advantage of the data to optimize the service, and they will be able to share the market.


Leave a Comment