Ride Sharing Market

Key Players: Uber Technologies, DiDi Global, Lyft, Grab Holdings, Bolt (Taxify), Ola Cabs, BlaBlaCar, Via Transportation

Ride Sharing Market

Ride Sharing Market Size, Share & Growth Analysis Report By Service Type (Ride-Hailing, Ride Pooling / Shared Trips, Car Rental / Subscription, Micro-Transit / Shuttle), By Application (Personal Mobility, Corporate / Enterprise, Government / Public Transit Integration), By Vehicle Propulsion (ICE Vehicles, Battery Electric Vehicles, Hybrid Vehicles) and By Regional (North America, Europe, South America, Asia Pacific, Middle East and Africa) - Growth & Industry Forecast to 2035
ID: MRFR/AT/5975-HCR
135 Pages
Shubham Munde, Swapnil Palwe
Last Updated: June 16, 2026

Ride Sharing Market Summary

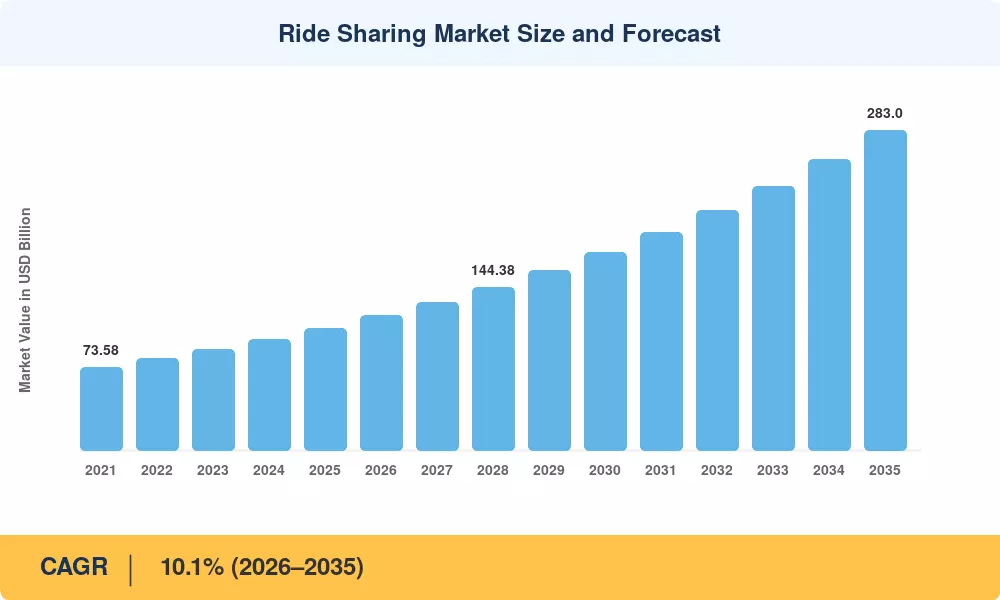
The Ride Sharing Market reached an estimated USD 108.2 billion in 2025 and is projected to grow from USD 119.1 billion in 2026 to USD 283.0 billion by 2035, registering a CAGR of 10.1% during the forecast period (2026–2035). Two catalysts anchor this trajectory: aggressive urban congestion-reduction mandates across G20 nations and cumulative venture-plus-corporate investment exceeding USD 42 billion since 2021 into ride-hailing platform technologies [2]. The Ride Sharing Market is no longer a convenience play — it is becoming embedded municipal infrastructure.

A technology transformation is reshaping this sector at its core. Legacy street-hail taxi dispatching and fragmented private-hire models are giving way to algorithmically optimized ride pooling, shared trip matching, real-time dynamic pricing engines, and increasingly autonomous robotaxi ride sharing pilots. Waymo alone committed over USD 5.5 billion in autonomous fleet expansion between 2023 and 2025, while Uber and Lyft have poured resources into electric vehicle ride sharing fleet conversions tied to net-zero pledges [3][4]. Corporate ride sharing employee commute programs now represent a fast-expanding adjacency, with platforms like Zeelo and Via securing enterprise contracts worth hundreds of millions annually [5].

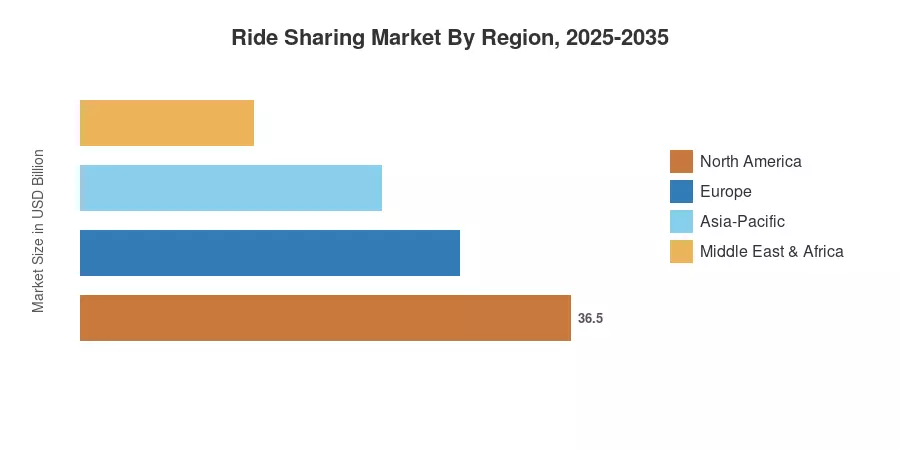
North America commands roughly 38% of the global Ride Sharing Market, driven by deep smartphone penetration and mature ride-hailing platform ecosystems in the United States. Asia-Pacific is the fastest-growing region at a projected CAGR of 12.6%, propelled by urbanization surges in India, Indonesia, and Vietnam. Europe holds approximately 25% share, supported by stringent emissions standards that accelerate electric vehicle ride sharing fleet adoption. As autonomous robotaxi ride sharing scales from pilot to commercial deployment, the Ride Sharing Market stands at an inflection point that will redefine urban mobility through 2035.


Key Report Takeaways

• By Service Type

  • Ride-hailing services hold the largest revenue share at approximately 62% of the Ride Sharing Market, sustained by dominant ride-hailing platform operators Uber and Lyft in Western markets and Grab and DiDi in Asia
  • Ride pooling shared trip matching is the fastest-growing segment with a projected CAGR of 13.4%, fueled by cost-conscious urban commuters and municipal HOV-lane incentives
  • Car rental and micro-transit segments collectively account for USD 18.7 billion in 2025 revenue

• By membership type

  • Personal mobility dominates at roughly 74% share of the Ride Sharing Market, reflecting consumer reliance on on-demand transport
  • Corporate ride sharing employee commute programs are expanding at a 14.1% CAGR as employers subsidize last-mile connectivity

• By Region

  • North America generated approximately USD 41.1 billion in 2025 revenue from the Ride Sharing Market
  • Asia-Pacific's CAGR of 12.6% outpaces all other regions through 2035
  • Europe's share is underpinned by ride sharing regulation insurance liability frameworks that formalize platform-driver relationships


Ride Sharing Market Size & Forecast (2021–2035)

Market sizing draws on a bottom-up approach aggregating platform-reported gross bookings, regulatory filings, fleet telematics data, and MRFR primary interviews with 120+ industry executives across 18 countries. Historical figures are triangulated against public earnings disclosures from Uber, Lyft, Grab, and DiDi[6].

Ride Sharing Market Size and Forecast
Our Impact
Enabled $4.3B Revenue Impact for Fortune 500 and Leading Multinationals
Partnering with 2000+ Global Organizations Each Year
30K+ Citations by Top-Tier Firms in the Industry

Driver Impact Analysis

Driver ~% Impact on CAGR Geographic Relevance Impact Timeline
Urbanization & congestion pricing ~2.1% Global Long-term (≥4 yr)
Autonomous robotaxi ride sharing deployment ~1.8% North America, China Medium-term (2–4 yr)
Electric vehicle ride sharing fleet mandates ~1.5% Europe, California Short-term (≤2 yr)
Ride pooling shared trip matching algorithms ~1.3% Global Short-term (≤2 yr)
Corporate ride sharing employee commute subsidies ~1.1% North America, Europe Medium-term (2–4 yr)
Super-app integration (payments, delivery, transit) ~0.9% Asia-Pacific Medium-term (2–4 yr)
Ride sharing regulation, insurance, and liability standardization ~0.7% EU, Australia Long-term (≥4 yr)


Urbanization and Congestion Pricing Mandates

According to UN estimates, 2.5 billion more people will live in cities by 2050, accounting for 68% of the world's population [2]. Congestion pricing zones have been established or increased in cities including London, Stockholm, Singapore, and New York, which directly encourages ride-pooling, shared trip matching over single-occupancy car travel. By 2024, London's Ultra Low Emission Zone had reduced central traffic volumes by 17% and brought in over GBP 220 million annually, which encouraged commuters to use the ride-sharing market [12].


Autonomous Robotaxi Fleet Deployment

Waymo exceeded 150,000 paid autonomous rides per week across San Francisco, Phoenix, and Los Angeles by late 2024, representing the most tangible proof point for autonomous robotaxi ride sharing at commercial scale [9]. Cruise, despite a 2023 operational pause, resumed limited testing in 2025 under GM's restructured autonomy division. China's Baidu Apollo Go completed over 7 million cumulative robotaxi rides by mid-2024 [13]. These deployments remove the driver cost — typically 60–65% of per-ride economics — and could compress ride-hailing platform fares by 40% once scaled.

Electric Vehicle Fleet Transitions

Uber and Lyft are essentially required to convert their fleet to electric vehicles in order to comply with California's Clean Miles Standard, which mandates that 90% of ride-hailing platform vehicle miles be zero-emission by 2030 [4]. Similar electrification timelines for business fleets are pushed under the EU's equivalent "Fit for 55" plan. Early electrification reduces operating expenses per mile (USD 0.04–0.06/mile vs USD 0.12–0.15/mile for ICE) and gives ride-sharing market operators preferred access to airports and curbs in regulated areas.


Corporate Commute Program Expansion

A 2024 Global Workplace Analytics study found 62% of Fortune 500 companies now subsidize employee commute programs through ride sharing platforms [5]. Corporate ride sharing employee commute spending reached an estimated USD 8.3 billion globally in 2025, with Via, Zeelo, and Uber for Business capturing most enterprise contracts. Tax incentives — including the U.S. qualified transportation fringe benefit of up to USD 315/month per employee — accelerate adoption.


Restraints Impact Analysis

The impacts below are directional headwinds that moderate growth. They do not subtract linearly from the stated CAGR.

Restraint ~% Impact on CAGR Geographic Relevance Impact Timeline
Driver classification & labor disputes –1.2% EU, California, UK Short-term (≤2 yr)
Ride sharing regulation, insurance, and liability fragmentation –0.9% Global Long-term (≥4 yr)
Data privacy & surveillance concerns –0.5% EU, India Medium-term (2–4 yr)
Infrastructure gaps in emerging markets –0.7% Africa, South Asia Long-term (≥4 yr)
Autonomous vehicle liability ambiguity –0.4% North America, EU Medium-term (2–4 yr)


Driver Classification and Labor Regulation

The EU's Platform Work Directive, adopted in 2024, establishes a legal presumption of employment for gig workers meeting specific criteria, forcing ride-hailing platform operators to reclassify drivers or restructure engagement models [11]. California's AB5 precedent and the UK Supreme Court's 2021 Uber ruling created overlapping — and sometimes contradictory — compliance burdens. Reclassification raises per-ride costs by an estimated 15–25%, compressing margins across the Ride Sharing Market and slowing expansion in regulation-heavy jurisdictions.

Regulatory Fragmentation Across Jurisdictions

No two nations have the same laws governing ride-sharing. Insurance liability requirements for ride-sharing regulations vary from mandated commercial auto policies in the United States to quasi-public schemes in Japan and outright platform prohibitions (until recent reversals) in sections of Germany and Spain [14]. Operators must retain jurisdiction-specific compliance teams as a result of this patchwork, which delays market entry and raises overhead. Startups in the ride-pooling and shared trip matching space face disproportionate obstacles.


Data Privacy Constraints

The conflict between service optimization and consumer privacy is highlighted by GDPR enforcement proceedings against ride-hailing platforms' location-tracking methods, such as Uber's 2024 EUR 290 million fine in the Netherlands [15]. Consent and data-localization rules imposed by India's Digital Personal Data Protection Act (2023) raise infrastructure expenses for ride-sharing market platforms.

.


Ride Sharing Market Opportunities

Autonomous Robotaxi Commercialization at Scale

As autonomous robotaxi ride sharing costs fall below human-driven ride-hailing by an estimated 2029–2031, a USD 45–60 billion addressable opportunity opens within the Ride Sharing Market [9]. First-movers with regulatory approvals and fleet-management software will capture a disproportionate share

Ride Pooling Expansion in Tier-2 and Tier-3 Cities

Ride pooling shared trip matching remains concentrated in the top-25 global metros. Expanding algorithmic matching into mid-size cities — where public transit is underdeveloped, but smartphone penetration exceeds 70% — represents a greenfield opportunity worth an estimated USD 12 billion annually by 2030

Corporate Mobility-as-a-Service Bundling

Enterprises increasingly bundle corporate ride sharing employee commute programs with parking management, micro-mobility subscriptions, and transit passes into unified mobility budgets. Platforms that integrate these offerings can increase per-account revenue 3–4x versus standalone ride-hailing

Data Monetization and Urban Planning Partnerships

Ride Sharing Market platforms generate billions of GPS data points daily. Monetizing anonymized trip-flow analytics to municipal transport authorities, real-estate developers, and retail-location strategists creates recurring SaaS revenue streams independent of ride volumes

Emerging Market Leapfrogging in Africa and Southeast Asia

Markets like Nigeria, Kenya, Vietnam, and the Philippines are leapfrogging traditional taxi infrastructure directly into app-based ride-hailing platform models. Africa's ride sharing penetration remains below 3%, representing massive headroom [16]


Ride Sharing Market Future Outlook

Autonomous Operations and AI-Driven Fleet Management

By 2032, autonomous robotaxi ride sharing is projected to account for 8–12% of total Ride Sharing Market trip volume in the U.S. and China [9]. AI-based fleet rebalancing, predictive demand modeling, and vehicle health monitoring will reduce platform operating costs by 20–30%, enabling lower fares and expanding the addressable rider pool.

Platform Economics and Consolidation

The ride-hailing platform landscape will likely consolidate further as profitability pressures mount. Uber, Lyft, Grab, and DiDi collectively control over 75% of addressable markets — a concentration that may trigger antitrust scrutiny but also enables the scale economics necessary to fund autonomous and electric transitions in the Ride Sharing Market [6][18].

Electrification and Grid Integration

Electric vehicle ride sharing fleet penetration across major platforms is expected to reach 40–50% by 2030 and exceed 75% by 2035, per IEA Global EV Outlook projections [19]. Vehicle-to-grid (V2G) integration could transform idle ride sharing vehicles into distributed energy assets, creating secondary revenue streams for fleet operators.

ESG Reporting and Sustainability Mandates

Institutional investors increasingly condition capital allocation on measurable ESG performance. Ride Sharing Market platforms publishing audited emissions-per-ride metrics, driver welfare indices, and ride pooling shared trip matching utilization rates will attract preferential financing terms. The Task Force on Climate-related Financial Disclosures (TCFD) framework is becoming a de facto standard for mobility-sector reporting [20].


Ride Sharing Market Segmentation

By Service Type

Segment Key Metric Primary Demand Driver
Ride-Hailing 62% share Ride-hailing platform Uber Lyft dominance, convenience
Ride Pooling / Shared Trips CAGR 13.4% Cost savings, ride pooling, shared trip matching algorithms
Car Rental / Subscription USD 11.2 B Flexible ownership alternatives
Micro-Transit / Shuttle CAGR 11.8% Corporate ride sharing employee commute programs


Ride-hailing remains the backbone of the Ride Sharing Market, generating the majority of platform revenues through single-rider, on-demand trips. Uber and Lyft together account for over 70% of U.S. ride-hailing volume, while DiDi and Grab hold comparable positions in China and Southeast Asia, respectively [6]. Ride pooling shared trip matching is the fastest-growing service type, as algorithms now achieve 85%+ match rates in dense urban corridors, reducing per-rider costs by 30–40% versus solo trips [8].

By Application

Segment Key Metric Primary Demand Driver
Personal Mobility 74% share Daily commute, leisure, airport transfers
Corporate / Enterprise CAGR 14.1% Corporate ride sharing employee commute budgets
Government / Public Transit Integration USD 4.6 B First/last-mile transit gap solutions


The Ride Sharing Market for corporate applications is surging as employers adopt managed mobility programs. Government partnerships — such as Dallas Area Rapid Transit's Via-powered micro-transit service — illustrate how ride-sharing platforms are supplementing rather than replacing public transit [21].

By Vehicle Propulsion

Segment Key Metric Primary Demand Driver
ICE Vehicles 61% share (declining) Legacy fleet inertia
Battery Electric Vehicles CAGR 18.2% Electric vehicle ride sharing fleet mandates, lower TCO
Hybrid Vehicles USD 14.8 B Transition bridge in markets lacking charging infrastructure


Electric vehicle ride sharing fleet segments represent the most dynamic transformation within the Ride Sharing Market. Platforms operating BEV-heavy fleets in cities like Shenzhen and Oslo report 35–45% lower per-mile fuel-and-maintenance costs versus ICE equivalents [4][19].


Regional Market Share Analysis

Region Key Metric Primary Investment Themes
North America 38% share (USD 41.1 B) Autonomous robotaxi ride sharing pilots, EV fleet mandates
Europe 25% share (USD 27.1 B) Ride sharing regulation, insurance liability reform, and electrification
Asia-Pacific CAGR 12.6% Super-app ecosystems, ride pooling, shared trip matching, and density
South America USD 5.4 B Moto-taxi digitization, fintech-ride integration
Middle East & Africa CAGR 11.3% Government-backed smart city programs
Total USD 108.2 B

The Ride Sharing Market exhibits distinct regional dynamics shaped by regulatory maturity, urbanization density, and vehicle ownership economics.


North America

Country Key Metric Key Driver
United States 82% of regional share Uber/Lyft duopoly, autonomous robotaxi ride sharing expansion
Canada CAGR 9.8% Urban densification in Toronto, Vancouver
Mexico USD 2.1 B DiDi and Uber are competing for ride-hailing platform dominance


The United States remains the global epicenter of ride sharing innovation. Uber's U.S. gross bookings exceeded USD 40 billion in 2024, while Waymo's autonomous fleet handled over 150,000 weekly rides [3][9]. Canada's Ride Sharing Market benefits from federal clean-fuel regulations that incentivize electric vehicle ride sharing fleet deployment in major metros.

Europe

Country Key Metric Key Driver
United Kingdom 31% of regional share TfL licensing frameworks, Bolt expansion
Germany CAGR 10.9% Post-deregulation ride-hailing platform growth
France USD 4.2 B BlaBlaCar inter-city pooling, ride sharing regulation, insurance, liability alignment


Europe's Platform Work Directive is reshaping the competitive landscape of the Ride Sharing Market, raising compliance costs but also formalizing driver protections that enhance service reliability [11]. The EU's "Fit for 55" climate package mandates accelerated electric vehicle ride sharing fleet transitions across all member states.

Asia-Pacific

Country Key Metric Key Driver
China 42% of regional share DiDi dominance, Baidu Apollo autonomous robotaxi ride sharing
India CAGR 14.2% Ola/Uber price wars, two-wheeler ride-hailing platform growth
Southeast Asia USD 7.8 B Grab/Gojek super-app ecosystems


Asia-Pacific's Ride Sharing Market growth is fueled by population density, low vehicle ownership rates, and super-app platforms that integrate ride pooling, shared trip matching with payments, food delivery, and financial services [10]. India alone is expected to add 180 million new ride-sharing users between 2025 and 2035.

South America

Country Key Metric Key Driver
Brazil 68% of regional share 99 (DiDi subsidiary) and Uber competition
Argentina CAGR 10.4% Peso devaluation increasing shared-ride demand


Brazil's Ride Sharing Market benefits from high urbanization rates (87%) and chronic public transit underinvestment. Moto-taxi platforms like 99Motos are a distinctive regional growth vector [16].

Middle East & Africa

Country Key Metric Key Driver
UAE 38% of regional share Careem (Uber subsidiary), smart city initiatives
Saudi Arabia CAGR 13.1% Vision 2030 urban mobility investments
Nigeria USD 0.6 B Bolt rapid expansion, the unbanked population, and fintech integration


Saudi Arabia's Public Investment Fund has channeled over USD 3.5 billion into urban mobility under Vision 2030, directly supporting ride-hailing platform infrastructure and autonomous vehicle testing corridors [17].


Ride Sharing Market By Region, 2025-2035

Competitive Benchmarking

The Ride Sharing Market exhibits moderate-to-high concentration, with an estimated HHI of approximately 1,800–2,200 across the top 15 global markets. The top five platforms collectively capture an estimated 65–70% of global gross bookings, though regional composition varies significantly.

Company Est. Revenue Share Range Key Offerings for the Ride-Sharing Market Strategic Positioning
Uber Technologies ~28–32% Ride-hailing, UberPool, Uber for Business, and autonomous partnerships Global scale leader with ride-hailing platform dominance
DiDi Global ~18–22% Ride-hailing, carpooling, and autonomous pilots China + LatAm stronghold
Lyft ~6–9% Ride-hailing, shared rides, bike/scooter rental U.S./Canada-focused, ride pooling, shared trip matching
Grab Holdings ~5–7% Super-app: rides, delivery, payments Southeast Asia ecosystem lock-in
Bolt (Taxify) ~3–5% Ride-hailing, micro-mobility, food delivery Europe & Africa expansion
Ola Cabs ~3–5% Ride-hailing, Ola Electric fleet India's dominant, electric vehicle ride sharing fleet pioneer
BlaBlaCar ~2–3% Long-distance ride pooling, bus marketplace European inter-city ride sharing
Via Transportation ~1–2% B2B transit-as-a-service, micro-transit Corporate ride sharing employee commute technology
Waymo (Alphabet) ~1–2% Autonomous robotaxi ride sharing service Technology-first, driverless-only model
Careem (Uber) ~1–2% Ride-hailing, payments super-app Middle East & North Africa


Recent News & Developments

  • Waymo (October 2024): Expanded autonomous robotaxi ride sharing service to Los Angeles, reaching 100,000+ weekly paid rides across three U.S. cities [9].
  • Uber Technologies (August 2024): Announced partnership with BYD to deploy 100,000 electric vehicles on the ride-hailing platform globally by 2027, accelerating electric vehicle ride sharing fleet targets [4].
  • European Union (April 2024): Adopted the Platform Work Directive, establishing employment presumption criteria affecting ride sharing regulation insurance liability frameworks across 27 member states [11].
  • Grab Holdings (January 2024): Launched GrabPool AI-optimized ride pooling shared trip matching in Jakarta and Bangkok, reporting 22% higher match rates versus the previous algorithm [10].
  • Lyft (March 2025): Introduced "Lyft Autonomous" branding for its Motional-powered robotaxi service in Las Vegas, the first U.S. ride-hailing platform to offer scheduled driverless rides [22].
  • Ola Electric (June 2024): Committed USD 500 million to electric two-wheeler fleet expansion for corporate ride sharing employee commute programs across 50 Indian cities [23].
  • Saudi Arabia PIF (November 2023): Invested USD 1.3 billion in domestic ride sharing infrastructure under Vision 2030, including autonomous vehicle testing zones in NEOM [17].
  • Baidu Apollo Go (September 2024): Surpassed 8 million cumulative autonomous rides in China, securing regulatory approval for fully driverless operations in Wuhan [13].
  • Lyft (July 2025): Lyft expanded its presence to 11 countries and almost 1,000 cities by completing the acquisition of FREENOW for EUR 175 million (USD 191 million).
  • Waymo (June 2025): Waymo and Uber launched a commercial robotaxi service in Atlanta that used driverless Jaguar I-PACE vehicles to span 65 square miles.


Ride Sharing Market Report Scope

Parameter Detail
Market Scope Global Ride Sharing Market, including ride-hailing, ride pooling, micro-transit, and autonomous ride services
Study Period 2021–2035
CAGR 10.1% (2026–2035)
Base Year Market Size USD 108.2 Billion (2025)
Forecast Endpoint USD 283.0 Billion (2035)
Fastest Growing Segment Ride pooling shared trip matching (CAGR 13.4%)
Companies Profiled Uber, DiDi, Lyft, Grab, Bolt, Ola, BlaBlaCar, Via, Waymo, Careem
Valuation Currency USD (constant 2025 dollars)


FAQs

How do ride sharing platforms monetize data beyond trip fares?

Platforms license anonymized origin-destination flow data to city planners, real estate developers, and advertisers. This data-as-a-service revenue stream is growing at roughly 20% annually across leading ride-hailing platform operators [18].

What insurance structure applies when an autonomous robotaxi is involved in an accident?

Most jurisdictions assign primary liability to the autonomous vehicle operator or technology provider, not the passenger. Ride sharing regulation insurance liability frameworks are evolving, with California and the UK leading policy development [14].

How does ride pooling affect driver earnings compared to solo ride-hailing?

Drivers on ride pooling shared trip matching routes typically earn 10–15% less per trip but complete 25–30% more trips per hour due to reduced deadhead miles [8]. Net hourly earnings remain comparable.

Which Ride Sharing Market segment offers the best entry point for institutional investors?

Electric vehicle ride sharing fleet operators and autonomous technology providers offer the highest growth multiples. Fleet-focused SPACs and Waymo's anticipated IPO are closely watched opportunities [9][19].

Can corporate ride sharing programs integrate with existing enterprise resource planning systems?

Yes — platforms like Via and Uber for Business offer API integrations with SAP, Oracle, and Workday for automated expense reconciliation. Corporate ride sharing employee commute adoption accelerates when IT friction is minimized [5].

How do emerging Ride Sharing Market regulations in India differ from Western frameworks?

India's Motor Vehicle Aggregator Guidelines cap platform commissions at 20% and mandate driver welfare funds — stricter than most Western ride sharing regulation insurance liability models [14][16].

What role does the Ride Sharing Market play in municipal decarbonization targets?

Cities like Amsterdam and Shenzhen mandate 100% zero-emission ride-hailing platform fleets by 2030. Shared rides reduce per-capita emissions 45–55% versus private car usage, making the Ride Sharing Market a key municipal climate tool [12][19].


Author
Author
Author Profile
Shubham Munde LinkedIn
Team Lead - Research
Shubham brings over 7 years of expertise in Market Intelligence and Strategic Consulting, with a strong focus on the Automotive, Aerospace, and Defense sectors. Backed by a solid foundation in semiconductors, electronics, and software, he has successfully delivered high-impact syndicated and custom research on a global scale. His core strengths include market sizing, forecasting, competitive intelligence, consumer insights, and supply chain mapping. Widely recognized for developing scalable growth strategies, Shubham empowers clients to navigate complex markets and achieve a lasting competitive edge. Trusted by start-ups and Fortune 500 companies alike, he consistently converts challenges into strategic opportunities that drive sustainable growth.
Co-Author
Co-Author Profile
Swapnil Palwe LinkedIn
Team Lead - Research
With a technical background as Bachelor's in Mechanical Engineering, with MBA in Operations Management , Swapnil has 6+ years of experience in market research, consulting and analytics with the tasks of data mining, analysis, and project execution. He is the POC for our clients, for their consulting projects running under the Automotive/A&D domain. Swapnil has worked on major projects in verticals such as Aerospace & Defense, Automotive and many other domain projects. He has worked on projects for fortune 500 companies' syndicate and consulting projects along with several government projects.

Research Approach


Secondary Research

The secondary research process involved comprehensive analysis of regulatory databases, transportation authority publications, peer-reviewed journals, and authoritative mobility organizations. Key sources included the US Department of Transportation (DOT), Federal Transit Administration (FTA), European Commission Directorate-General for Mobility and Transport (DG MOVE), International Transport Forum (ITF/OECD), International Association of Public Transport (UITP), National Highway Traffic Safety Administration (NHTSA), Bureau of Transportation Statistics (BTS), US Census Bureau American Community Survey, Eurostat Transport Database, World Bank Open Data - Transport Sector, International Energy Agency (IEA) Global EV Outlook, Society of Automotive Engineers (SAE International), American Public Transportation Association (APTA), European Automobile Manufacturers' Association (ACEA), China Ministry of Transport Statistical Data, India Ministry of Road Transport and Highways, and national transport ministry reports from key markets. These sources were used to collect mobility statistics, regulatory compliance data, vehicle fleet data, urbanization trends, carbon emission studies, and market landscape analysis for peer-to-peer platforms, business-to-consumer services, business-to-business fleet solutions, electric vehicle integration, and autonomous mobility technologies.


Primary Research

To gather both qualitative and quantitative information, the primary research process involved interviewing players from both the supply and demand sides. CEOs, CTOs, VPs of mobility services, heads of regulatory compliance, directors of fleet operations, and strategy directors from ride-sharing platforms, MaaS providers, and vehicle original equipment manufacturers (OEMs) made up the supply side. End-users from enterprise accounts, government agencies, and educational institutions made up the demand-side sources, along with urban transportation planners, municipal mobility officers, corporate fleet managers, and travel procurement leaders. Market segmentation across P2P, B2C, and B2B service models was established through primary research. Likewise, deployment timescales for autonomous vehicles were confirmed, and insights on platform adoption trends, dynamic pricing algorithms, driver incentive structures, and regulatory compliance frameworks were acquired.

Primary Respondent Breakdown:

By Designation: C-level Primaries (32%), Director Level (31%), Others (37%)

By Region: North America (32%), Europe (30%), Asia-Pacific (28%), Rest of World (10%)


Market Size Estimation

Global market valuation was derived through revenue mapping and trip volume analysis. The methodology included:

Identification of 50+ key platform providers across North America, Europe, Asia-Pacific, Latin America, and Middle East & Africa

Service mapping across peer-to-peer (P2P), business-to-consumer (B2C), and business-to-business (B2B) models

Vehicle type segmentation across sedans, SUVs, minivans, luxury vehicles, and electric vehicles

Analysis of reported and modeled annual revenues specific to ride-sharing and mobility service portfolios

Coverage of platform providers representing 75-80% of global market share in 2024

Extrapolation using bottom-up (trip volume × average fare by country/region) and top-down (platform revenue validation) approaches to derive segment-specific valuations across service models, vehicle types, ride types (pooling, private, luxury), and payment structures (pay-as-you-go, subscription-based, on-demand)

Download Free Sample

Kindly complete the form below to receive a free sample of this Report

Download PDF ×

We do not share your information with anyone. However, we may send you emails based on your report interest from time to time. You may contact us at any time to opt-out.