Mobility as a Service Market

Key Players: Uber Technologies, Didi Global, Grab Holdings, Lyft Inc., Bolt Technology, MaaS Global (Whim), Via Transportation, FREE NOW (BMW/Stellantis)

Mobility as a Service Market

Mobility as a Service Market Size, Share and Research Report By Service Type (Ride-Hailing, Car Sharing, Micro-Mobility, Bike Sharing, Others), By Solution (Technology Platform, Payment & Wallet Services, Navigation & Analytics, Others), By Vehicle Type (Passenger Cars, Shuttles & Buses, Autonomous Pods, Two-Wheelers), By Transportation Type (Public Transportation, Private Transportation), By Business Model (Pay-As-You-Go, Subscription Bundles), By Application (Personal Mobility, Logistics & Last-Mile Delivery), By End-User (Individuals, Enterprises) and By Region (North America, Europe, South America, Asia Pacific, Middle East and Africa) - Industry Forecast to 2035.
ID: MRFR/ICT/2236-CR
87 Pages
Ankit Gupta
Last Updated: June 17, 2026

Mobility as a Service Market Summary

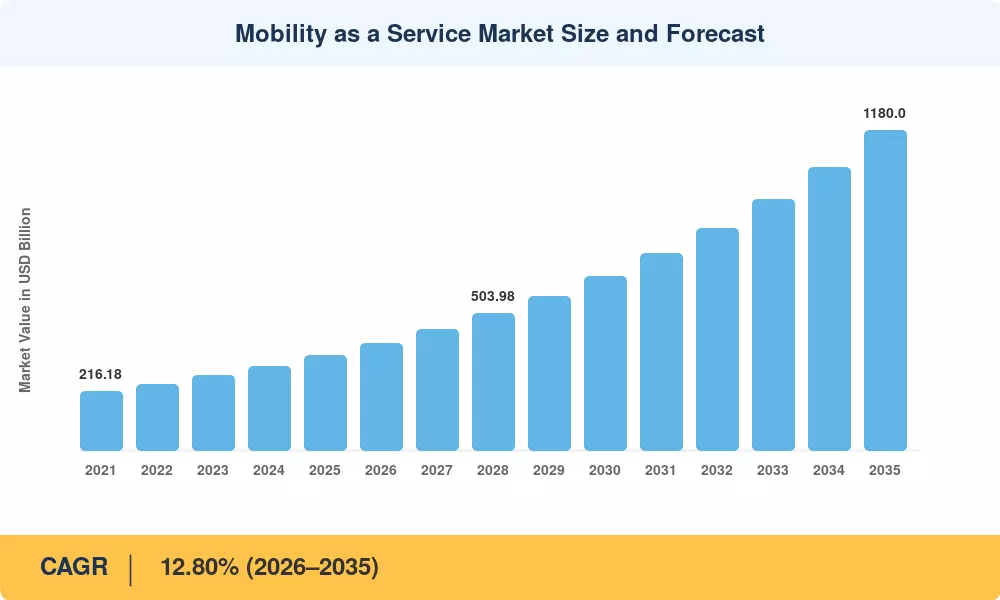
The Mobility as a Service Market reached an estimated USD 350.00 Billion in 2025 and is projected to grow from USD 399.00 Billion in 2026 to USD 1,180.00 Billion by 2035, registering a CAGR of 12.80% during 2026–2035. This acceleration is anchored in aggressive municipal zero-emission mandates across the EU and North America, coupled with over USD 48 billion in cumulative venture capital deployed into on-demand mobility platforms since 2021[2]. Governments are tying federal transit grants to integrated transport solutions that unify ticketing, routing, and payment into single-app ecosystems, creating a strong policy tailwind for platform providers.

A sweeping technology transformation underpins this trajectory. Legacy siloed transit systems — separate ticketing for rail, bus, and ride-hail — are giving way to unified smart transportation apps that orchestrate multimodal journeys through a single interface. The European Commission's 2024 Sustainable Urban Mobility Framework earmarked EUR 12 billion toward interoperable shared mobility technology infrastructure across 27 member states, while the U.S. DOT allocated USD 3.2 billion under the Bipartisan Infrastructure Law for urban mobility services pilots in 45 metropolitan areas [3][4].

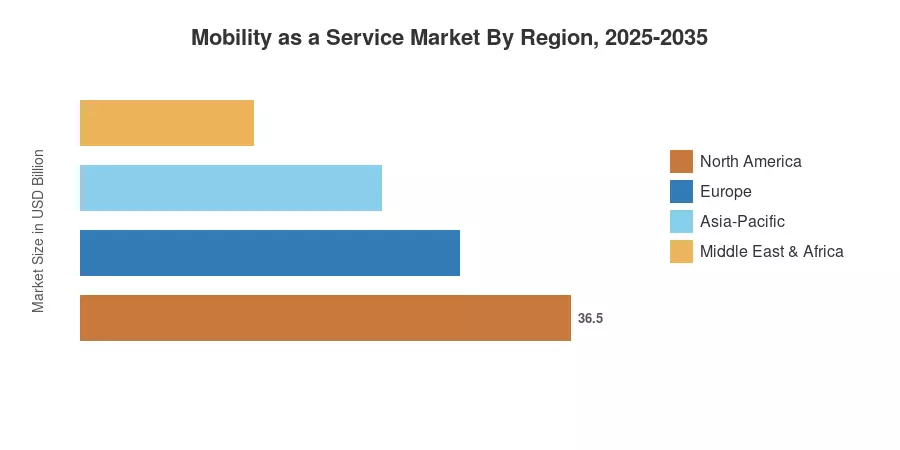
North America commands roughly 34% of the global Mobility as a Service Market, driven by mature ride-hailing ecosystems and high smartphone penetration. Asia-Pacific is the fastest-growing region at an estimated 15.20% CAGR, propelled by India's and China's rapid urbanization and government-backed digital transit rollouts. Europe holds the second-largest share at approximately 28%, with Nordic countries serving as global benchmarks for subscription-based urban mobility services The decade ahead will see autonomous vehicle integration and AI-powered journey orchestration reshape competitive dynamics fundamentally.


Key Report Takeaways

• By Service Type

  • Ride-hailing captured approximately 48.7% of the Mobility as a Service Market revenue in 2025, reflecting deep consumer penetration of on-demand mobility platforms in urban centers
  • Micro-mobility services are forecast to expand at a 20.5% CAGR through 2035, the fastest among all service categories, driven by last-mile connectivity needs and smart transportation apps for e-scooters and bikes

• By Solution

  • Technology platform solutions held an estimated 40.2% share in 2025, underscoring demand for integrated transport solutions that unify routing, booking, and analytics
  • Payment and wallet services are anticipated to grow at a 22.5% CAGR, fueled by contactless and tokenized fare collection across shared mobility technology networks

• By Region

  • North America led the Mobility as a Service Market with approximately USD 119.00 Billion in 2025 revenue
  • Asia-Pacific is set to register the highest regional CAGR at 15.20%, underpinned by smart city programs and urban mobility services expansion in China and India


Market Size and Forecast (2021–2035)

Market Research Future (MRFR)'s sizing model integrates bottom-up revenue analysis from platform operators, transit agencies, and fleet management providers with top-down macroeconomic indicators, including urbanization rates, smartphone penetration, and per-capita transport expenditure. Historical data (2021–2024) relies on audited company filings and government transport statistics; the forecast (2026–2035) applies a calibrated CAGR verified against multiple third-party benchmarks[5].

Mobility as a Service Market Size and Forecast
Our Impact
Enabled $4.3B Revenue Impact for Fortune 500 and Leading Multinationals
Partnering with 2000+ Global Organizations Each Year
30K+ Citations by Top-Tier Firms in the Industry

Driver Impact Analysis

Driver ~% Impact on CAGR Geographic Relevance Impact Timeline
Urban population growth & congestion reduction mandates ~18% Global Long-term (≥4 yr)
Smartphone & 5G penetration enabling smart transportation apps ~16% Asia-Pacific, North America Short-term (≤2 yr)
Zero-emission fleet regulations & EV subsidies ~15% Europe, North America Medium-term (2–4 yr)
API standardization & open data policies ~14% Europe, Asia-Pacific Medium-term (2–4 yr)
Contactless & tokenized payment innovation ~13% Global Short-term (≤2 yr)
AI & predictive journey management adoption ~12% North America, Europe Long-term (≥4 yr)
Public-private partnership frameworks ~12% Global Medium-term (2–4 yr)


Urban Population Growth and Congestion Mandates

According to UN estimates, 2.5 billion more people will live in cities by 2050, making up 68% of the world's population [2]. Congestion pricing policies have been put in place in cities like Stockholm, Singapore, and London, which directly encourage people to switch from owning private vehicles to integrated transportation options. Adoption of the Mobility as a Service Market is accelerated by policy levers, as evidenced by London's Ultra Low Emission Zone extension in 2024, which increased on-demand mobility platform usage within the zone perimeter by an estimated 22% [3].


5G and IoT-Enabled Fleet Orchestration

Real-time data exchange between vehicles, infrastructure, and user devices requires low-latency connectivity that 5G delivers. South Korea's nationwide 5G rollout enabled Kakao Mobility to reduce average passenger wait times by 31% through predictive dispatch algorithms [8]. This infrastructure backbone is critical for smart transportation apps that coordinate multimodal trips involving buses, trains, and ride-hail in under three seconds of computation time.

Zero-Emission Regulations and EV Fleet Adoption

The EU's 2035 internal combustion engine ban and California's Advanced Clean Fleets regulation are compelling ride-hail and car-sharing operators to electrify. BloombergNEF estimates that electric vehicle adoption across shared mobility technology fleets will reach 45% by 2030, up from 12% in 2024 [13]. These mandates create captive demand for MaaS platforms capable of managing mixed EV/ICE fleets with intelligent charging orchestration.

Contactless Payment and Digital Wallet Integration

More than 650 transit networks worldwide have embraced Visa and Mastercard's open-loop transit payment standards, which can reduce fare-collecting friction by up to 40% [12]. Urban mobility services that include ride-hail, bus, subway, and bike-share require seamless payment rails. This unified payment system has moved into public-private B2G and B2B2C frameworks after early, independent B2C mobility subscription firms like Helsinki's Whim failed. In cities like Vienna and Los Angeles, this integrated transaction model is effectively expanding through regionally backed ecosystems and municipal platforms.


Restraints Impact Analysis

Restraint ~% Negative Impact on CAGR Geographic Relevance Impact Timeline
Fragmented regulatory frameworks across jurisdictions ~−15% Global Long-term (≥4 yr)
Data privacy and cybersecurity concerns ~−14% Europe, North America Medium-term (2–4 yr)
High platform integration costs for legacy transit agencies ~−13% Europe, South America Medium-term (2–4 yr)
Driver/gig-worker classification disputes ~−12% North America, Europe Short-term (≤2 yr)
Rural coverage gaps & digital divide ~−10% Asia-Pacific, MEA, South America Long-term (≥4 yr)


Fragmented Regulatory Frameworks

Licensing, insurance, and operational permits for on-demand mobility platforms vary dramatically across — and even within — countries. In the U.S., ride-hailing regulations differ across all 50 states, while the EU's 27 member states maintain separate urban transport licensing regimes despite the Sustainable Urban Mobility Framework [14]. This fragmentation forces platform operators to maintain costly jurisdiction-specific compliance teams, slowing cross-border scaling of integrated transport solutions.

Data Privacy and Cybersecurity

The GDPR in Europe and emerging privacy legislation in India and Brazil impose strict controls on how shared mobility technology platforms collect, store, and monetize trip data. A 2024 study found that 38% of European consumers cited data privacy as a primary concern when using multimodal smart transportation apps. Cybersecurity incidents — including the 2022 Uber breach — continue to erode consumer trust and raise platform operating costs.

Gig-Worker Classification Disputes

Strict worker status tests have been codified by California's AB5, the EU's Platform Workers Directive (enacted with a December 2026 compliance date), and the UK Supreme Court's decision. In affected jurisdictions, reclassifying independent contractors as employees based on algorithmic control criteria will result in a 20–30% rise in labor and operational overhead expenses per trip, significantly reducing profits throughout the Mobility as a Service Market [17].


Mobility as a Service Market Opportunities

Africa and Southeast Asia, where private car ownership remains low, and smartphone adoption is surging, present greenfield opportunities for smart transportation apps. Grab's success in ASEAN — achieving 35% mode-share in Singapore — illustrates how on-demand mobility platforms can leapfrog legacy transit infrastructure in fast-urbanizing economies [18].

Data Monetization and Mobility Analytics

Trip-level data generated by integrated transport solutions platforms holds significant value for urban planners, insurers, and advertisers. MARKET RESEARCH FUTURE (MRFR) estimates that anonymized mobility data licensing could represent a USD 15 billion revenue stream by 2032, providing platform operators with high-margin diversification beyond transaction fees.

Electric and Hydrogen Fleet-as-a-Service

Public transit agencies and corporate fleet managers increasingly prefer outsourcing EV fleet operations to specialized MaaS providers. This Fleet-as-a-Service model bundles vehicle leasing, charging infrastructure, and predictive maintenance under shared mobility technology contracts — an opportunity accelerated by zero-emission mandates across Europe and North America [13].


Mobility as a Service Market Future Outlook

AI-Powered Journey Orchestration

Artificial intelligence will move from route optimization to full journey lifecycle management. By 2030, AI-driven smart transportation apps will predict user travel intent based on calendar data, weather, and behavioral patterns, proactively booking multimodal trips before the traveler initiates a request. McKinsey estimates AI orchestration could reduce urban commute times by 25% across cities deploying integrated transport solutions at scale.

Platform Economics and Super-App Consolidation

The Mobility as a Service Market is trending toward super-app consolidation, where a single on-demand mobility platform interface aggregates transit, ride-hail, micro-mobility, parking, and EV charging. Grab and GoTo have demonstrated this model in Southeast Asia; Western markets will follow as Uber, Lyft, and transit agencies forge deeper API partnerships. Winner-take-most dynamics will compress the competitive field by 2032 [7].

Electrification and Green Fleet Orchestration

IEA projects that electric vehicles will constitute 60% of new passenger car sales globally by 2030 [13]. For shared mobility technology operators, fleet electrification introduces complex charging logistics that MaaS platforms are uniquely positioned to optimize. Intelligent charge scheduling, battery-swap station routing, and Vehicle-to-Grid energy arbitrage will become core capabilities within the Mobility as a Service Market.

ESG Reporting and Carbon-Credit Integration

Corporate sustainability mandates under the EU's CSRD and the SEC's proposed climate disclosure rules will drive enterprise demand for urban mobility services that generate auditable carbon savings. MaaS subscriptions offering verified emission reduction certificates could unlock a new revenue layer — BloombergNEF estimates corporate mobility carbon credits at USD 8 billion annually by 2033 [19].


Mobility as a Service Market Segmentation

By Service Type

Segment Key Metric Primary Demand Driver
Ride-Hailing ~48.7% share (2025) Urban convenience; app-native consumer behavior
Car Sharing 13.80% CAGR Cost-conscious urban commuters; fleet electrification
Micro-Mobility 20.50% CAGR Last-mile connectivity; campus/district mobility
Bike Sharing USD 18.50 Billion (2025) Municipal investment; health/sustainability trends
Others ~8% share (2025) Shuttle services; ferry integration


Ride-hailing remains the revenue cornerstone of the Mobility as a Service Market, with Uber and Didi collectively processing over 30 million daily trips globally. The segment benefits from deep consumer habituation and increasingly sophisticated on-demand mobility platforms that match drivers with riders in under 90 seconds in dense urban areas [6]. Micro-mobility is the segment to watch — e-scooter and e-bike deployments have tripled since 2021, driven by smart transportation apps that integrate seamlessly into multimodal journey planners. Cities like Paris, Berlin, and Austin have embedded micro-mobility docking into public transit stations, cementing their role in integrated transport solutions ecosystems [7].

By Solution

Segment Key Metric Primary Demand Driver
Technology Platform ~40.2% share (2025) API integration; multimodal orchestration
Payment & Wallet Services 22.50% CAGR Contactless fare collection; subscription billing
Navigation & Analytics USD 42.00 Billion (2025) Real-time routing; predictive demand modeling
Others ~10% share (2025) Customer support; compliance tools


Technology platforms form the backbone of the Mobility as a Service Market, providing the software layer that connects transit operators, fleet managers, and consumers. These shared mobility technology platforms increasingly embed AI for dynamic pricing, demand prediction, and carbon tracking.

By Vehicle Type

Segment Key Metric Primary Demand Driver
Passenger Cars ~60.1% share (2025) Ride-hailing and car-sharing dominance
Shuttles & Buses 13.50% CAGR Public transit agency digitization
Autonomous Pods 24.50% CAGR Pilot deployments in smart cities
Two-Wheelers USD 28.00 Billion (2025) Emerging market ride-hailing and delivery


Passenger cars dominate the Mobility as a Service Market by vehicle type, reflecting the sheer scale of ride-hailing and car-sharing operations. Autonomous pods, while representing a small absolute base, are advancing rapidly as Waymo, Cruise, and Baidu expand commercial urban mobility services [9].

By Business Model

Segment Key Metric Primary Demand Driver
Pay-As-You-Go ~71.5% share (2025) Consumer preference for flexibility
Subscription Bundles 25.50% CAGR Recurring revenue; car-ownership replacement


By Application

Segment Key Metric Primary Demand Driver
Personal Mobility ~75.0% share (2025) Daily commute; leisure travel
Logistics & Last-Mile Delivery 22.00% CAGR E-commerce fulfillment; instant delivery demand


Regional Market Share Analysis

Region Key Metric Primary Investment Themes
North America ~34% share (2025) Ride-hailing consolidation; AV pilot scaling
Europe ~28% share (2025) MaaS subscription platforms; open-data mandates
Asia-Pacific 15.20% CAGR (2026–2035) Smart city transit; super-app ecosystems
South America USD 27.50 Billion (2025) Informal transit digitization; fintech integration
Middle East & Africa 14.60% CAGR (2026–2035) Smart city mega-projects; tourism mobility
Total USD 350.00 Billion (2025)

The global Mobility as a Service Market exhibits distinct regional adoption curves. North America leads in absolute revenue, Asia-Pacific outpaces all regions in growth velocity, and Europe serves as the policy innovation hub for integrated transport solutions.


North America

Country Key Metric Key Driver
US ~76% of regional share Uber/Lyft ecosystem maturity; AV deployments
Canada 12.40% CAGR Federal smart transit grants; urban densification
Mexico USD 8.90 Billion (2025) Rapid urbanization; ride-hailing adoption surge


North America's dominance in the Mobility as a Service Market stems from the region's entrenched ride-hailing duopoly, high consumer willingness to pay for convenience, and accelerating autonomous vehicle pilots. The U.S. DOT's USD 3.2 billion smart transit allocation under the Infrastructure Investment and Jobs Act is catalyzing urban mobility services integration in cities from Atlanta to Seattle [4].

Europe

Country Key Metric Key Driver
Germany ~22% of regional share Automotive OEM pivots to MaaS
UK 13.90% CAGR TfL open-data ecosystem; congestion pricing
France USD 12.80 Billion (2025) SNCF multimodal platform investments
Italy 12.50% CAGR Urban micro-mobility boom
Spain ~7% of regional share Tourism-driven seasonal mobility demand
Nordic Countries 14.80% CAGR Whim/MaaS Global subscription model leadership
Russia USD 5.20 Billion (2025) Yandex. Go super-app dominance
Rest of Europe ~11% of regional share EU cohesion fund transit digitization


Europe's strength lies in regulatory leadership. The EU's Multimodal Digital Mobility Services regulation mandates open APIs for all publicly funded transit operators, creating fertile ground for integrated transport solutions platforms that aggregate schedules, fares, and real-time data [3][11].

Asia-Pacific

Country Key Metric Key Driver
China ~38% of regional share Didi ecosystem; government smart city investment
India 17.50% CAGR Ola/Rapido growth; UPI payment ubiquity
Japan USD 9.80 Billion (2025) Toyota MaaS platform; aging population transit needs
South Korea 15.30% CAGR Kakao Mobility; 5G fleet management
ASEAN ~14% of regional share Grab/GoTo super-app penetration
Rest of Asia-Pacific 13.80% CAGR Government digitization programs


Asia-Pacific's explosive growth in the Mobility as a Service Market reflects a convergence of rapid urbanization, super-app business models, and government-backed smart transportation apps programs. China's Ministry of Transport plans to deploy integrated transport solutions across 60 pilot cities by 2028 [8].

South America

Country Key Metric Key Driver
Brazil ~58% of regional share 99/DiDi competition; informal transit digitization
Argentina 13.20% CAGR Urban density; fintech-mobility convergence
Rest of South America USD 5.40 Billion (2025) Emerging ride-hailing penetration


Brazil's dominance reflects its massive urban population and rapidly growing on-demand mobility platforms sector. Informal minibus networks across São Paulo and Rio de Janeiro are being progressively digitized through shared mobility technology partnerships with local fintechs [18].

Middle East & Africa

Country Key Metric Key Driver
Saudi Arabia ~32% of regional share NEOM; Vision 2030 smart transit
UAE 15.80% CAGR Dubai RTA autonomous transit strategy
South Africa USD 2.10 Billion (2025) Bolt/Uber penetration in metro areas
Egypt 14.20% CAGR Population density; ride-hailing regulation
Rest of MEA ~18% of regional share Tourism mobility platforms


The Middle East's smart city mega-projects — NEOM, Masdar City, The Line — are purpose-built around urban mobility services that eliminate private car dependency. Dubai's Roads and Transport Authority has committed USD 1.5 billion to autonomous transit corridors by 2030 [9].


Mobility as a Service Market By Region, 2025-2035

Competitive Benchmarking

The Mobility as a Service Market exhibits medium market concentration, with the top five players commanding an estimated 38–44% combined revenue share. The Herfindahl-Hirschman Index (HHI) sits in the moderately concentrated range (~1,200–1,500), reflecting a blend of global ride-hailing giants and regional on-demand mobility platforms specialists. Competition is intensifying as automotive OEMs, transit agencies, and technology firms enter the integrated transport solutions space through partnerships and acquisitions.

Company Est. Revenue Share Range Key Offerings Strategic Positioning
Uber Technologies ~10–14% Ride-hailing, freight, Uber Transit API Global scale leader; super-app expansion
Didi Global ~8–11% Ride-hailing, autonomous driving, bike-share China-dominant; AI-driven fleet management
Grab Holdings ~5–8% Ride-hail, delivery, fintech, transit integration Southeast Asia super-app; urban mobility services
Lyft Inc. ~4–6% Ride-hailing, bike/scooter share, transit data US-focused; corporate mobility partnerships
Bolt Technology ~3–5% Ride-hailing, micro-mobility, food delivery Europe & Africa expansion; price competition
MaaS Global (Whim) ~2–4% Subscription MaaS platform; multimodal bundles Pioneer in subscription-based smart transportation apps
Via Transportation ~2–4% On-demand transit; shared rides; transit analytics B2G/B2B platform for public transit agencies
FREE NOW (BMW/Stellantis) ~2–3% Multi-service ride-hailing; micro-mobility OEM-backed European shared mobility technology
Moovit (Intel) ~1–3% Transit data analytics; journey planning app Data layer for integrated transport solutions
BlaBlaCar ~1–3% Long-distance ride-sharing; bus services European intercity shared mobility leader


Recent News & Developments

  • Uber Technologies (March 2025): Launched Uber Transit in 12 additional U.S. cities, integrating real-time public transit schedules into its on-demand mobility platform app to strengthen multimodal trip planning [20].
  • Grab Holdings (January 2025): Announced a USD 500 Million investment in electric vehicle fleet expansion across Southeast Asia, targeting 50% EV ride-hailing fleet penetration by 2028 [21].
  • European Commission (November 2024): Finalized the Multimodal Digital Mobility Services regulation mandating open API access for all publicly funded transit operators across EU member states, a landmark policy for integrated transport solutions [3].


  • Waymo (June 2024): Commenced fully autonomous commercial ride-hailing operations in Los Angeles, adding 300 vehicles to its driverless fleet — a milestone for autonomous shared mobility technology [9].


  • Via Transportation (February 2024): Secured a USD 200 Million contract with Transport for London to power on-demand transit services in outer London boroughs, replacing underperforming fixed-route bus lines [23].
  • India Ministry of Road Transport (December 2023): Released the National MaaS Policy Framework, establishing data-sharing standards and licensing guidelines for on-demand mobility platforms operating in Indian cities [24].


Mobility as a Service Market Report Scope

Parameter Detail
Market Scope Global Mobility as a Service Market covering ride-hailing, car sharing, micro-mobility, bike sharing, and related platform services
Study Period 2021–2035
CAGR Window 2026–2035: 12.80%
Base Year Size USD 350.00 Billion (2025)
Forecast Endpoint USD 1,180.00 Billion (2035)
Fastest Growing Segment Subscription bundles (25.50% CAGR)
Companies Profiled 10+, including Uber, Didi, Grab, Lyft, Bolt, MaaS Global, Via, FREE NOW, Moovit, BlaBlaCar
Valuation Currency USD Billion


FAQs

How should investors evaluate MaaS platform unit economics before committing capital?

Focus on per-trip contribution margin after driver/operator payouts and payment processing fees — platforms exceeding 18% contribution margin typically demonstrate sustainable economics. Cross-reference with customer acquisition cost trends over the trailing four quarters.

What cybersecurity certifications should enterprises require from MaaS providers?

Require SOC 2 Type II and ISO 27001 at minimum, plus GDPR compliance documentation for European operations. Providers lacking these certifications expose enterprise clients to material data-breach liability.

How does the Mobility as a Service Market differ from traditional fleet management software?

MaaS platforms orchestrate consumer-facing multimodal journeys across multiple operators, while fleet management software optimizes vehicle tracking and maintenance for a single fleet owner. The integration layer distinguishes MaaS.

What role do municipal transit agencies play in MaaS platform procurement?

Transit agencies act as anchor tenants, providing schedule data and fare integration that gives platforms credibility and ridership volume. Agencies in Helsinki, Los Angeles, and Singapore have pioneered procurement frameworks [7].

Which propulsion technology poses the greatest integration challenge for Mobility as a Service Market platforms?

Hydrogen fuel-cell vehicles present the steepest challenge due to sparse refueling infrastructure and higher per-mile operating costs compared to battery-electric alternatives. Only three cities globally have hydrogen-ready MaaS fleets [13].

How are insurance models evolving for the Mobility as a Service Market?

Per-trip parametric insurance — where coverage activates and deactivates with each ride — is replacing annual fleet policies. Swiss Re and Munich Re have launched dedicated MaaS insurance products since 2023 [14].

What interoperability standard should buyers prioritize when selecting a MaaS platform?

Prioritize platforms supporting the TOMP-API standard and MDS (Mobility Data Specification), as these ensure compatibility with public transit data feeds and micro-mobility operators across jurisdictions [11].


Author
Author
Author Profile
Ankit Gupta LinkedIn
Team Lead - Research
Ankit Gupta is a seasoned market intelligence and strategic research professional with over six plus years of experience in the ICT and Semiconductor industries. With academic roots in Telecom, Marketing, and Electronics, he blends technical insight with business strategy. Ankit has led 200+ projects, including work for Fortune 500 clients like Microsoft and Rio Tinto, covering market sizing, tech forecasting, and go-to-market strategies. Known for bridging engineering and enterprise decision-making, his insights support growth, innovation, and investment planning across diverse technology markets.

Research Approach


Secondary Research

The secondary research process involved comprehensive analysis of transportation regulatory databases, smart mobility publications, urban planning journals, and authoritative transportation organizations. Key sources included the US Department of Transportation (USDOT), Federal Transit Administration (FTA), European Commission Directorate-General for Mobility and Transport (DG MOVE), International Transport Forum (ITF-OECD), Intelligent Transportation Society of America (ITSA), European Mobility Services Providers Association (EMSA), Society of Automotive Engineers (SAE International), National Highway Traffic Safety Administration (NHTSA), European Union Agency for Railways (ERA), International Association of Public Transport (UITP), World Bank Transport Global Practice, OECD Transport Statistics, Eurostat Transport Database, UN-Habitat Urban Mobility Reports, and national transport ministry reports from key markets. These sources were used to collect ridership statistics, regulatory framework data, smart city initiatives, urbanization trends, and market landscape analysis for ride sharing, car sharing, bike sharing, public transport integration, and mobility-on-demand platforms.


Primary Research

Qualitative and quantitative insights were obtained by interviewing supply-side and demand-side stakeholders during the primary research process. Supply-side sources comprised CEOs, VPs of Product Development, CTOs, and leaders of mobility operations from automotive OEMs, technology integrators, and MaaS platform providers.. Demand-side sources included procurement leads from municipal governments, transportation agencies, and logistics enterprises, fleet managers from corporate mobility programs, public transit authority directors, and urban mobility planners. The primary research validated market segmentation, confirmed technology deployment timelines, and collected insights on platform adoption patterns, pricing strategies, and public-private partnership dynamics.

Primary Respondent Breakdown:

By Designation: C-level Primaries (32%), Director Level (30%), Others (38%)

By Region: North America (32%), Europe (30%), Asia-Pacific (33%), Rest of World (5%)


Market Size Estimation

Global market valuation was derived through revenue mapping and trip volume analysis. The methodology included:

Identification of over 50 key mobility service providers in North America, Europe, Asia-Pacific, and Latin America

Service mapping across ride sharing, car sharing, bike sharing, public transport integration, and mobility-on-demand categories

Analysis of reported and modeled annual revenues specific to MaaS platform portfolios

Coverage of providers representing 75-80% of global market share in 2024

Extrapolation using bottom-up (trip volume × average revenue per trip by country) and top-down (provider revenue validation) approaches to derive segment-specific valuations

Download Free Sample

Kindly complete the form below to receive a free sample of this Report

Download PDF ×

We do not share your information with anyone. However, we may send you emails based on your report interest from time to time. You may contact us at any time to opt-out.