Segmentation Quick Reference
| Dimension | Sub-Segments | Dominant Segment | Fastest Growing Segment |
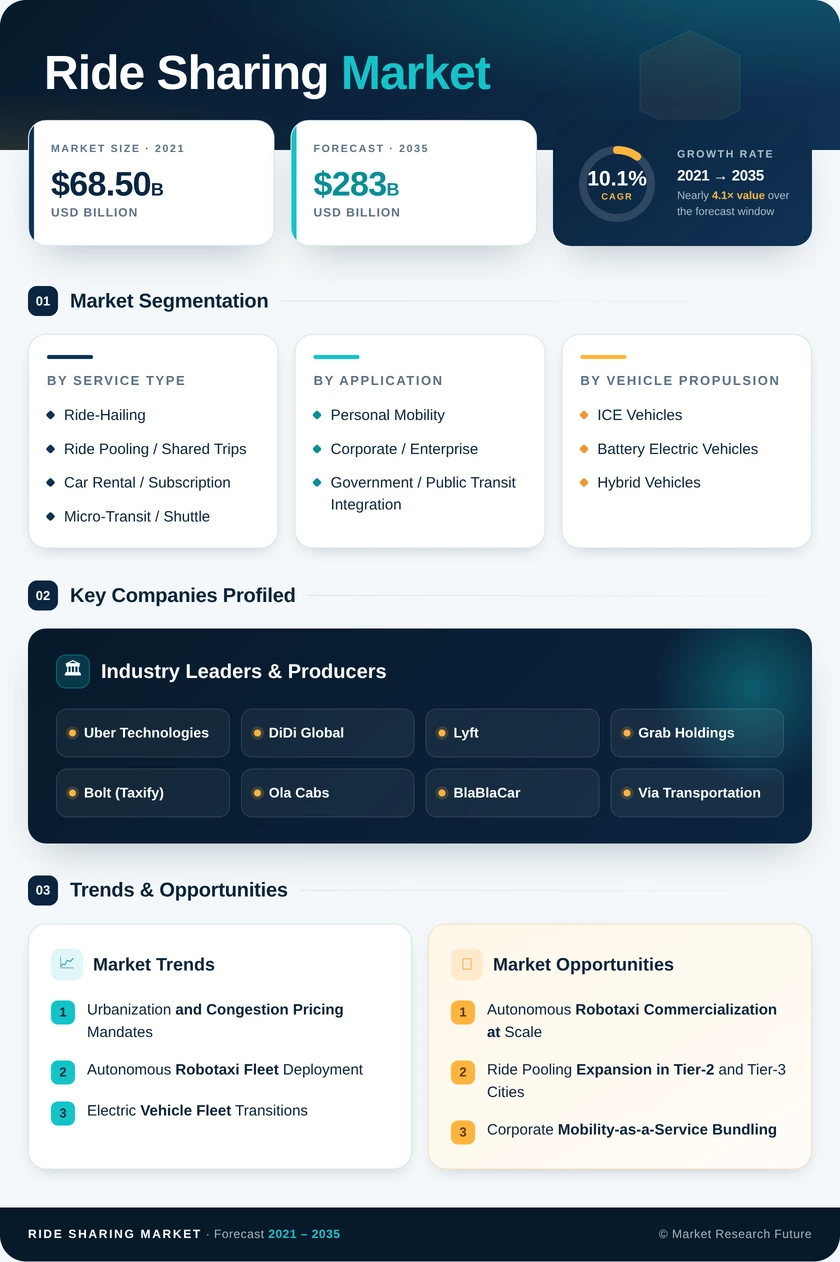
| By Ride Sharing Market Type | Ride-Hailing; Ride Pooling / Shared Trips; Car Rental / Subscription; Micro-Transit / Shuttle | Ride-Hailing (62% share) | Ride Pooling / Shared Trips (CAGR 13.4%) |
| By Application | Personal Mobility; Corporate / Enterprise; Government / Public Transit Integration | Personal Mobility (74% share) | Corporate / Enterprise (CAGR 14.1%) |
| By Vehicle Propulsion | ICE Vehicles; Battery Electric Vehicles; Hybrid Vehicles | ICE Vehicles (61% share) | Battery Electric Vehicles (CAGR 18.2%) |
Market Segmentation Overview
By Ride Sharing Market Type
| Sub-Segment | Key Trend |
| Ride-Hailing | Continued dominance driven by ride-hailing platform Uber Lyft network effects, and global brand recognition |
| Ride Pooling / Shared Trips | AI-powered ride pooling shared trip matching optimization driving 85%+ match rates in dense corridors |
| Car Rental / Subscription | Flexible ownership models are attracting younger urban demographics, avoiding vehicle purchase |
| Micro-Transit / Shuttle | Corporate ride sharing employee commute programs and municipal first/last-mile contracts are expanding rapidly |
The ride-hailing segment generates the highest absolute revenue within the Ride Sharing Market, benefiting from established driver networks and consumer habit formation. Ride pooling services are gaining momentum as algorithmic improvements reduce detour times and pricing advantages widen relative to solo trips.
By Application
| Sub-Segment | Key Trend |
| Personal Mobility | Daily commute, airport transfers, and leisure travel driving sustained volume growth |
| Corporate / Enterprise | Employer-subsidized corporate ride sharing employee commute programs replacing parking stipends |
| Government / Public Transit Integration | Public-private micro-transit partnerships are filling service gaps in suburban and rural zones |
Personal mobility remains the Ride Sharing Market's core demand driver, though corporate and government segments are growing faster as organizations formalize shared mobility into employee benefit and transit planning frameworks.
By Vehicle Propulsion
| Sub-Segment | Key Trend |
| ICE Vehicles | Declining share as electric vehicle ride sharing fleet mandates take effect in key markets |
| Battery Electric Vehicles | Fastest-growing propulsion type, supported by 35–45% lower per-mile operating costs |
| Hybrid Vehicles | Serving as a transition bridge in markets where charging infrastructure remains limited |
The shift toward electric vehicle ride sharing fleet deployment is the single most transformative operational trend in the Ride Sharing Market. Regulatory mandates in California, the EU, and China are accelerating fleet turnover timelines beyond what market economics alone would dictate.