Rolling Stock Market (2026 - 2035)

ID: MRFR/AT/6412-CR
132 Pages
Shubham Munde
Last Updated: July 10, 2026
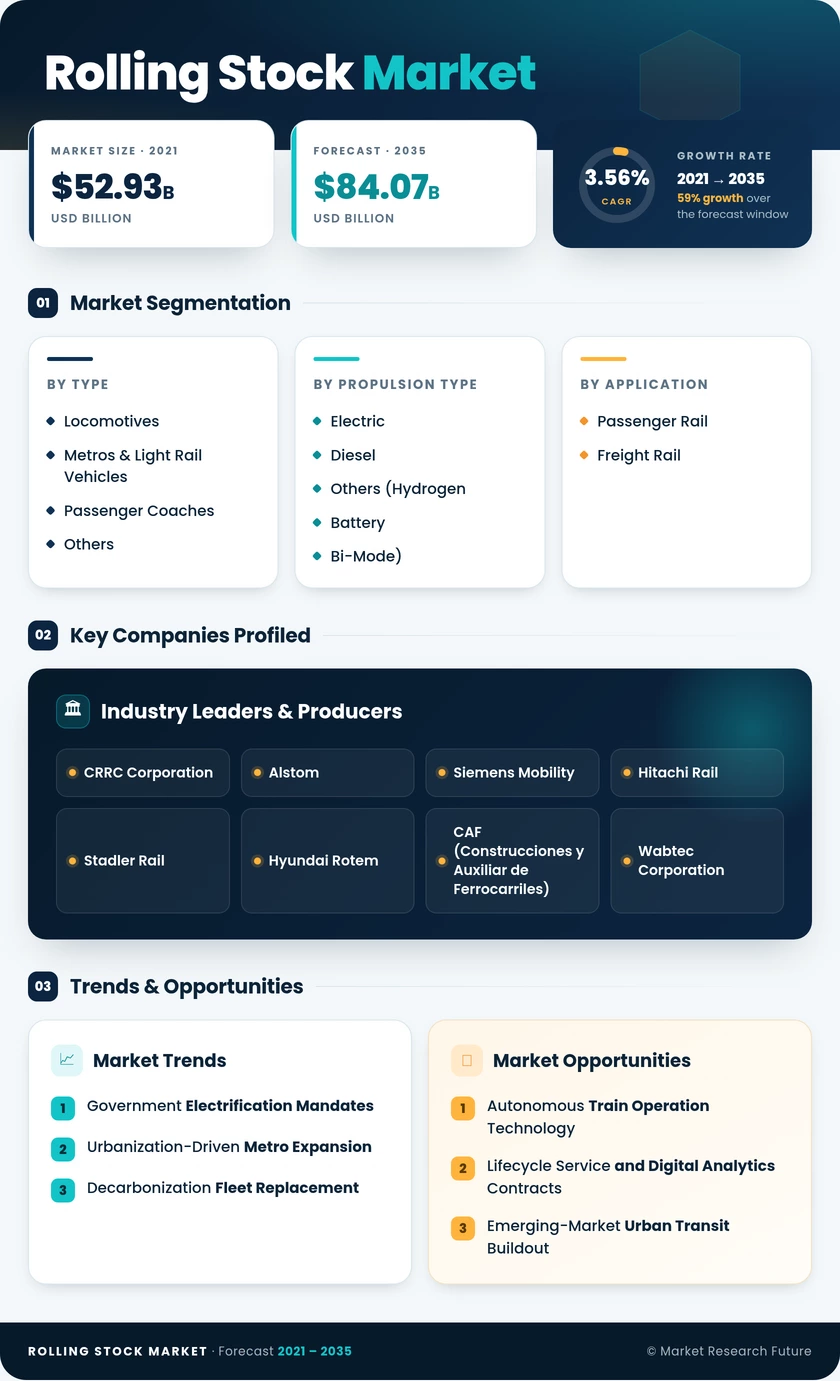
Rolling Stock Market Research Report By Type (Locomotives, Metros & Light Rail Vehicles, Passenger Coaches, Others (DMUs, Railcars)), By Propulsion Type (Electric, Diesel, Others (Hydrogen, Battery, Bi-Mode)), By Application (Passenger Rail, Freight Rail), By End User (National Rail Operators, Urban Transit Agencies, Private Operators & Concessionaires), By Technology (Conventional, Autonomous / Semi-Autonomous) and By Regional (North America, Europe, South America, Asia Pacific, Middle East and Africa) - Industry Forecast to 2035
Rolling Stock Market
Market Size
Forecast Period2026-2035
CAGR (2026-2035)3.56%
2025 Market SizeUSD 59.68 billion
2035 Market SizeUSD 84.07 billion
Key Players
CRRC Corporation
Alstom
Siemens Mobility
Hitachi Rail
Stadler Rail
Hyundai Rotem
Opportunities
  • Autonomous Train Operation Technology
  • Lifecycle Service and Digital Analytics Contracts
  • Emerging-Market Urban Transit Buildout
  1. 1 Market Overview |
    1. 1.1 Study Assumptions & Market Definition |
    2. 1.2 Scope of the Study |
    3. 1.3 Research Methodology
  2. 2 Market Summary & Key Takeaways
  3. 3 Market Dynamics |
    1. 3.1 Market Drivers Analysis | |
      1. 3.1.1 Government Electrification Mandates | |
      2. 3.1.2 Urbanization-Driven Metro Expansion | |
      3. 3.1.3 Decarbonization Fleet Replacement | |
      4. 3.1.4 Dedicated Freight Corridor Investment | |
      5. 3.1.5 Digital Signaling and CBTC Adoption | |
      6. 3.1.6 Lifecycle Service Contract Proliferation | |
      7. 3.1.7 High-Speed Rail Network Buildout |
    2. 3.2 Market Restraints Analysis | |
      1. 3.2.1 Long Procurement Cycles and Budget Delays | |
      2. 3.2.2 Raw Material Cost Inflation (Steel, Copper) | |
      3. 3.2.3 Domestic-Content Localization Requirements | |
      4. 3.2.4 Limited Electrification on Secondary Lines | |
      5. 3.2.5 Skilled-Labor Shortages in Rail Manufacturing |
    3. 3.3 Market Opportunity Analysis | |
      1. 3.3.1 Autonomous Train Operation Technology | |
      2. 3.3.2 Lifecycle Service and Digital Analytics Contracts | |
      3. 3.3.3 Emerging-Market Urban Transit Buildout | |
      4. 3.3.4 Hydrogen and Battery-Hybrid Propulsion | |
      5. 3.3.5 Data Monetization Through Fleet Telematics |
    4. 3.4 Industry Value Chain Analysis |
    5. 3.5 Porter's Five Forces Analysis
  4. 4 Global Rolling Stock Market Size & Forecast (2021–2035) |
    1. 4.1 Historical Market Size (2021–2025) |
    2. 4.2 Current & Forecast Market Size (2026–2035) |
    3. 4.3 Market Size by Revenue (USD billion) |
    4. 4.4 Year-over-Year Growth Analysis
  5. 5 Segmentation Analysis |
    1. 5.1 By Type | |
      1. 5.1.1 Locomotives | |
      2. 5.1.2 Metros & Light Rail Vehicles | |
      3. 5.1.3 Passenger Coaches | |
      4. 5.1.4 Others (DMUs, Railcars) |
    2. 5.2 By Propulsion Type | |
      1. 5.2.1 Electric | |
      2. 5.2.2 Diesel | |
      3. 5.2.3 Others (Hydrogen, Battery, Bi-Mode) |
    3. 5.3 By Application | |
      1. 5.3.1 Passenger Rail | |
      2. 5.3.2 Freight Rail |
    4. 5.4 By End User | |
      1. 5.4.1 National Rail Operators | |
      2. 5.4.2 Urban Transit Agencies | |
      3. 5.4.3 Private Operators & Concessionaires |
    5. 5.5 By Technology | |
      1. 5.5.1 Conventional | |
      2. 5.5.2 Autonomous / Semi-Autonomous
  6. 6 Regional Analysis |
    1. 6.1 North America | |
      1. 6.1.1 United States | |
      2. 6.1.2 Canada | |
      3. 6.1.3 Mexico |
    2. 6.2 Europe | |
      1. 6.2.1 Germany | |
      2. 6.2.2 United Kingdom | |
      3. 6.2.3 France | |
      4. 6.2.4 Italy | |
      5. 6.2.5 Spain | |
      6. 6.2.6 Nordic Countries | |
      7. 6.2.7 Russia | |
      8. 6.2.8 Rest of Europe |
    3. 6.3 Asia-Pacific | |
      1. 6.3.1 China | |
      2. 6.3.2 India | |
      3. 6.3.3 Japan | |
      4. 6.3.4 South Korea | |
      5. 6.3.5 ASEAN | |
      6. 6.3.6 Rest of Asia-Pacific |
    4. 6.4 South America | |
      1. 6.4.1 Brazil | |
      2. 6.4.2 Argentina | |
      3. 6.4.3 Rest of South America |
    5. 6.5 Middle East & Africa | |
      1. 6.5.1 Saudi Arabia | |
      2. 6.5.2 UAE | |
      3. 6.5.3 South Africa | |
      4. 6.5.4 Egypt | |
      5. 6.5.5 Rest of MEA
  7. 7 Competitive Landscape |
    1. 7.1 Market Share Analysis (2025) |
    2. 7.2 Competitive Benchmarking Matrix |
    3. 7.3 Company Profiles | |
      1. 7.3.1 CRRC Corporation | |
      2. 7.3.2 Alstom | |
      3. 7.3.3 Siemens Mobility | |
      4. 7.3.4 Hitachi Rail | |
      5. 7.3.5 Stadler Rail | |
      6. 7.3.6 Hyundai Rotem | |
      7. 7.3.7 CAF (Construcciones y Auxiliar de Ferrocarriles) | |
      8. 7.3.8 Wabtec Corporation | |
      9. 7.3.9 Transmashholding (TMH) | |
      10. 7.3.10 Kawasaki Heavy Industries
  8. 8 Future Outlook & Strategic Recommendations (2026–2035) |
    1. 8.1 Electrification Supercycle and Traction Diversification |
    2. 8.2 AI-Enabled Predictive Maintenance and Autonomous Operations |
    3. 8.3 Platform Economics and Modular Fleet Design |
    4. 8.4 ESG Reporting and Sustainable Procurement Standards
  9. 9 Recent Developments & News
  10. 10 Frequently Asked Questions (FAQs)
  11. 11 Report Scope & Methodology |
    1. 11.1 Study Period & Base Year |
    2. 11.2 Data Sources & Citations |
    3. 11.3 Abbreviations
  12. 12 LIST OF TABLES |
  13. TABLE 1 Global Rolling Stock Market Size & Forecast, by Revenue (USD billion), 2021–2035 |
  14. TABLE 2 Global Rolling Stock Market — Year-over-Year Growth Analysis, 2021–2035 |
  15. TABLE 3 Global Rolling Stock Market — Driver Impact Analysis |
  16. TABLE 4 Global Rolling Stock Market — Restraints Impact Analysis |
  17. TABLE 5 Global Rolling Stock Market Size, by Type, 2021–2035 (USD billion) |
  18. TABLE 6 Global Rolling Stock Market Size, by Propulsion Type, 2021–2035 (USD billion) |
  19. TABLE 7 Global Rolling Stock Market Size, by Application, 2021–2035 (USD billion) |
  20. TABLE 8 Global Rolling Stock Market Size, by End User, 2021–2035 (USD billion) |
  21. TABLE 9 Global Rolling Stock Market Size, by Technology, 2021–2035 (USD billion) |
  22. TABLE 10 Global Rolling Stock Market Size, by Region, 2021–2035 (USD billion) |
  23. TABLE 11 North America Rolling Stock Market Size, by Country, 2021–2035 (USD billion) |
  24. TABLE 12 Europe Rolling Stock Market Size, by Country, 2021–2035 (USD billion) |
  25. TABLE 13 Asia-Pacific Rolling Stock Market Size, by Country, 2021–2035 (USD billion) |
  26. TABLE 14 South America Rolling Stock Market Size, by Country, 2021–2035 (USD billion) |
  27. TABLE 15 Middle East & Africa Rolling Stock Market Size, by Country, 2021–2035 (USD billion) |
  28. TABLE 16 Competitive Benchmarking Matrix — Global Rolling Stock Market, 2025 |
  29. TABLE 17 Company Profiles — Key Players, Global Rolling Stock Market |
  30. TABLE 18 Recent Developments & Strategic Announcements, 2023–2025 |
  31. TABLE 19 Report Scope & Methodology Summary |
  32. TABLE 20 Detailed Sources and Citations |
  33. TABLE 21 North America Rolling Stock Market Size, by Type, 2021–2035 (USD billion) |
  34. TABLE 22 North America Rolling Stock Market Size, by Propulsion Type, 2021–2035 (USD billion) |
  35. TABLE 23 North America Rolling Stock Market Size, by Application, 2021–2035 (USD billion) |
  36. TABLE 24 North America Rolling Stock Market Size, by End User, 2021–2035 (USD billion) |
  37. TABLE 25 North America Rolling Stock Market Size, by Technology, 2021–2035 (USD billion) |
  38. TABLE 26 Europe Rolling Stock Market Size, by Type, 2021–2035 (USD billion) |
  39. TABLE 27 Europe Rolling Stock Market Size, by Propulsion Type, 2021–2035 (USD billion) |
  40. TABLE 28 Europe Rolling Stock Market Size, by Application, 2021–2035 (USD billion) |
  41. TABLE 29 Europe Rolling Stock Market Size, by End User, 2021–2035 (USD billion) |
  42. TABLE 30 Europe Rolling Stock Market Size, by Technology, 2021–2035 (USD billion) |
  43. TABLE 31 Asia-Pacific Rolling Stock Market Size, by Type, 2021–2035 (USD billion) |
  44. TABLE 32 Asia-Pacific Rolling Stock Market Size, by Propulsion Type, 2021–2035 (USD billion) |
  45. TABLE 33 Asia-Pacific Rolling Stock Market Size, by Application, 2021–2035 (USD billion) |
  46. TABLE 34 Asia-Pacific Rolling Stock Market Size, by End User, 2021–2035 (USD billion) |
  47. TABLE 35 Asia-Pacific Rolling Stock Market Size, by Technology, 2021–2035 (USD billion) |
  48. TABLE 36 South America Rolling Stock Market Size, by Type, 2021–2035 (USD billion) |
  49. TABLE 37 South America Rolling Stock Market Size, by Propulsion Type, 2021–2035 (USD billion) |
  50. TABLE 38 South America Rolling Stock Market Size, by Application, 2021–2035 (USD billion) |
  51. TABLE 39 South America Rolling Stock Market Size, by End User, 2021–2035 (USD billion) |
  52. TABLE 40 South America Rolling Stock Market Size, by Technology, 2021–2035 (USD billion) |
  53. TABLE 41 Middle East & Africa Rolling Stock Market Size, by Type, 2021–2035 (USD billion) |
  54. TABLE 42 Middle East & Africa Rolling Stock Market Size, by Propulsion Type, 2021–2035 (USD billion) |
  55. TABLE 43 Middle East & Africa Rolling Stock Market Size, by Application, 2021–2035 (USD billion) |
  56. TABLE 44 Middle East & Africa Rolling Stock Market Size, by End User, 2021–2035 (USD billion) |
  57. TABLE 45 Middle East & Africa Rolling Stock Market Size, by Technology, 2021–2035 (USD billion) |
  58. TABLE 46 United States Rolling Stock Market Size, by Type, 2021–2035 (USD billion) |
  59. TABLE 47 United States Rolling Stock Market Size, by Propulsion Type, 2021–2035 (USD billion) |
  60. TABLE 48 China Rolling Stock Market Size, by Type, 2021–2035 (USD billion) |
  61. TABLE 49 China Rolling Stock Market Size, by Propulsion Type, 2021–2035 (USD billion) |
  62. TABLE 50 India Rolling Stock Market Size, by Type, 2021–2035 (USD billion) |
  63. TABLE 51 India Rolling Stock Market Size, by Propulsion Type, 2021–2035 (USD billion) |
  64. TABLE 52 Germany Rolling Stock Market Size, by Type, 2021–2035 (USD billion) |
  65. TABLE 53 Germany Rolling Stock Market Size, by Propulsion Type, 2021–2035 (USD billion) |
  66. TABLE 54 Japan Rolling Stock Market Size, by Type, 2021–2035 (USD billion) |
  67. TABLE 55 Japan Rolling Stock Market Size, by Propulsion Type, 2021–2035 (USD billion) |
  68. TABLE 56 Brazil Rolling Stock Market Size, by Type, 2021–2035 (USD billion) |
  69. TABLE 57 Saudi Arabia Rolling Stock Market Size, by Type, 2021–2035 (USD billion)
  70. 13 LIST OF FIGURES |
  71. FIGURE 1 Rolling Stock Market Dynamics — Drivers, Restraints, and Opportunities |
  72. FIGURE 2 Rolling Stock Market — Industry Value Chain Analysis |
  73. FIGURE 3 Rolling Stock Market — Porter's Five Forces Analysis |
  74. FIGURE 4 Global Rolling Stock Market Size Trend & Forecast (USD billion), 2021–2035 |
  75. FIGURE 5 Rolling Stock Market Share, by Type (%), 2025 |
  76. FIGURE 6 Rolling Stock Market Share, by Propulsion Type (%), 2025 |
  77. FIGURE 7 Rolling Stock Market Share, by Application (%), 2025 |
  78. FIGURE 8 Rolling Stock Market Share, by End User (%), 2025 |
  79. FIGURE 9 Rolling Stock Market Share, by Technology (%), 2025 |
  80. FIGURE 10 Rolling Stock Market Share, by Region (%), 2025 |
  81. FIGURE 11 North America Rolling Stock Market Size Trend, 2021–2035 |
  82. FIGURE 12 Europe Rolling Stock Market Size Trend, 2021–2035 |
  83. FIGURE 13 Asia-Pacific Rolling Stock Market Size Trend, 2021–2035 |
  84. FIGURE 14 South America Rolling Stock Market Size Trend, 2021–2035 |
  85. FIGURE 15 Middle East & Africa Rolling Stock Market Size Trend, 2021–2035 |
  86. FIGURE 16 Rolling Stock Market — Competitive Landscape Heat Map, 2025 |
  87. FIGURE 17 Rolling Stock Market — Company Market Share Analysis, 2025

SEGMENTATION QUICK REFERENCE

DimensionSub-SegmentsDominant SegmentFastest Growing Segment
By TypeLocomotives; Metros & Light Rail Vehicles; Passenger Coaches; OthersPassenger CoachesMetros & Light Rail Vehicles
By Propulsion TypeElectric; Diesel; Others (Hydrogen, Battery, Bi-Mode)ElectricOthers (Hydrogen, Battery, Bi-Mode)
By ApplicationPassenger Rail; Freight RailPassenger RailPassenger Rail
By End UserNational Rail Operators; Urban Transit Agencies; Private Operators & ConcessionairesNational Rail OperatorsUrban Transit Agencies
By TechnologyConventional; Autonomous / Semi-AutonomousConventionalAutonomous / Semi-Autonomous


MARKET SEGMENTATION OVERVIEW

By Type

Sub-SegmentKey Trend
LocomotivesTransition from diesel to electric and dual-mode traction for freight and mainline passenger haulage
Metros & Light Rail VehiclesRapid deployment of GoA3/GoA4 automated metro systems in emerging-market cities
Passenger CoachesLarge-scale fleet renewal programs driven by aging assets exceeding 25-year service thresholds
Others (DMUs, Railcars)Niche demand for self-propelled railcars on non-electrified regional branch lines


Passenger coaches represent the backbone of the Rolling Stock Market by type, serving intercity, commuter, and suburban operations across all regions. Metros and light rail vehicles, while a smaller share of the installed base, are capturing disproportionate investment as urbanization accelerates transit infrastructure development globally.

By Propulsion Type

Sub-SegmentKey Trend
ElectricMainline electrification targets in Europe and Asia are driving sustained EMU and electric locomotive demand.
DieselDeclining share but continued relevance on non-electrified freight corridors in North America and Africa
Others (Hydrogen, Battery, Bi-Mode)Pilot-to-commercial transition for hydrogen fuel-cell and battery-electric trainsets


Electric propulsion dominates global rolling stock procurement, supported by lower per-kilometer energy costs and regulatory pressure to decarbonize rail operations. Alternative propulsion technologies are emerging as viable solutions for last-mile and branch-line applications where full electrification is economically unfeasible.

By Application

Sub-SegmentKey Trend
Passenger RailHigh-speed rail expansion, metro buildout, and suburban fleet modernization are driving volume growth.
Freight RailModal shift policies and dedicated freight corridors are sustaining demand for heavy-haul and intermodal rolling stock.


Passenger rail commands the larger share of the Rolling Stock Market by application, reflecting the breadth of urban transit, commuter, intercity, and high-speed rail procurement pipelines. Freight rail remains essential for bulk commodity and intermodal logistics, with dedicated corridor investments in India, Australia, and North America supporting long-term fleet demand.

By End User

Sub-SegmentKey Trend
National Rail OperatorsLargest procurement budgets; multi-year framework contracts for intercity and regional fleet renewal
Urban Transit AgenciesFastest growth; driven by new metro and LRT system launches in developing economies.
Private Operators & ConcessionairesGrowing role in open-access passenger services and freight operations under deregulation frameworks


National rail operators remain the dominant procurement channel, leveraging sovereign budgets and centralized fleet planning. Urban transit agencies are the fastest-growing end-user category in the Rolling Stock Market as cities expand metro and light rail networks to manage congestion and reduce transport emissions.

By Technology

Sub-SegmentKey Trend
ConventionalEstablished signaling, traction, and train control architectures serving the vast majority of global fleets
Autonomous / Semi-AutonomousAccelerating adoption of GoA3/GoA4 systems for metro lines; early mainline pilots under ERTMS Level 3


Conventional technology underpins the vast majority of operational rolling stock worldwide. Autonomous and semi-autonomous platforms are expanding from their metro stronghold into mainline applications, driven by labor cost pressures, safety improvements, and digital signaling maturation.


 

Download PDF ×

We do not share your information with anyone. However, we may send you emails based on your report interest from time to time. You may contact us at any time to opt-out.