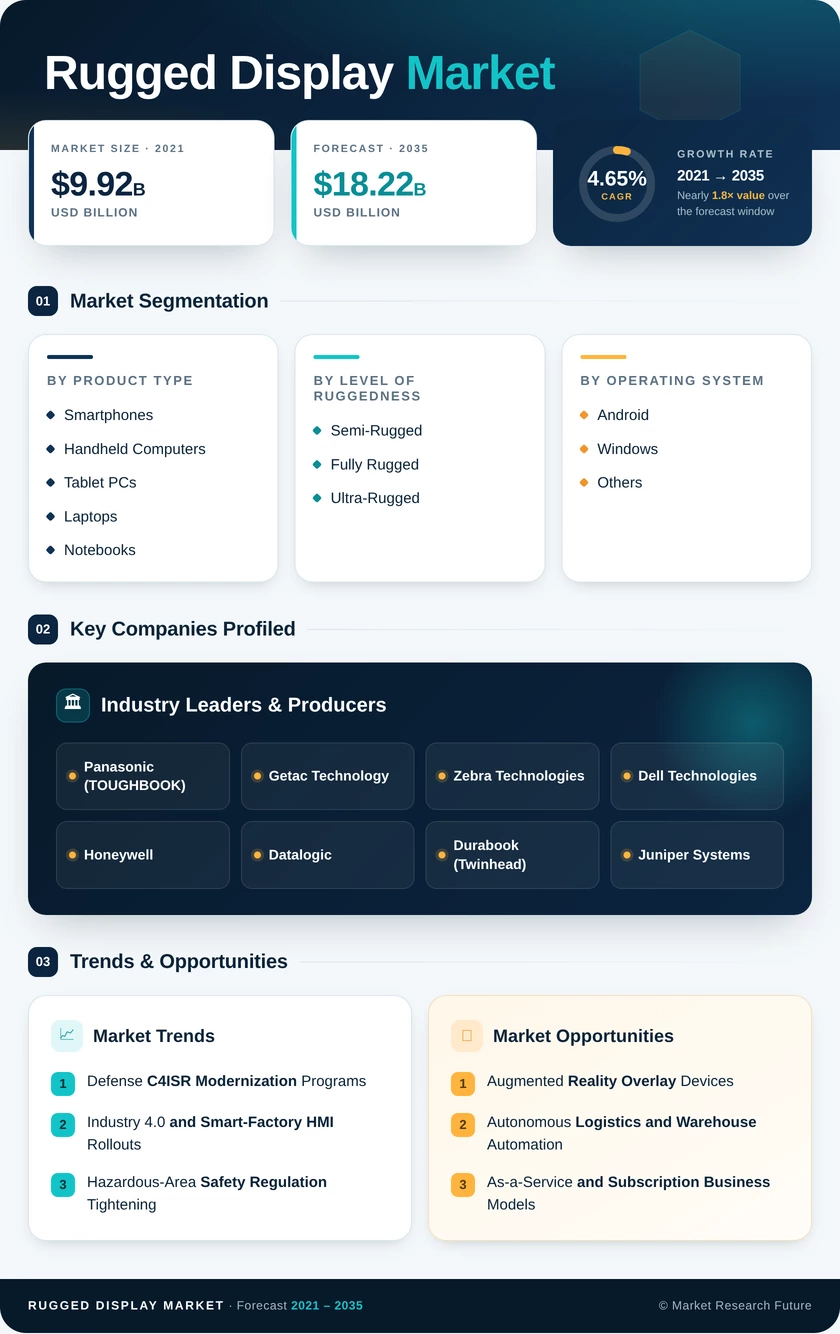
Rugged Display Market (2026 - 2035)

ID: MRFR/SEM/2787-HCR
200 Pages
Nirmit Biswas
Last Updated: July 17, 2026
Rugged Display Market Size, Share & Industry Analysis: By Type (Dot-matrix, LED, LCD, Others), By Operation System (iOS (iPhones), Windows, Android, Others), By Rugged (Semi-rugged, Fully rugged, Ultra-rugged, Others), By End-user (Government, Defense, Aerospace, Hospitals, Industrial, Commercial), And By Region (North America, Europe, Asia-Pacific, And Rest Of The World) – Industry Forecast Till 2035
Rugged Display Market
Market Size
Forecast Period2026-2035
CAGR (2026-2035)4.65%
2025 Market SizeUSD 11.56 Billion
2035 Market SizeUSD 18.22 Billion
Key Players
Panasonic
Getac Technology
Zebra Technologies
Dell Technologies
Honeywell
Datalogic
Opportunities
  • Augmented Reality Overlay Devices
  • Autonomous Logistics and Warehouse Automation
  • As-a-Service and Subscription Business Models
  1. 1 Market Overview |
    1. 1.1 Study Assumptions & Market Definition |
    2. 1.2 Scope of the Study |
    3. 1.3 Research Methodology
  2. 2 Market Summary & Key Takeaways
  3. 3 Market Dynamics |
    1. 3.1 Market Drivers Analysis | |
      1. 3.1.1 Defense C4ISR Modernization Programs | |
      2. 3.1.2 Industry
    2. 4.0 and Smart-Factory HMI Rollouts | |
      1. 3.1.3 Hazardous-Area Safety Regulation Tightening | |
      2. 3.1.4 5G and Edge-AI Integration into Field Devices | |
      3. 3.1.5 Digital Oilfield and Upstream Automation | |
      4. 3.1.6 Fleet Telematics and Autonomous Vehicle Guidance | |
      5. 3.1.7 Public-Safety First-Responder Device Mandates |
    3. 3.2 Market Restraints Analysis | |
      1. 3.2.1 High Certification and Qualification Costs | |
      2. 3.2.2 Capital Premium Over Consumer-Grade Devices | |
      3. 3.2.3 Extended Procurement and Testing Cycles | |
      4. 3.2.4 Limited Aftermarket and Repair Ecosystems | |
      5. 3.2.5 Technology Obsolescence Risk in Long-Cycle Contracts |
    4. 3.3 Market Opportunity Analysis | |
      1. 3.3.1 Augmented Reality Overlay Devices | |
      2. 3.3.2 Autonomous Logistics and Warehouse Automation | |
      3. 3.3.3 As-a-Service and Subscription Business Models | |
      4. 3.3.4 Emerging-Market Infrastructure Digitization | |
      5. 3.3.5 Data Monetization Through Embedded Telemetry |
    5. 3.4 Industry Value Chain Analysis |
    6. 3.5 Porter's Five Forces Analysis
  4. 4 Global Rugged Display Market Size & Forecast (2021–2035) |
    1. 4.1 Historical Market Size (2021–2025) |
    2. 4.2 Current & Forecast Market Size (2026–2035) |
    3. 4.3 Market Size by Revenue (USD Billion) |
    4. 4.4 Year-over-Year Growth Analysis
  5. 5 Segmentation Analysis |
    1. 5.1 By Product Type | |
      1. 5.1.1 Smartphones and Handheld Computers | |
      2. 5.1.2 Tablet PCs | |
      3. 5.1.3 Laptops and Notebooks | |
      4. 5.1.4 Others (Vehicle-Mounted Computers, Panel PCs) |
    2. 5.2 By Level of Ruggedness | |
      1. 5.2.1 Semi-Rugged | |
      2. 5.2.2 Fully Rugged | |
      3. 5.2.3 Ultra-Rugged |
    3. 5.3 By Operating System | |
      1. 5.3.1 Android | |
      2. 5.3.2 Windows | |
      3. 5.3.3 Others (Linux, Proprietary RTOS) |
    4. 5.4 By End User | |
      1. 5.4.1 Oil and Gas | |
      2. 5.4.2 Government, Defense and Aerospace | |
      3. 5.4.3 Industrial Manufacturing | |
      4. 5.4.4 Others (Utilities, Transportation, Healthcare)
  6. 6 Regional Analysis |
    1. 6.1 North America | |
      1. 6.1.1 United States | |
      2. 6.1.2 Canada | |
      3. 6.1.3 Mexico |
    2. 6.2 Europe | |
      1. 6.2.1 Germany | |
      2. 6.2.2 United Kingdom | |
      3. 6.2.3 France | |
      4. 6.2.4 Italy | |
      5. 6.2.5 Spain | |
      6. 6.2.6 Nordic Countries | |
      7. 6.2.7 Russia | |
      8. 6.2.8 Rest of Europe |
    3. 6.3 Asia-Pacific | |
      1. 6.3.1 China | |
      2. 6.3.2 India | |
      3. 6.3.3 Japan | |
      4. 6.3.4 South Korea | |
      5. 6.3.5 ASEAN | |
      6. 6.3.6 Rest of Asia-Pacific |
    4. 6.4 South America | |
      1. 6.4.1 Brazil | |
      2. 6.4.2 Argentina | |
      3. 6.4.3 Rest of South America |
    5. 6.5 Middle East & Africa | |
      1. 6.5.1 Saudi Arabia | |
      2. 6.5.2 UAE | |
      3. 6.5.3 South Africa | |
      4. 6.5.4 Egypt | |
      5. 6.5.5 Rest of MEA
  7. 7 Competitive Landscape |
    1. 7.1 Market Share Analysis (2025) |
    2. 7.2 Competitive Benchmarking Matrix |
    3. 7.3 Company Profiles | |
      1. 7.3.1 Panasonic (TOUGHBOOK) | |
      2. 7.3.2 Getac Technology | |
      3. 7.3.3 Zebra Technologies | |
      4. 7.3.4 Dell Technologies | |
      5. 7.3.5 Honeywell | |
      6. 7.3.6 Datalogic | |
      7. 7.3.7 Durabook (Twinhead) | |
      8. 7.3.8 Juniper Systems | |
      9. 7.3.9 MobileDemand | |
      10. 7.3.10 Handheld Group
  8. 8 Future Outlook & Strategic Recommendations (2026–2035) |
    1. 8.1 AI-Enabled Autonomous Field Operations |
    2. 8.2 Platform Economics and DaaS Expansion |
    3. 8.3 Sustainability and Circular-Economy Mandates |
    4. 8.4 Convergence with Wearable and AR Form Factors
  9. 9 Recent Developments & News
  10. 10 Frequently Asked Questions (FAQs)
  11. 11 Report Scope & Methodology |
    1. 11.1 Study Period & Base Year |
    2. 11.2 Data Sources & Citations |
    3. 11.3 Abbreviations
  12. 12 LIST OF TABLES |
  13. TABLE 1 Global Rugged Display Market Size & Forecast, by Revenue (USD Billion), 2021–2035 |
  14. TABLE 2 Global Rugged Display Market — Year-over-Year Growth Analysis, 2021–2035 |
  15. TABLE 3 Global Rugged Display Market — Driver Impact Analysis |
  16. TABLE 4 Global Rugged Display Market — Restraint Impact Analysis |
  17. TABLE 5 Global Rugged Display Market — Regional Summary, 2025 |
  18. TABLE 6 North America Rugged Display Market Size, by Country, 2021–2035 (USD Billion) |
  19. TABLE 7 Europe Rugged Display Market Size, by Country, 2021–2035 (USD Billion) |
  20. TABLE 8 Asia-Pacific Rugged Display Market Size, by Country, 2021–2035 (USD Billion) |
  21. TABLE 9 South America Rugged Display Market Size, by Country, 2021–2035 (USD Billion) |
  22. TABLE 10 Middle East & Africa Rugged Display Market Size, by Country, 2021–2035 (USD Billion) |
  23. TABLE 11 Global Rugged Display Market Size, by Product Type, 2021–2035 (USD Billion) |
  24. TABLE 12 Global Rugged Display Market Size, by Level of Ruggedness, 2021–2035 (USD Billion) |
  25. TABLE 13 Global Rugged Display Market Size, by Operating System, 2021–2035 (USD Billion) |
  26. TABLE 14 Global Rugged Display Market Size, by End User, 2021–2035 (USD Billion) |
  27. TABLE 15 Competitive Benchmarking Matrix — Global Rugged Display Market, 2025 |
  28. TABLE 16 Company Profiles — Key Players, Global Rugged Display Market |
  29. TABLE 17 Recent Developments & Strategic Announcements, 2023–2025 |
  30. TABLE 18 Report Scope & Methodology Summary |
  31. TABLE 19 Detailed Sources and Citations |
  32. TABLE 20 North America Rugged Display Market Size, by Product Type, 2021–2035 (USD Billion) |
  33. TABLE 21 North America Rugged Display Market Size, by Level of Ruggedness, 2021–2035 (USD Billion) |
  34. TABLE 22 North America Rugged Display Market Size, by Operating System, 2021–2035 (USD Billion) |
  35. TABLE 23 North America Rugged Display Market Size, by End User, 2021–2035 (USD Billion) |
  36. TABLE 24 Europe Rugged Display Market Size, by Product Type, 2021–2035 (USD Billion) |
  37. TABLE 25 Europe Rugged Display Market Size, by Level of Ruggedness, 2021–2035 (USD Billion) |
  38. TABLE 26 Europe Rugged Display Market Size, by Operating System, 2021–2035 (USD Billion) |
  39. TABLE 27 Europe Rugged Display Market Size, by End User, 2021–2035 (USD Billion) |
  40. TABLE 28 Asia-Pacific Rugged Display Market Size, by Product Type, 2021–2035 (USD Billion) |
  41. TABLE 29 Asia-Pacific Rugged Display Market Size, by Level of Ruggedness, 2021–2035 (USD Billion) |
  42. TABLE 30 Asia-Pacific Rugged Display Market Size, by Operating System, 2021–2035 (USD Billion) |
  43. TABLE 31 Asia-Pacific Rugged Display Market Size, by End User, 2021–2035 (USD Billion) |
  44. TABLE 32 South America Rugged Display Market Size, by Product Type, 2021–2035 (USD Billion) |
  45. TABLE 33 South America Rugged Display Market Size, by Level of Ruggedness, 2021–2035 (USD Billion) |
  46. TABLE 34 South America Rugged Display Market Size, by Operating System, 2021–2035 (USD Billion) |
  47. TABLE 35 South America Rugged Display Market Size, by End User, 2021–2035 (USD Billion) |
  48. TABLE 36 Middle East & Africa Rugged Display Market Size, by Product Type, 2021–2035 (USD Billion) |
  49. TABLE 37 Middle East & Africa Rugged Display Market Size, by Level of Ruggedness, 2021–2035 (USD Billion) |
  50. TABLE 38 Middle East & Africa Rugged Display Market Size, by Operating System, 2021–2035 (USD Billion) |
  51. TABLE 39 Middle East & Africa Rugged Display Market Size, by End User, 2021–2035 (USD Billion)
  52. 13 LIST OF FIGURES |
  53. FIGURE 1 Global Rugged Display Market Dynamics — Drivers, Restraints, Opportunities |
  54. FIGURE 2 Rugged Display Market Value Chain Analysis |
  55. FIGURE 3 Porter's Five Forces Analysis — Rugged Display Market |
  56. FIGURE 4 Global Rugged Display Market Size Trend & Forecast (USD Billion), 2021–2035 |
  57. FIGURE 5 Global Rugged Display Market Share, by Product Type (%), 2025 |
  58. FIGURE 6 Global Rugged Display Market Share, by Level of Ruggedness (%), 2025 |
  59. FIGURE 7 Global Rugged Display Market Share, by Operating System (%), 2025 |
  60. FIGURE 8 Global Rugged Display Market Share, by End User (%), 2025 |
  61. FIGURE 9 Global Rugged Display Market Share, by Region (%), 2025 |
  62. FIGURE 10 North America Rugged Display Market Size Trend & Forecast (USD Billion), 2021–2035 |
  63. FIGURE 11 Europe Rugged Display Market Size Trend & Forecast (USD Billion), 2021–2035 |
  64. FIGURE 12 Asia-Pacific Rugged Display Market Size Trend & Forecast (USD Billion), 2021–2035 |
  65. FIGURE 13 South America Rugged Display Market Size Trend & Forecast (USD Billion), 2021–2035 |
  66. FIGURE 14 Middle East & Africa Rugged Display Market Size Trend & Forecast (USD Billion), 2021–2035 |
  67. FIGURE 15 Competitive Landscape — Rugged Display Market Revenue Share (%), 2025

Segmentation Quick Reference

DimensionSub-SegmentsDominant SegmentFastest Growing Segment
Product TypeSmartphones and Handheld Computers, Tablet PCs, Laptops and Notebooks, OthersTablet PCs (44.2% share, 2025)Others — Vehicle-Mounted Computers (5.96% CAGR)
Level of RuggednessSemi-Rugged, Fully Rugged, Ultra-RuggedFully Rugged (51.2% share, 2025)Ultra-Rugged (5.39% CAGR)
Operating SystemAndroid, Windows, OthersAndroid (48.9% share, 2025)Android (5.21% CAGR)
End UserOil and Gas, Government Defense and Aerospace, Industrial Manufacturing, OthersGovernment Defense and Aerospace (33.6% share, 2025)Oil and Gas (8.30% CAGR)
GeographyNorth America, Europe, Asia-Pacific, South America, Middle East & AfricaNorth America (48.3% share, 2025)Asia-Pacific (5.74% CAGR)


Market Segmentation Overview

By Product Type

Sub-SegmentKey Trend
Smartphones and Handheld ComputersGrowing adoption in last-mile logistics and retail inventory management with integrated barcode and RFID readers
Tablet PCsLargest segment driven by cross-industry versatility in defense, field inspection, and warehouse operations
Laptops and NotebooksSteady demand from engineering workstations, tactical planning, and SCADA-interface requirements
Others (Vehicle-Mounted, Panel PCs)Fastest growth fueled by fleet telematics, AGV interfaces, and factory-floor HMI deployments


Tablet PCs continue to anchor this dimension because they balance screen size, weight, and input modality — equally suited for clipboard-style field data entry and in-vehicle map display. Vehicle-mounted computers are gaining share as autonomous material-handling systems proliferate in warehousing and manufacturing.

By Level of Ruggedness

Sub-SegmentKey Trend
Semi-RuggedEntry-level option for healthcare, education, and light field-service environments
Fully RuggedMainstream choice for defense, public safety, and heavy-industry applications requiring MIL-STD-810H and IP67
Ultra-RuggedFastest-growing tier driven by ATEX and IECEx mandates in explosive-atmosphere industries


Fully rugged units dominate because institutional buyers — military, law enforcement, energy — treat certification compliance as non-negotiable. Ultra-rugged devices are carving a distinct growth lane as hazardous-area digitization accelerates in oil refining, chemical processing, and mining.

By Operating System

Sub-SegmentKey Trend
AndroidLeading platform supported by enterprise mobility management suites and lower total licensing cost
WindowsRetained by organizations running legacy x86 enterprise applications and classified defense workloads
Others (Linux, Proprietary RTOS)Niche adoption in embedded industrial controllers and mission-specific military systems


Android has closed the enterprise-readiness gap through Google's Android Enterprise program, making it the default for new deployments. Windows retains relevance wherever legacy compatibility outweighs total-cost-of-ownership advantages.

By End User

Sub-SegmentKey Trend
Oil and GasFastest-growing vertical driven by digital oilfield deployments and ATEX compliance requirements
Government, Defense and AerospaceLargest end-user segment anchored by long-cycle defense contracts and public-safety mandates
Industrial ManufacturingExpanding HMI footprint in smart factories, quality inspection, and MES-connected workstations
Others (Utilities, Transportation, Healthcare)Steady growth from grid-hardening programs, rail digitization, and clinical-mobility adoption


Government, Defense and Aerospace procurement provides a stable revenue foundation with multi-year contract visibility. Oil and gas is the breakout vertical as upstream operators and downstream refineries invest in digitization under safety-regulation pressure.


 

Download PDF ×

We do not share your information with anyone. However, we may send you emails based on your report interest from time to time. You may contact us at any time to opt-out.