Runtime Application Self Protection Market (2026 - 2035)

ID: MRFR/ICT/1007-HCR
100 Pages
Apoorva Priyadarshi
Last Updated: July 13, 2026
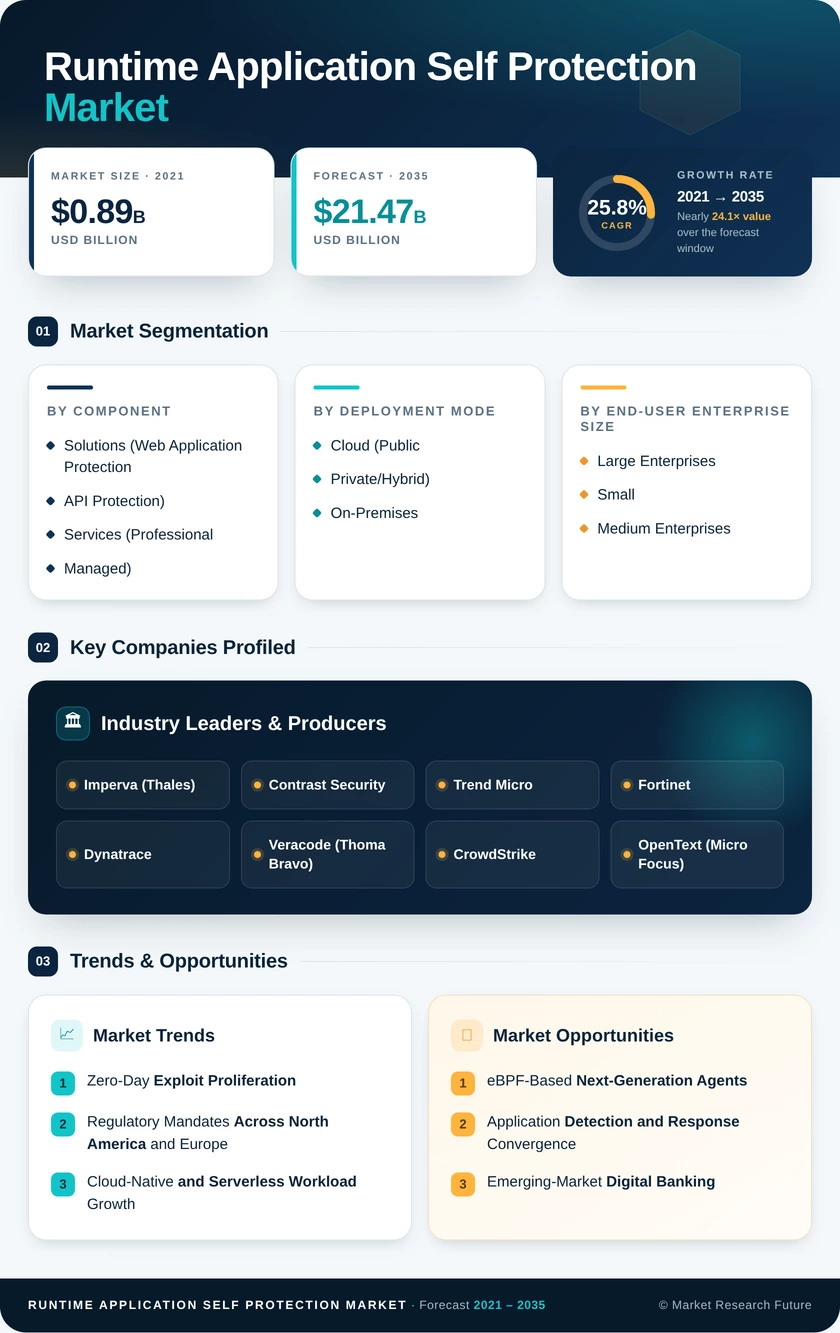
Runtime Application Self Protection Market Size, Share and Research Report By Component (Solutions—Web Application Protection, Solutions—API Protection, Services—Professional Services, Services—Managed Services), By Deployment Mode (Cloud—Public Cloud, Cloud—Private/Hybrid Cloud, On-Premises), By End-User Enterprise Size (Large Enterprises, Small and Medium Enterprises), By End-User Industry (BFSI, Healthcare, IT & Telecommunications, Government & Defense, Retail & E-Commerce, Aerospace and Defense, Electronics and Consumer Technologies, Metal and Mining, Other End-User Industries) and By Regional (North America, Europe, South America, Asia Pacific, Middle East and Africa) - Industry Forecast to 2035.
Runtime Application Self Protection Market
Market Size
Forecast Period2026-2035
CAGR (2026-2035)25.8%
2025 Market SizeUSD 2.16 Billion
2035 Market SizeUSD 21.47 Billion
Key Players
Imperva
Contrast Security
Trend Micro
Fortinet
Dynatrace
Veracode
Opportunities
  • eBPF-Based Next-Generation Agents
  • Application Detection and Response Convergence
  • Emerging-Market Digital Banking
  1. 1 Market Overview |
    1. 1.1 Study Assumptions & Market Definition |
    2. 1.2 Scope of the Study |
    3. 1.3 Research Methodology
  2. 2 Market Summary & Key Takeaways
  3. 3 Market Dynamics |
    1. 3.1 Market Drivers Analysis | |
      1. 3.1.1 Zero-Day Exploit Proliferation | |
      2. 3.1.2 NIS2 and CISA Regulatory Mandates | |
      3. 3.1.3 Cloud-Native and Serverless Workload Growth | |
      4. 3.1.4 API-Economy Expansion | |
      5. 3.1.5 DevSecOps Pipeline Integration | |
      6. 3.1.6 AI-Driven Threat Intelligence | |
      7. 3.1.7 Data-Sovereignty Regulations in APAC |
    2. 3.2 Market Restraints Analysis | |
      1. 3.2.1 Application Performance Overhead Concerns | |
      2. 3.2.2 Language and Framework Coverage Gaps | |
      3. 3.2.3 Legacy Application Incompatibility | |
      4. 3.2.4 Vendor Lock-In and Integration Complexity | |
      5. 3.2.5 Security Talent Shortage |
    3. 3.3 Market Opportunity Analysis | |
      1. 3.3.1 eBPF-Based Next-Generation Agents | |
      2. 3.3.2 Application Detection and Response Convergence | |
      3. 3.3.3 Emerging-Market Digital Banking | |
      4. 3.3.4 Managed RASP-as-a-Service for SMEs | |
      5. 3.3.5 Data Monetization Through Runtime Telemetry |
    4. 3.4 Industry Value Chain Analysis |
    5. 3.5 Porter's Five Forces Analysis
  4. 4 Global Runtime Application Self-Protection Market Size & Forecast (2021–2035) |
    1. 4.1 Historical Market Size (2021–2025) |
    2. 4.2 Current & Forecast Market Size (2026–2035) |
    3. 4.3 Market Size by Revenue (USD Billion) |
    4. 4.4 Year-over-Year Growth Analysis
  5. 5 Segmentation Analysis |
    1. 5.1 By Component | |
      1. 5.1.1 Solutions — Web Application Protection | |
      2. 5.1.2 Solutions — API Protection | |
      3. 5.1.3 Services — Professional Services | |
      4. 5.1.4 Services — Managed Services |
    2. 5.2 By Deployment Mode | |
      1. 5.2.1 Cloud — Public Cloud | |
      2. 5.2.2 Cloud — Private/Hybrid Cloud | |
      3. 5.2.3 On-Premises |
    3. 5.3 By End-User Enterprise Size | |
      1. 5.3.1 Large Enterprises | |
      2. 5.3.2 Small and Medium Enterprises |
    4. 5.4 By End-User Industry | |
      1. 5.4.1 BFSI | |
      2. 5.4.2 Healthcare | |
      3. 5.4.3 IT & Telecommunications | |
      4. 5.4.4 Government & Defense | |
      5. 5.4.5 Retail & E-Commerce
  6. 6 Regional Analysis |
    1. 6.1 North America | |
      1. 6.1.1 United States | |
      2. 6.1.2 Canada | |
      3. 6.1.3 Mexico |
    2. 6.2 Europe | |
      1. 6.2.1 Germany | |
      2. 6.2.2 United Kingdom | |
      3. 6.2.3 France | |
      4. 6.2.4 Italy | |
      5. 6.2.5 Spain | |
      6. 6.2.6 Nordic Countries | |
      7. 6.2.7 Russia | |
      8. 6.2.8 Rest of Europe |
    3. 6.3 Asia-Pacific | |
      1. 6.3.1 China | |
      2. 6.3.2 India | |
      3. 6.3.3 Japan | |
      4. 6.3.4 South Korea | |
      5. 6.3.5 ASEAN | |
      6. 6.3.6 Rest of Asia-Pacific |
    4. 6.4 South America | |
      1. 6.4.1 Brazil | |
      2. 6.4.2 Argentina | |
      3. 6.4.3 Rest of South America |
    5. 6.5 Middle East & Africa | |
      1. 6.5.1 Saudi Arabia | |
      2. 6.5.2 UAE | |
      3. 6.5.3 South Africa | |
      4. 6.5.4 Egypt | |
      5. 6.5.5 Rest of MEA
  7. 7 Competitive Landscape |
    1. 7.1 Market Share Analysis (2025) |
    2. 7.2 Competitive Benchmarking Matrix |
    3. 7.3 Company Profiles | |
      1. 7.3.1 Imperva (Thales) | |
      2. 7.3.2 Contrast Security | |
      3. 7.3.3 Trend Micro | |
      4. 7.3.4 Fortinet | |
      5. 7.3.5 Dynatrace | |
      6. 7.3.6 Veracode (Thoma Bravo) | |
      7. 7.3.7 CrowdStrike | |
      8. 7.3.8 OpenText (Micro Focus) | |
      9. 7.3.9 Guardsquare | |
      10. 7.3.10 Signal Sciences (Fastly)
  8. 8 Future Outlook & Strategic Recommendations (2026–2035) |
    1. 8.1 AI-Augmented Threat Detection (2026–2028) |
    2. 8.2 Platform Consolidation and XDR Integration (2028–2031) |
    3. 8.3 Regulatory Harmonization Across APAC (2029–2032) |
    4. 8.4 Sovereign and Open-Source Runtime Protection (2032–2035)
  9. 9 Recent Developments & News
  10. 10 Frequently Asked Questions (FAQs)
  11. 11 Report Scope & Methodology |
    1. 11.1 Study Period & Base Year |
    2. 11.2 Data Sources & Citations |
    3. 11.3 Abbreviations
  12. 12 LIST OF TABLES |
  13. TABLE 1 Global Runtime Application Self-Protection Market Size & Forecast, by Revenue (USD Billion), 2021–2035 |
  14. TABLE 2 Global Runtime Application Self-Protection Market — Year-over-Year Growth Analysis, 2021–2035 |
  15. TABLE 3 Global Runtime Application Self-Protection Market — Driver Impact Analysis |
  16. TABLE 4 Global Runtime Application Self-Protection Market — Restraint Impact Analysis |
  17. TABLE 5 Global Runtime Application Self-Protection Market Size, by Component, 2021–2035 (USD Billion) |
  18. TABLE 6 Global Runtime Application Self-Protection Market Size, by Deployment Mode, 2021–2035 (USD Billion) |
  19. TABLE 7 Global Runtime Application Self-Protection Market Size, by End-User Enterprise Size, 2021–2035 (USD Billion) |
  20. TABLE 8 Global Runtime Application Self-Protection Market Size, by End-User Industry, 2021–2035 (USD Billion) |
  21. TABLE 9 Global Runtime Application Self-Protection Market Size, by Region, 2021–2035 (USD Billion) |
  22. TABLE 10 North America Runtime Application Self-Protection Market Size, by Country, 2021–2035 (USD Billion) |
  23. TABLE 11 Europe Runtime Application Self-Protection Market Size, by Country, 2021–2035 (USD Billion) |
  24. TABLE 12 Asia-Pacific Runtime Application Self-Protection Market Size, by Country, 2021–2035 (USD Billion) |
  25. TABLE 13 South America Runtime Application Self-Protection Market Size, by Country, 2021–2035 (USD Billion) |
  26. TABLE 14 Middle East & Africa Runtime Application Self-Protection Market Size, by Country, 2021–2035 (USD Billion) |
  27. TABLE 15 Competitive Benchmarking Matrix — Global Runtime Application Self-Protection Market, 2025 |
  28. TABLE 16 Company Profiles — Key Players, Global Runtime Application Self-Protection Market |
  29. TABLE 17 Recent Developments & Strategic Announcements, 2024–2025 |
  30. TABLE 18 North America Runtime Application Self-Protection Market Size, by Component, 2021–2035 (USD Billion) |
  31. TABLE 19 North America Runtime Application Self-Protection Market Size, by Deployment Mode, 2021–2035 (USD Billion) |
  32. TABLE 20 North America Runtime Application Self-Protection Market Size, by End-User Enterprise Size, 2021–2035 (USD Billion) |
  33. TABLE 21 North America Runtime Application Self-Protection Market Size, by End-User Industry, 2021–2035 (USD Billion) |
  34. TABLE 22 Europe Runtime Application Self-Protection Market Size, by Component, 2021–2035 (USD Billion) |
  35. TABLE 23 Europe Runtime Application Self-Protection Market Size, by Deployment Mode, 2021–2035 (USD Billion) |
  36. TABLE 24 Europe Runtime Application Self-Protection Market Size, by End-User Enterprise Size, 2021–2035 (USD Billion) |
  37. TABLE 25 Europe Runtime Application Self-Protection Market Size, by End-User Industry, 2021–2035 (USD Billion) |
  38. TABLE 26 Asia-Pacific Runtime Application Self-Protection Market Size, by Component, 2021–2035 (USD Billion) |
  39. TABLE 27 Asia-Pacific Runtime Application Self-Protection Market Size, by Deployment Mode, 2021–2035 (USD Billion) |
  40. TABLE 28 Asia-Pacific Runtime Application Self-Protection Market Size, by End-User Enterprise Size, 2021–2035 (USD Billion) |
  41. TABLE 29 Asia-Pacific Runtime Application Self-Protection Market Size, by End-User Industry, 2021–2035 (USD Billion) |
  42. TABLE 30 South America Runtime Application Self-Protection Market Size, by Component, 2021–2035 (USD Billion) |
  43. TABLE 31 South America Runtime Application Self-Protection Market Size, by Deployment Mode, 2021–2035 (USD Billion) |
  44. TABLE 32 South America Runtime Application Self-Protection Market Size, by End-User Enterprise Size, 2021–2035 (USD Billion) |
  45. TABLE 33 South America Runtime Application Self-Protection Market Size, by End-User Industry, 2021–2035 (USD Billion) |
  46. TABLE 34 Middle East & Africa Runtime Application Self-Protection Market Size, by Component, 2021–2035 (USD Billion) |
  47. TABLE 35 Middle East & Africa Runtime Application Self-Protection Market Size, by Deployment Mode, 2021–2035 (USD Billion) |
  48. TABLE 36 Middle East & Africa Runtime Application Self-Protection Market Size, by End-User Enterprise Size, 2021–2035 (USD Billion) |
  49. TABLE 37 Middle East & Africa Runtime Application Self-Protection Market Size, by End-User Industry, 2021–2035 (USD Billion) |
  50. TABLE 38 Report Scope & Methodology Summary |
  51. TABLE 39 Detailed Sources and Citations
  52. 13 LIST OF FIGURES |
  53. FIGURE 1 Runtime Application Self-Protection Market Dynamics — Drivers, Restraints, and Opportunities |
  54. FIGURE 2 Industry Value Chain Analysis — Runtime Application Self-Protection Market |
  55. FIGURE 3 Porter's Five Forces Analysis — Runtime Application Self-Protection Market |
  56. FIGURE 4 Global Runtime Application Self-Protection Market Size Trend (USD Billion), 2021–2035 |
  57. FIGURE 5 Runtime Application Self-Protection Market Share, by Component, 2025 (%) |
  58. FIGURE 6 Runtime Application Self-Protection Market Share, by Deployment Mode, 2025 (%) |
  59. FIGURE 7 Runtime Application Self-Protection Market Share, by End-User Enterprise Size, 2025 (%) |
  60. FIGURE 8 Runtime Application Self-Protection Market Share, by End-User Industry, 2025 (%) |
  61. FIGURE 9 Runtime Application Self-Protection Market Share, by Region, 2025 (%) |
  62. FIGURE 10 North America Runtime Application Self-Protection Market — Country Share, 2025 (%) |
  63. FIGURE 11 Europe Runtime Application Self-Protection Market — Country Share, 2025 (%) |
  64. FIGURE 12 Asia-Pacific Runtime Application Self-Protection Market — Country Share, 2025 (%) |
  65. FIGURE 13 South America Runtime Application Self-Protection Market — Country Share, 2025 (%) |
  66. FIGURE 14 Middle East & Africa Runtime Application Self-Protection Market — Country Share, 2025 (%) |
  67. FIGURE 15 Competitive Landscape — Revenue Share Analysis, 2025 (%) |
  68. FIGURE 16 Runtime Application Self-Protection Market Forecast Scenario Analysis, 2026–2035

Segmentation Quick Reference

DimensionSub-SegmentsDominant SegmentFastest Growing Segment
ComponentSolutions (Web Application Protection, API Protection); Services (Professional, Managed)Solutions — Web Application ProtectionServices — Professional Services
Deployment ModeCloud (Public, Private/Hybrid); On-PremisesCloud — Public CloudCloud — Private/Hybrid Cloud
End-User Enterprise SizeLarge Enterprises; Small and Medium EnterprisesLarge EnterprisesSmall and Medium Enterprises
End-User IndustryBFSI; Healthcare; IT & Telecommunications; Government & Defense; Retail & E-CommerceBFSIHealthcare
GeographyNorth America; Europe; Asia-Pacific; South America; Middle East & AfricaNorth AmericaAsia-Pacific


Market Segmentation Overview

By Component

Sub-SegmentKey Trend
Solutions — Web Application ProtectionCore budget item driven by regulatory compliance for public-facing web applications
Solutions — API ProtectionFastest-growing solution sub-category as API endpoints multiply across enterprise architectures
Services — Professional ServicesRising demand for deployment consulting and CI/CD integration advisory
Services — Managed ServicesSME adoption catalyst through subscription-based monitoring and tuning


The component dimension splits revenue between software solutions and supporting services. Solutions generate the majority of spending, anchored by web application protection agents that instrument Java and.NET runtimes. Services are accelerating as enterprises seek external expertise to manage agent lifecycle operations.

By Deployment Mode

Sub-SegmentKey Trend
Cloud — Public CloudDominant mode as workloads migrate to AWS, Azure, and GCP with native container support
Cloud — Private/Hybrid CloudGrowing among regulated industries balancing cloud agility with data-sovereignty controls
On-PremisesStable niche for defense, intelligence, and high-frequency trading environments


Cloud deployment leads this dimension by a wide margin, reflecting the broader enterprise infrastructure shift. On-premises deployments persist in verticals where data sensitivity or latency requirements preclude cloud migration.

By End-User Enterprise Size

Sub-SegmentKey Trend
Large EnterprisesLargest revenue contributors with complex, multi-application environments requiring granular protection
Small and Medium EnterprisesFastest-growing segment driven by affordable SaaS-delivered agent models and managed service bundles


Large enterprises set the spending baseline, but SMEs represent the growth frontier as vendors democratize access through simplified deployment and consumption-based pricing.

By End-User Industry

Sub-SegmentKey Trend
BFSILargest vertical driven by PCI DSS 4.0, open-banking mandates, and transaction-fraud prevention
HealthcareFastest-growing vertical as connected medical devices expand attack surfaces
IT & TelecommunicationsHigh agent density across SaaS platforms and network-function virtualization stacks
Government & DefenseZero-trust architecture mandates drive adoption across federal and allied-nation agencies
Retail & E-CommercePayment-fraud prevention and bot mitigation fuel seasonal deployment spikes


Industry verticals shape demand patterns distinctly. BFSI and healthcare together account for the most concentrated adoption, while IT and government sectors prioritize integration with existing security operations center workflows.


Download PDF ×

We do not share your information with anyone. However, we may send you emails based on your report interest from time to time. You may contact us at any time to opt-out.