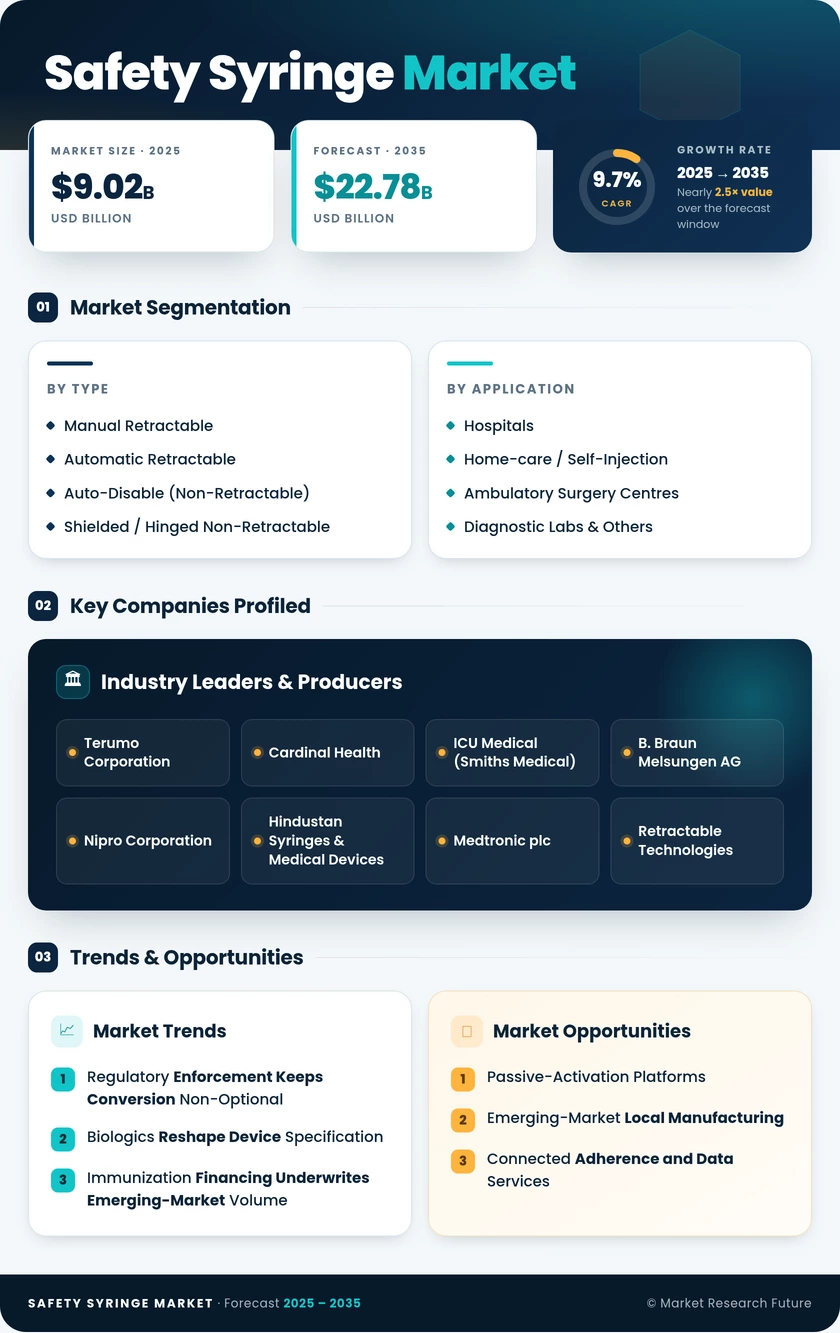
Safety Syringe Market (2026 - 2035)

Safety Syringe Market Research Report By Syringe Type (Auto-disable Syringes, Retractable Syringes, Passive Safety Syringes, Active Safety Syringes), By Material (Plastic, Glass, Metal), By Application (Vaccination, Drug Administration, Blood Sample Collection, Insulin Delivery), By End User (Hospitals, Clinics, Home Care Settings, Pharmaceutical Companies), By Needle Size (Low Gauge, Medium Gauge, High Gauge) and By Regional (North America, Europe, South America, Asia Pacific, Middle East and Africa) - Growth & Industry Forecast 2025 To 2035

Forecast Period
2026-2035
CAGR
9.7%
2025 Market Size
USD 9.02 Billion
2035 Market Size
USD 22.78 Billion
Healthcare ● Updated August 2026 Report ID: MRFR/HC/30703-HCR | Pages: 128 | Author: Rahul Gotadki, Vikita Thakur
  1. 1 Market Summary |
    1. 1.1 Study Assumptions & Market Definition |
    2. 1.2 Scope of the Study |
    3. 1.3 Research Methodology
  2. 2 Key Report Takeaways |
    1. 2.1 By Product Type |
    2. 2.2 By End User |
    3. 2.3 By Geography
  3. 3 Market Size & Forecast (2021–2035) |
    1. 3.1 Historical Market Size (2021–2024) |
    2. 3.2 Base Year Assessment (2025) |
    3. 3.3 Forecast Market Size (2026–2035) |
    4. 3.4 Year-over-Year Growth Analysis
  4. 4 Driver Impact Analysis |
    1. 4.1 Regulatory Enforcement Keeps Conversion Non-Optional |
    2. 4.2 Biologics Reshape Device Specification |
    3. 4.3 Immunization Financing Underwrites Emerging-Market Volume |
    4. 4.4 Home Care Rewrites the Buyer Profile
  5. 5 Restraints Impact Analysis |
    1. 5.1 Price Premiums Still Bite in Low-Income Tenders |
    2. 5.2 Resin and Component Supply Remain Fragile |
    3. 5.3 Training Friction Slows Conversion
  6. 6 Opportunities |
    1. 6.1 Passive-Activation Platforms |
    2. 6.2 Emerging-Market Local Manufacturing |
    3. 6.3 Connected Adherence and Data Services |
    4. 6.4 Sustainability-Linked Device Redesign |
    5. 6.5 Pharmacy and Retail Channel Expansion
  7. 7 Regional Market Share & Country-Level Analysis |
    1. 7.1 North America | |
      1. 7.1.1 US | |
      2. 7.1.2 Canada | |
      3. 7.1.3 Mexico |
    2. 7.2 Europe | |
      1. 7.2.1 Germany | |
      2. 7.2.2 UK | |
      3. 7.2.3 France | |
      4. 7.2.4 Italy | |
      5. 7.2.5 Spain | |
      6. 7.2.6 Nordic Countries | |
      7. 7.2.7 Russia | |
      8. 7.2.8 Rest of Europe |
    3. 7.3 Asia-Pacific | |
      1. 7.3.1 China | |
      2. 7.3.2 India | |
      3. 7.3.3 Japan | |
      4. 7.3.4 South Korea | |
      5. 7.3.5 ASEAN | |
      6. 7.3.6 Rest of Asia-Pacific |
    4. 7.4 South America | |
      1. 7.4.1 Brazil | |
      2. 7.4.2 Argentina | |
      3. 7.4.3 Rest of South America |
    5. 7.5 Middle East & Africa | |
      1. 7.5.1 Saudi Arabia | |
      2. 7.5.2 UAE | |
      3. 7.5.3 South Africa | |
      4. 7.5.4 Egypt | |
      5. 7.5.5 Rest of Middle East & Africa
  8. 8 Future Outlook (2026–2035) |
    1. 8.1 Passive Safety Becomes the Default Specification |
    2. 8.2 Connected Devices and Adherence Economics |
    3. 8.3 Regionalized Manufacturing Footprints |
    4. 8.4 Sustainability Enters Tender Scoring
  9. 9 Market Segmentation Analysis |
    1. 9.1 By Product Type | |
      1. 9.1.1 Manual Retractable | |
      2. 9.1.2 Automatic Retractable | |
      3. 9.1.3 Auto-Disable (Non-Retractable) | |
      4. 9.1.4 Shielded / Hinged Non-Retractable |
    2. 9.2 By Application | |
      1. 9.2.1 Drug Delivery | |
      2. 9.2.2 Vaccination | |
      3. 9.2.3 Blood Specimen Collection | |
      4. 9.2.4 Insulin Administration | |
      5. 9.2.5 Others |
    3. 9.3 By End User | |
      1. 9.3.1 Hospitals | |
      2. 9.3.2 Ambulatory Surgery Centres | |
      3. 9.3.3 Home-care / Self-Injection | |
      4. 9.3.4 Diagnostic Labs & Others
  10. 10 Competitive Landscape |
    1. 10.1 Market Concentration Analysis |
    2. 10.2 Competitive Benchmarking Matrix |
    3. 10.3 Company Profiles
  11. 11 Recent News & Developments
  12. 12 Report Scope & Methodology
  13. 13 Detailed Sources & Citations
  14. 14 Frequently Asked Questions
  15. 15 LIST OF TABLES |
  16. TABLE 1 Global Safety Syringe Market Size & Forecast, by Revenue (USD Billion), 2021–2035 |
  17. TABLE 2 Global Safety Syringe Market – Year-over-Year Growth Analysis, 2021–2035 |
  18. TABLE 3 Driver Impact Analysis Matrix, 2026–2035 |
  19. TABLE 4 Restraint Impact Analysis Matrix, 2026–2035 |
  20. TABLE 5 Global Safety Syringe Market Size, by Region, 2021–2035 (USD Billion) |
  21. TABLE 6 North America Safety Syringe Market Size, by Country, 2021–2035 (USD Billion) |
  22. TABLE 7 Europe Safety Syringe Market Size, by Country, 2021–2035 (USD Billion) |
  23. TABLE 8 Asia-Pacific Safety Syringe Market Size, by Country, 2021–2035 (USD Billion) |
  24. TABLE 9 South America Safety Syringe Market Size, by Country, 2021–2035 (USD Billion) |
  25. TABLE 10 Middle East & Africa Safety Syringe Market Size, by Country, 2021–2035 (USD Billion) |
  26. TABLE 11 Global Safety Syringe Market Size, by Product Type, 2021–2035 (USD Billion) |
  27. TABLE 12 Global Safety Syringe Market Size, by Application, 2021–2035 (USD Billion) |
  28. TABLE 13 Global Safety Syringe Market Size, by End User, 2021–2035 (USD Billion) |
  29. TABLE 14 North America Safety Syringe Market Size, by Product Type, 2021–2035 (USD Billion) |
  30. TABLE 15 Europe Safety Syringe Market Size, by Application, 2021–2035 (USD Billion) |
  31. TABLE 16 Asia-Pacific Safety Syringe Market Size, by End User, 2021–2035 (USD Billion) |
  32. TABLE 17 Competitive Benchmarking Matrix – Global Safety Syringe Market, 2026 |
  33. TABLE 18 Company Profiles – Key Players, Global Safety Syringe Market |
  34. TABLE 19 Recent Developments & Strategic Announcements, 2023–2025 |
  35. TABLE 20 Report Scope & Methodology Summary |
  36. TABLE 21 Detailed Sources & Citations Index
  37. 16 LIST OF FIGURES |
  38. FIGURE 1 Global Safety Syringe Market – Market Dynamics Overview (Drivers, Restraints, Opportunities) |
  39. FIGURE 2 Industry Value Chain Analysis – Resin to End-User Disposal |
  40. FIGURE 3 Porter's Five Forces Analysis – Global Safety Syringe Market |
  41. FIGURE 4 Global Market Size Trend & Forecast, 2021–2035 (USD Billion) |
  42. FIGURE 5 Year-over-Year Growth Trajectory, 2022–2035 (%) |
  43. FIGURE 6 Market Share by Product Type, 2025 vs 2035 (%) |
  44. FIGURE 7 Market Share by Application, 2025 (%) |
  45. FIGURE 8 Market Share by End User, 2025 (%) |
  46. FIGURE 9 Regional Revenue Share Distribution, 2025 (%) |
  47. FIGURE 10 Regional CAGR Comparison, 2026–2035 (%) |
  48. FIGURE 11 Country-Level Revenue Heat Map, 2025 |
  49. FIGURE 12 Competitive Landscape – Estimated Revenue Share Bands, 2026 |
  50. FIGURE 13 Strategic Positioning Matrix – Scale vs Specialization |
  51. FIGURE 14 Conversion Curve – Unprotected to Protected Device Adoption, 2021–2035
Share::
Request Free Sample

Segmentation Quick Reference

DimensionSub-SegmentsDominant SegmentFastest Growing Segment
By Product TypeManual Retractable; Automatic Retractable; Auto-Disable (Non-Retractable); Shielded / Hinged Non-RetractableManual RetractableAutomatic Retractable
By ApplicationDrug Delivery; Vaccination; Blood Specimen Collection; Insulin Administration; OthersDrug DeliveryVaccination
By End UserHospitals; Ambulatory Surgery Centres; Home-care / Self-Injection; Diagnostic Labs & OthersHospitalsHome-care / Self-Injection
By GeographyNorth America; Europe; Asia-Pacific; South America; Middle East & AfricaNorth AmericaAsia-Pacific


Market Segmentation Overview

By Product Type

Sub-SegmentKey Trend
Manual RetractableRemains the default protected format on cost and clinician familiarity
Automatic RetractableGains share wherever staffing pressure raises activation-failure risk
Auto-Disable (Non-Retractable)Locked into donor-funded immunization specifications
Shielded / Hinged Non-RetractableConcentrated in phlebotomy and specimen collection workflows


Product architecture is converging on protection that does not depend on user action. Manual designs retain volume leadership through the forecast, but their share erodes steadily as passive and automatic formats reach cost parity in the early 2030s.

By Application

Sub-SegmentKey Trend
Drug DeliveryBiologic viscosity drives premium device specification
VaccinationDonor-financed campaigns sustain very high unit volumes
Blood Specimen CollectionDiagnostic throughput growth supports steady replacement demand
Insulin AdministrationSelf-injection design priorities reshape packaging and labelling
OthersDental, veterinary, and research niches with specialized formats


Application mix splits the supplier base. Firms serving drug delivery compete on engineering and pharma partnership; those serving vaccination compete on manufacturable cost at scale. Few companies succeed at both without separate production platforms.

By End User

Sub-SegmentKey Trend
HospitalsLong contract cycles lock specification for three to five years
Ambulatory Surgery CentresOutpatient migration expands a historically secondary channel
Home-care / Self-InjectionFastest growth; demands intuitive activation and retail packaging
Diagnostic Labs & OthersThroughput-driven demand tied to testing volumes


End-user structure is shifting away from a single dominant buyer type. Hospitals still set specifications that ripple outward, yet home care increasingly commands product decisions of its own — smaller packs, clearer instructions, and disposal solutions built for a kitchen drawer rather than a clinical utility room.




Share::
Request Free Sample
Download PDF ×

We do not share your information with anyone. However, we may send you emails based on your report interest from time to time. You may contact us at any time to opt-out.