Server Storage Area Network Market (2025 - 2035)

Storage Area Network Market Size, Share and Research Report By Product Type (Hardware, Software, Services), By Technology Type (Fibre Channel SAN, iSCSI SAN, NVMe-over-Fabrics, Others (FCoE, InfiniBand)), By Organization Size (Large Enterprises, Small and Medium Enterprises), By End-User Industry (BFSI, IT and Telecom, Healthcare and Life Sciences, Media and Entertainment, Cloud Service Providers, Others (Government, Manufacturing)) and By Regional (North America, Europe, South America, Asia Pacific, Middle East and Africa) - Industry Forecast to 2035.
ID: MRFR/ICT/4399-HCR
100 Pages
Ankit Gupta, Shubham Munde
Last Updated: July 10, 2026
Server Storage Area Network Market
Market Size
Forecast Period2025-2035
CAGR (2025-2035)9.50%
2025 Market SizeUSD 26.10 Billion
2035 Market SizeUSD 64.70 Billion
Key Players
Dell Technologies
Hewlett Packard Enterprise
NetApp
IBM
Pure Storage
Broadcom
Opportunities
  • AI-Optimized Storage Fabrics
  • Storage-as-a-Service for Mid-Market Enterprises
  • Sovereign-Cloud Mandates in Emerging Markets

Server Storage Area Network Market Summary

The Server Storage Area Network Market reached USD 26.10 Billion in 2025 and is projected to climb from USD 28.58 Billion in 2026 to USD 64.70 Billion by 2035, registering a 9.50% CAGR during the forecast period. Hyperscale data-center capital expenditure — which topped USD 260 Billion globally in 2024 according to Synergy Research Group [1] — remains the single largest catalyst, as every new AI training cluster and cloud availability zone demands high-throughput, low-latency block storage fabrics. Simultaneously, government digital-infrastructure mandates such as the EU's Digital Decade program and India's Digital India initiative are channeling public funds into enterprise-grade networking overhauls that directly benefit storage area network deployments.

A technology inflection is reshaping the Server Storage Area Network Market from the ground up. Legacy 16 Gbps Fibre Channel fabrics are giving way to 64 Gbps and 128 Gbps generations, while NVMe-over-Fabrics is collapsing the latency gap between direct-attached and networked storage to single-digit microseconds. Vendors are layering computational storage engines, CXL-enabled memory pooling, and software-defined orchestration into unified platforms — blurring the boundary between compute and storage domains. estimates that by 2027, over 40% of new SAN deployments will be software-defined [2], a shift that accelerates refresh cycles and pulls services revenue forward.

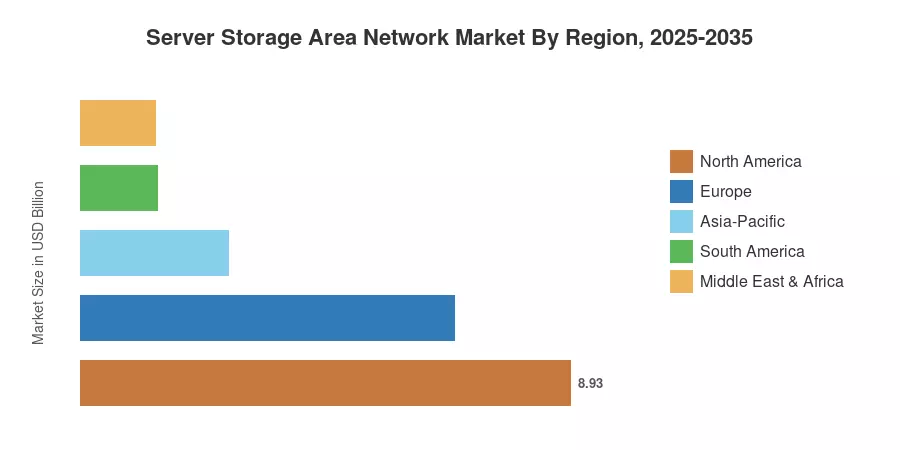
North America commanded roughly 34.2% of the Server Storage Area Network Market in 2024, propelled by U.S. hyperscaler spend and federal data-sovereignty requirements. Asia-Pacific is advancing at the fastest clip — a 10.30% CAGR through 2035 — driven by sovereign-cloud buildouts across China, India, and ASEAN nations. Europe held the second-largest share at approximately 26.1%, anchored by GDPR-driven data-localization and banking-sector modernization programs. As AI workloads, edge computing, and consumption-based procurement converge, the Server Storage Area Network Market is entering its most dynamic decade since the original Fibre Channel standardization era.


Key Report Takeaways

• By Product Type

  • Hardware accounted for roughly 42.5% of Server Storage Area Network Market revenue in 2024, underpinned by continued demand for high-port-count directors and all-flash arrays.
  • Services are poised to register the fastest segment CAGR of approximately 12.10% through 2035 as enterprises shift to consumption-based managed-SAN offerings.

• By Technology

  • Fibre Channel retained the leading technology share in 2024, valued at an estimated USD 11.18 Billion.
  • NVMe-over-Fabrics is projected to expand at a 11.50% CAGR through 2035 as AI inference clusters demand sub-10-microsecond latency.

• By Organization Size

  • Large enterprises represented approximately 58.8% of the Server Storage Area Network Market in 2024.
  • Small and medium enterprises are growing fastest, with a CAGR near 13.40% as cloud-managed SAN appliances lower entry barriers.

• By End-User Industry

  • BFSI captured roughly 23.4% of the Server Storage Area Network Market revenue in 2024, driven by real-time transaction processing and regulatory archiving requirements.
  • Cloud service providers are forecast to post the highest end-user CAGR of approximately 10.60% through 2035.

• By Region

  • North America led the Server Storage Area Network Market with a 34.2% share in 2024.
  • Asia-Pacific is the fastest-growing region, advancing at a 10.30% CAGR.


Market Size and Forecast (2021–2035)

Market Research Future's estimates integrate primary interviews with storage OEMs, channel partners, and enterprise CIOs alongside secondary data from vendor earnings disclosures, infrastructure spending trackers, and government procurement databases. Historical values (2021–2024) reflect actual shipment and revenue data; the forecast (2026–2035) uses a bottom-up model calibrated to workload growth projections, technology migration curves, and regional capital-expenditure plans.
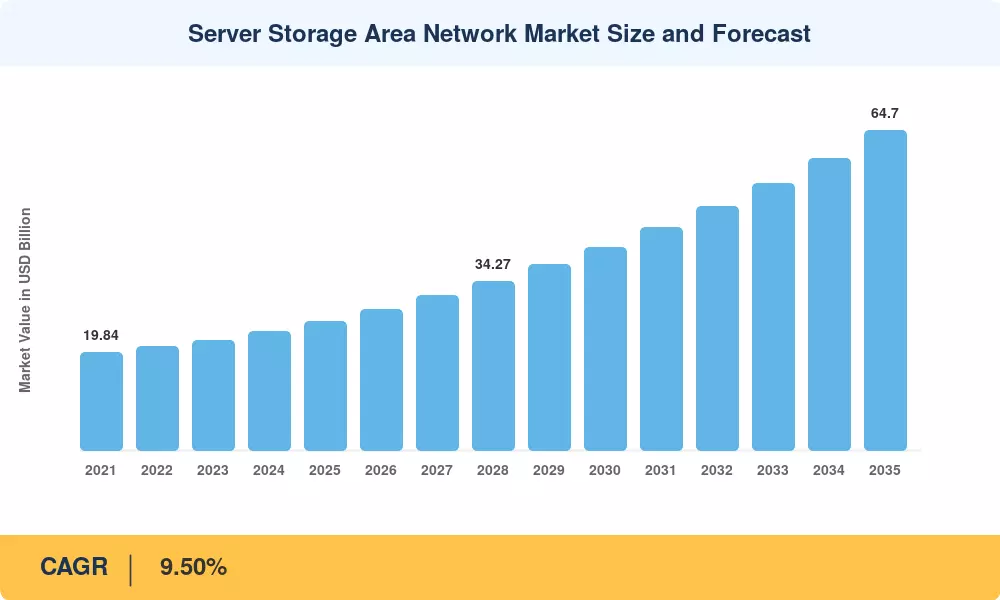
Server Storage Area Network Market Size and Forecast
Our Impact
Enabled $4.3B Revenue Impact for Fortune 500 and Leading Multinationals
Partnering with 2000+ Global Organizations Each Year
30K+ Citations by Top-Tier Firms in the Industry

Driver Impact Analysis

Driver ~% Impact on CAGR Geographic Relevance Impact Timeline
Hyperscale data-center CAPEX expansion +2.4% Global Short-term (≤2 yr)
AI / ML workload proliferation +2.1% North America, Asia-Pacific Medium-term (2–4 yr)
NVMe-over-Fabrics technology migration +1.5% Global Medium-term (2–4 yr)
Consumption-based / STaaS procurement models +1.2% North America, Europe Long-term (≥4 yr)
Sovereign-cloud and data-residency mandates +0.9% Europe, Asia-Pacific Medium-term (2–4 yr)
5G/edge computing infrastructure build +0.7% Asia-Pacific, MEA Long-term (≥4 yr)
CXL and computational storage convergence +0.5% North America Long-term (≥4 yr)


Hyperscale Data-Center CAPEX Expansion

Hyperscaler capital spending surpassed USD 260 Billion in 2024 [1], with Microsoft, Google, and Amazon each disclosing double-digit percentage increases for 2025–2026 build plans. Every new availability zone requires dense SAN fabrics — typically 256-port director-class switches and petabyte-scale all-flash arrays — translating directly into Server Storage Area Network Market growth. The U.S. CHIPS and Science Act is further catalyzing domestic data-center construction, which in turn stimulates demand for locally deployed high-speed storage networks.

AI and ML Workload Proliferation

Training large language models demands sustained sequential reads at line rate across thousands of GPUs, a workload profile tailor-made for high-bandwidth SAN architectures. NVIDIA's DGX SuperPOD reference designs, for instance, specify NVMe-oF storage tiers capable of 400 Gbps aggregate throughput per rack [5]. As enterprises move from experimentation to production AI, the Server Storage Area Network Market benefits from both new-build clusters and retrofit upgrades to existing facilities.

NVMe-over-Fabrics Technology Migration

The T11 standards body ratified FC-NVMe-3 in 2024, enabling end-to-end NVMe semantics over existing Fibre Channel infrastructure without forklift upgrades [4]. This lowers the migration barrier for the installed base of approximately 12 million FC ports worldwide, accelerating the transition from SCSI to NVMe command sets. Enterprises running latency-sensitive databases — particularly in BFSI and healthcare — are among the earliest adopters, pulling forward refresh cycles that lift the Server Storage Area Network Market.

Consumption-Based Procurement Models

HPE GreenLake, Dell APEX, and Pure Storage Evergreen//One collectively reported over USD 10 Billion in as-a-service committed contracts by mid-2025 [7]. These pay-as-you-grow offerings convert SAN from a capital expenditure into an operating expense, shortening procurement cycles from 12–18 months to weeks. The model is particularly attractive to mid-market buyers, enabling the Server Storage Area Network Market to penetrate organizations that previously relied on DAS or low-cost NAS.


Restraints Impact Analysis

The restraint estimates below represent approximate negative pressure on demand growth. They do not mechanically subtract from the headline CAGR, as mitigation strategies and vendor responses partially offset each factor.

Restraint ~% Impact on CAGR Geographic Relevance Impact Timeline
NAND flash and optics pricing volatility −0.8% Global Short-term (≤2 yr)
Shortage of certified SAN administrators −0.6% Global Medium-term (2–4 yr)
Competitive displacement by hyper-converged infrastructure −0.5% North America, Europe Medium-term (2–4 yr)
Interoperability complexity across multi-vendor fabrics −0.4% Global Long-term (≥4 yr)
Energy and cooling cost escalation −0.3% Europe, Asia-Pacific Medium-term (2–4 yr)


NAND Flash and Optics Pricing Volatility

TrendForce reported that enterprise SSD contract prices rose 15–20% quarter-over-quarter in late 2024 as memory vendors cut wafer starts during the 2023 downturn [10]. Although pricing is expected to stabilize by 2026, the near-term squeeze compresses storage-array gross margins and can delay procurement decisions — particularly among price-sensitive SMEs. Vendors are mitigating the impact through pay-as-you-grow contracts that spread cost over multi-year commitments, but the volatility still dampens short-term Server Storage Area Network Market momentum.

Competitive Displacement by Hyper-Converged Infrastructure

HCI platforms from Nutanix and VMware (Broadcom) bundle compute, storage, and networking into a single appliance, appealing to organizations that prioritize operational simplicity over raw storage performance. estimates that HCI captured approximately 18% of the overall storage market in 2024 [12]. While HCI is unlikely to displace SAN in mission-critical transaction-processing or AI workloads, it does siphon budget from departmental and branch-office deployments that once defaulted to entry-level SAN.

Skilled Administrator Shortage

The global pool of certified SAN professionals — holding credentials such as Brocade Certified Fabric Professional or Cisco MDS specialist certifications — has not kept pace with deployment growth. A 2024 (ISC)² survey estimated a 28% shortfall in storage networking specialists across North America and Europe [11], adding project-delivery risk and raising labor costs that can slow enterprise adoption.


Server Storage Area Network Market Opportunities

AI-Optimized Storage Fabrics

A greenfield opportunity is presented by purpose-built SAN systems integrating NVMe-oF switching and GPU-direct storage access. Bypassing the CPU to transport data directly between NVMe drives and GPU memory, NVIDIA GPUDirect Storage can boost AI training data-load speed by up to 5× [5]. Vendors that co-engineer switches, HBAs and firmware for this process are positioned to take an outsized portion of the Server Storage Area Network Market’s fastest increasing workload sector.


Storage-as-a-Service for Mid-Market Enterprises

SAN models based on consumption are still immature for firms with fewer than 1,000 employees. Both Dell and HPE indicated less than 15% of their STaaS reservations in 2024 were from clients with fewer than 1,000 seats, showing the white space [7]. Managed-SAN bundles, charged per terabyte per month, may open a channel-friendly segment that materially contributes to Server Storage Area Network Market expansion through 2035.


Sovereign-Cloud Mandates in Emerging Markets

India’s MeitY cloud-first strategy, Brazil’s LGPD data-residency requirements and Saudi Arabia’s NDMO cloud-computing regulations all require data to be processed in-country, which in turn encourages local data-center build and, by extension, SAN buying. South America and Middle East & Africa Server Storage Area Network Market is expected to develop at a high-single-digit CAGR till 2035 and provides a diversification opportunity to the providers heavily weighted to North America and Europe.


Data Monetization and Real-Time Analytics Platforms

The exact workload profile where SAN designs win over object stores and distributed file systems is real-time analytics lakes that financial institutions and telecom operators are creating, and demand microsecond-latency access to petabytes of structured data. The global real time analytics market was above USD 30 Billion in 2024. Each new deployment normally requires a high speed SAN back end.


Sustainability-Driven Refresh Cycles

The EU's Corporate Sustainability Reporting Directive (CSRD) requires large enterprises to disclose Scope 2 and Scope 3 emissions from IT infrastructure starting in 2025 [14]. Newer SAN platforms consume 30–40% less power per IOPS than equipment deployed five years ago, giving CIOs both a regulatory and an economic incentive to accelerate refresh. This regulatory push converts deferred Server Storage Area Network Market demand into near-term orders.


Server Storage Area Network Market Future Outlook

Autonomous Storage Operations

AIOps platforms are moving beyond anomaly detection toward fully autonomous storage provisioning, tiering, and remediation. By 2030, projects that 60% of large-enterprise SAN environments will operate with minimal human intervention [16]. The Server Storage Area Network Market will increasingly reward vendors whose control planes integrate predictive analytics, intent-based policies, and closed-loop automation that eliminate manual zoning and performance tuning.

Composable and Disaggregated Architectures

CXL 3.0 and Gen-Z interconnects are enabling memory-and-storage disaggregation at rack scale, allowing compute nodes to dynamically attach to shared NVMe pools without dedicated SAN switches. While this threatens traditional director-class hardware revenue, it simultaneously expands the addressable market by embedding SAN-like semantics into every server chassis. The net effect for the Server Storage Area Network Market is a shift in value from discrete hardware to orchestration software and fabric services.

Sustainability and Circular-Economy Pressures

Data centers consumed an estimated 460 TWh of electricity globally in 2024, and the share attributable to storage networking is growing as data volumes compound [14]. Upcoming EU Ecodesign regulations and U.S. EPA Energy Star specifications for storage equipment will set mandatory efficiency thresholds, accelerating retirement of legacy arrays. Vendors offering carbon-neutral lifecycle services — from manufacturing through decommissioning — will gain procurement preference in regulated verticals.

Platform Economics and Ecosystem Lock-In

The competitive landscape is pivoting toward platform economics, where storage vendors bundle arrays, switches, management software, and cloud connectivity into integrated stacks. Dell APEX, HPE GreenLake, and Pure Storage Evergreen//Flex each aim to become the "single pane" for hybrid-cloud storage operations. This platformization deepens customer lock-in but also raises switching costs, concentrating Server Storage Area Network Market share among vendors with the broadest portfolios.


Server Storage Area Network Market Segmentation

By Product Type

Segment Key Metric Primary Demand Driver
Hardware 42.5% share (2024) Director-class switch and all-flash array refresh
Software USD 6.37 Billion (2025) Software-defined SAN and orchestration platforms
Services CAGR 12.10% (2026–2035) Managed-SAN and STaaS adoption


Hardware remains the Server Storage Area Network Market's revenue anchor, driven by ongoing demand for 64 Gbps Fibre Channel directors, NVMe all-flash arrays, and high-density HBAs. However, the hardware share is trending downward as software-defined architectures decouple control-plane intelligence from proprietary hardware, enabling commodity white-box switches to handle SAN workloads. Director-class platforms from Broadcom (Brocade) and Cisco continue to dominate mission-critical environments where sub-millisecond failover and guaranteed in-order delivery are non-negotiable.

Services represent the fastest-growing product category in the Server Storage Area Network Market, fueled by the shift to consumption-based procurement. Managed-SAN offerings bundle monitoring, patching, and capacity planning into monthly per-terabyte fees, converting what was historically a lumpy capital purchase into predictable operational expenditure. Professional services — including fabric design, migration planning, and performance optimization — add a high-margin overlay that vendors increasingly view as a strategic differentiator.

By Technology Type

Segment Key Metric Primary Demand Driver
Fibre Channel SAN 43.1% share (2024) Installed-base momentum in BFSI and healthcare
iSCSI SAN USD 4.89 Billion (2025) Cost-effective SME deployments
NVMe-over-Fabrics CAGR 11.50% (2026–2035) AI/ML and real-time analytics workloads
Others (FCoE, InfiniBand) 8.6% share (2024) Niche HPC and legacy environments


Fibre Channel's dominance in the Server Storage Area Network Market reflects decades of installed-base inertia, lossless fabric guarantees, and the backward-compatible upgrade path from 16 Gbps to 64 Gbps and beyond. Financial institutions and hospitals — where a dropped frame can mean a failed transaction or a lost medical image — continue to specify FC as the default transport.

NVMe-over-Fabrics is the technology segment's growth story. By exposing NVMe command sets natively across Ethernet or FC fabrics, NVMe-oF collapses the software stack from seven layers to three, delivering latencies as low as 5 microseconds for 4 KB random reads. AI training pipelines, genomics sequencing, and high-frequency trading platforms are the primary demand drivers, and every major storage OEM now ships NVMe-oF-ready arrays.

By Organization Size

Segment Key Metric Primary Demand Driver
Large Enterprises 58.8% share (2024) Mission-critical workloads and regulatory compliance
Small and Medium Enterprises CAGR 13.40% (2026–2035) Cloud-managed SAN appliances and STaaS


Large enterprises continue to dominate the Server Storage Area Network Market because their transaction volumes, compliance obligations, and uptime SLAs demand dedicated, high-performance storage fabrics. Banks processing millions of SWIFT messages daily, hospitals storing DICOM imaging studies at petabyte scale, and telecom operators running real-time billing engines all require the deterministic performance that SAN architectures deliver.

SMEs represent the market's fastest-growing organization segment, driven by simplified cloud-managed SAN appliances that eliminate the need for on-site Fibre Channel expertise. Products such as Pure Storage FlashArray//C and Dell PowerStore entry-tier models offer all-flash SAN performance at price points accessible to mid-market buyers, while STaaS contracts remove upfront capital barriers entirely.

By End-User Industry

Segment Key Metric Primary Demand Driver
BFSI 23.4% share (2024) Real-time transaction processing and compliance archiving
IT and Telecom USD 5.22 Billion (2025) 5G core and edge data centers
Healthcare and Life Sciences CAGR 10.20% (2026–2035) Medical imaging and genomics data growth
Media and Entertainment 8.3% share (2024) 4K/8K content production and streaming
Cloud Service Providers CAGR 10.60% (2026–2035) Multi-tenant block storage at scale
Others (Government, Manufacturing) USD 3.74 Billion (2025) Smart-city and Industry 4.0 programs


BFSI is the Server Storage Area Network Market's largest vertical because trading platforms, core banking systems, and regulatory data lakes require guaranteed low-latency, zero-data-loss storage. Basel III and MiFID II mandate that transaction records be stored on immutable, rapidly retrievable media, which effectively mandates SAN-class infrastructure.

Cloud service providers are the fastest-growing end-user segment. AWS, Azure, and GCP each operate proprietary block-storage services underpinned by custom SAN fabrics, and regional cloud operators in Asia-Pacific and the Middle East are replicating these architectures at smaller scale. Every new cloud region adds incremental demand to the Server Storage Area Network Market.


Regional Market Share Analysis

Region Key Metric Primary Investment Themes
North America 34.2% share (2024) Hyperscaler CAPEX; federal data sovereignty
Europe 26.1% share (2024) GDPR compliance; banking modernization
Asia-Pacific 10.30% CAGR (2026–2035) Sovereign cloud; digital transformation
South America USD 1.41 Billion (2025) LGPD data residency; fintech expansion
Middle East & Africa 5.2% share (2024) Smart-city programs; oil & gas digitization
Total USD 26.10 Billion (2025)

The Server Storage Area Network Market exhibits distinct regional dynamics shaped by data-center density, regulatory posture, and enterprise cloud-adoption maturity.


North America

Country Key Metric Key Driver
United States 78.4% of regional share Hyperscaler campus expansion
Canada CAGR 8.9% Public-sector cloud migration
Mexico USD 0.42 Billion (2025) Nearshoring data-center investment


The United States alone houses more than 5,400 colocation and hyperscale data centers, each of which requires high-density SAN fabrics for mission-critical block storage [1]. Federal mandates under FedRAMP High and CMMC 2.0 are pushing defense and intelligence agencies toward dedicated SAN environments, while Canadian health authorities are consolidating provincial health records onto centralized storage platforms. Mexico's nearshoring trend is attracting data-center investment from Equinix and KIO Networks, expanding the Server Storage Area Network Market's addressable base southward.

Europe

Country Key Metric Key Driver
Germany 22.3% of regional share Industrie 4.0 manufacturing digitization
United Kingdom CAGR 8.7% Financial-services modernization
France USD 1.12 Billion (2025) Nuclear energy data infrastructure
Italy CAGR 8.4% Public-administration cloud migration
Spain 7.8% of regional share Telecom consolidation
Nordic Countries CAGR 9.1% Green data-center expansion
Russia USD 0.38 Billion (2025) Import-substitution programs
Rest of Europe 14.6% of regional share EU cohesion-fund digital grants


GDPR's data-localization requirements have made on-premises or in-country SAN a compliance necessity for financial and healthcare organizations. Germany's BSI IT-Grundschutz framework mandates block-level encryption on SAN fabrics handling classified data, while the UK's Financial Conduct Authority is driving Tier-1 banks to upgrade legacy storage arrays to meet sub-millisecond settlement-system latency targets. Nordic nations are capitalizing on low electricity costs and cool climates to attract hyperscale campuses, indirectly expanding the Server Storage Area Network Market in the region.

Asia-Pacific

Country Key Metric Key Driver
China 36.5% of regional share Domestic cloud and AI buildout
India CAGR 11.2% Digital India; UPI transaction growth
Japan USD 1.58 Billion (2025) Enterprise refresh cycle
South Korea CAGR 9.8% Semiconductor R&D clusters
ASEAN 14.1% of regional share Smart-city and fintech expansion
Rest of Asia-Pacific CAGR 9.3% Telecom infrastructure upgrades


China's "East Data, West Computing" initiative is deploying eight national computing hubs, each requiring large-scale SAN infrastructure for distributed AI training and government e-services [8]. India's Unified Payments Interface processed over 14 Billion transactions per month by late 2024, and the back-end banking infrastructure behind UPI relies heavily on high-availability SAN clusters. Japan's enterprise sector is entering a generational refresh, replacing aging FC16 fabrics with 64 Gbps platforms, while South Korea's semiconductor fabs are adopting high-performance storage networks to manage terabytes of metrology and yield data in near-real time.

South America

Country Key Metric Key Driver
Brazil 62.8% of regional share LGPD compliance; fintech boom
Argentina CAGR 8.2% Banking digitization
Rest of South America USD 0.21 Billion (2025) Telecom modernization


Brazil's Lei Geral de Proteção de Dados has prompted domestic banks and health insurers to invest in localized SAN deployments rather than offshore cloud storage, reinforcing the Server Storage Area Network Market growth trajectory in Latin America's largest economy. Argentina's central bank modernization program is consolidating retail payment processing onto fault-tolerant SAN arrays, adding incremental demand.

Middle East & Africa

Country Key Metric Key Driver
Saudi Arabia 32.4% of regional share Vision 2030 smart-city projects
UAE CAGR 9.6% DIFC financial data centers
South Africa USD 0.19 Billion (2025) Mining and financial services
Egypt CAGR 8.8% New Administrative Capital IT build
Rest of MEA 22.7% of regional share Oil & gas digital oilfield programs


Saudi Arabia's NEOM and Riyadh smart-city initiatives require ground-up data-center construction with high-performance SAN fabrics. The UAE's DIFC and ADGM financial zones mandate on-premises data residency for regulated entities, directly benefiting the Server Storage Area Network Market in the Gulf region. South Africa's JSE-listed banks and mining conglomerates are mid-cycle in storage modernization programs, while Egypt's New Administrative Capital is anchoring government IT on domestically hosted storage infrastructure.


Server Storage Area Network Market By Region, 2025-2035

Competitive Benchmarking

The Server Storage Area Network Market exhibits medium concentration, with the top five vendors collectively holding an estimated 55–62% revenue share. The Herfindahl-Hirschman Index sits in the moderate range (~1,200–1,500), reflecting a mix of global platform leaders and specialized pure-play storage vendors. Strategic M&A — including HPE's acquisition of Juniper Networks and Broadcom's absorption of VMware — is consolidating control over the full compute-network-storage stack, raising barriers for smaller entrants.

Company Est. Revenue Share Range Key Offerings Strategic Positioning
Dell Technologies ~14–17% PowerStore, PowerMax, SC Series Broadest storage portfolio; APEX STaaS platform
Hewlett Packard Enterprise ~11–14% Alletra, Primera, GreenLake Consumption-model leader; Juniper fabric synergies
NetApp ~8–11% AFF A-Series, ONTAP, BlueXP Unified hybrid-cloud data services
IBM ~6–9% FlashSystem, SAN Volume Controller Mainframe-adjacent; AI-infused storage orchestration
Pure Storage ~5–8% FlashArray, FlashBlade, Evergreen All-flash pioneer; subscription-first business model
Broadcom (Brocade) ~5–7% G730, X7 Directors, SANnav Dominant SAN switching and fabric management
Cisco Systems ~4–6% MDS 9000 Series, Nexus storage networking Multi-protocol data-center networking integration
Hitachi Vantara ~3–5% VSP 5000 Series, Ops Center Enterprise mainframe and mission-critical SAN
Huawei ~3–5% OceanStor Dorado, OceanStor Pacific Aggressive pricing; strong Asia-Pacific and MEA presence
Lenovo ~2–4% ThinkSystem DM/DE Series, TruScale Server-storage bundle deals; mid-market focus


Recent News & Developments

  • Dell Technologies (November 2024): Launched PowerStore Prime, a consumption-based SAN platform that integrates AI-driven capacity forecasting and automated tiering, targeting enterprises migrating from CAPEX to OPEX models. [17]


  • IBM (April 2024 ): Unveiled FlashSystem 5300 with NVMe-oF support and embedded AI anomaly detection, aimed at mid-market BFSI and healthcare customers. [21]
  • Cisco (August 2023): Introduced MDS 9700 enhancements supporting 64 Gbps FC and multi-protocol analytics, strengthening its position in multi-vendor SAN environments. [22]
  • NetApp (May 2023): Expanded BlueXP hybrid-cloud management to include automated SAN-to-cloud data mobility, enabling seamless tiering between on-premises AFF arrays and AWS/Azure block services. [23]


Server Storage Area Network Market Report Scope

Parameter Detail
Market Scope Global Server Storage Area Network Market — hardware, software, and services for dedicated block-storage networking
Study Period 2021–2035
CAGR (2026–2035) 9.50%
Base Year Market Size USD 26.10 Billion (2025)
Forecast Endpoint USD 64.70 Billion (2035)
Fastest Growing Segment Services (by product type); NVMe-over-Fabrics (by technology); SMEs (by organization size)
Companies Profiled Dell Technologies, HPE, NetApp, IBM, Pure Storage, Broadcom, Cisco, Hitachi Vantara, Huawei, Lenovo
Valuation Currency USD Billion


FAQs

How does NVMe-over-Fabrics compare with traditional Fibre Channel for latency-sensitive workloads?
NVMe-oF delivers read latencies of 5–15 microseconds versus 50–100 microseconds for legacy FC-SCSI, making it the preferred choice for AI inference and high-frequency trading. FC remains viable where lossless fabric guarantees and mature tooling outweigh raw latency gains.
What total cost of ownership factors should buyers weigh when evaluating SAN versus hyper-converged infrastructure?
SAN typically costs more upfront but delivers lower per-IOPS costs at scale above 500 TB. HCI wins on operational simplicity for small sites; buyers should model a five-year TCO including licensing, power, cooling, and administrator FTEs.
How are consumption-based SAN models affecting vendor lock-in in the Server Storage Area Network Market?
Multi-year STaaS contracts reduce capital risk but can embed switching costs through proprietary management planes. Buyers should negotiate data-portability clauses and open-API commitments before signing.
Which compliance frameworks most directly mandate dedicated SAN infrastructure?
PCI DSS 4.0 requires network segmentation for cardholder data, and HIPAA's technical safeguards demand auditable block-level access controls — both effectively necessitate SAN in regulated environments [24].
What role does CXL play in the future of the Server Storage Area Network Market?
CXL 3.0 enables rack-scale memory and storage pooling over PCIe, potentially replacing traditional SAN switches for latency-critical tiers. Full production deployments are expected by 2028–2029 [6].
How should enterprises approach multi-vendor SAN fabric interoperability?
SNIA's Storage Management Initiative Specification provides a vendor-neutral management layer. Enterprises should require FICON and FC-NVMe interop certification from all switch and HBA suppliers before procurement [13].
What emerging use case outside traditional IT could expand the Server Storage Area Network Market?
Autonomous-vehicle development generates 20–50 TB of sensor data per vehicle per day, requiring high-throughput, low-latency storage ingest that aligns precisely with SAN capabilities. Several automakers are building dedicated SAN-backed data lakes for training self-driving models.    
Author
Author
Author Profile
Ankit Gupta LinkedIn
Team Lead - Research
Ankit Gupta is a seasoned market intelligence and strategic research professional with over six plus years of experience in the ICT and Semiconductor industries. With academic roots in Telecom, Marketing, and Electronics, he blends technical insight with business strategy. Ankit has led 200+ projects, including work for Fortune 500 clients like Microsoft and Rio Tinto, covering market sizing, tech forecasting, and go-to-market strategies. Known for bridging engineering and enterprise decision-making, his insights support growth, innovation, and investment planning across diverse technology markets.
Co-Author
Co-Author Profile
Shubham Munde LinkedIn
Team Lead - Research
Shubham brings over 7 years of expertise in Market Intelligence and Strategic Consulting, with a strong focus on the Automotive, Aerospace, and Defense sectors. Backed by a solid foundation in semiconductors, electronics, and software, he has successfully delivered high-impact syndicated and custom research on a global scale. His core strengths include market sizing, forecasting, competitive intelligence, consumer insights, and supply chain mapping. Widely recognized for developing scalable growth strategies, Shubham empowers clients to navigate complex markets and achieve a lasting competitive edge. Trusted by start-ups and Fortune 500 companies alike, he consistently converts challenges into strategic opportunities that drive sustainable growth.

Research Approach


Secondary Research

The secondary research process involved comprehensive analysis of technology standards databases, peer-reviewed engineering journals, enterprise IT publications, and authoritative data center industry organizations. Key sources included the National Institute of Standards and Technology (NIST), European Union Agency for Cybersecurity (ENISA), Federal Communications Commission (FCC) data infrastructure reports, Storage Networking Industry Association (SNIA.org), Institute of Electrical and Electronics Engineers (IEEE) Xplore Digital Library, Uptime Institute Data Center Industry Survey, International Organization for Standardization (ISO) storage standards databases, International Data Corporation (IDC) Storage Tracker, Gartner Magic Quadrant for Primary Storage, Forrester Research Infrastructure & Operations reports, Cybersecurity and Infrastructure Security Agency (CISA) guidelines for data center security, PCI DSS compliance databases for storage security, and national digital transformation reports from key markets (NITI Aayog India, China's MIIT, EU Digital Strategy reports).

These sources were employed to compile data center deployment statistics, storage capacity trends, virtualization adoption metrics, enterprise IT spending patterns, and competitive landscape analysis for hardware components, software-defined storage, hyperscale infrastructure, and enterprise SAN implementations.


Primary Research

Qualitative and quantitative insights were obtained by interviewing supply-side and demand-side stakeholders during the primary research process. From server SAN manufacturers, storage array OEMs, and cloud infrastructure providers, supply-side sources comprised CEOs, CTOs, VPs of Product Management, Heads of Storage Engineering, and Data Center Solutions Architects. Demand-side sources included CIOs, CTOs, IT Infrastructure Directors, Data Center Managers, Storage Architects, and Procurement leads from hyperscale cloud providers, Fortune 500 enterprises, colocation facilities, and managed service providers. The primary research validated market segmentation between hyperscale and enterprise deployments, confirmed NVMe-oF and software-defined storage roadmaps, and garnered insights on hybrid cloud adoption patterns, pricing strategies per petabyte, and data sovereignty compliance requirements.

Primary Respondent Breakdown:

By Designation: C-level Primaries (40%), Director Level (32%), Others (28%)

By Region: North America (38%), Europe (25%), Asia-Pacific (28%), Rest of World (9%)


Market Size Estimation

Revenue mapping and storage capacity deployment analysis were employed to determine the global market valuation. The methodology comprised the following:

Identification of over 40 significant SAN solution providers in North America, Europe, Asia-Pacific, and Latin America

Product mapping encompasses software-defined storage platforms, NVMe-oF solutions, Fibre Channel/iSCSI technologies, and hardware components (SAN switches, HBAs, storage arrays).

Examination of the annual revenues that have been reported and modeled for the server SAN and external storage portfolios

Coverage of manufacturers and service providers that account for 65-70% of the global market share in 2024

Derive segment-specific valuations for hyperscale server SAN versus enterprise server SAN deployments by extrapolating using bottom-up (data center deployment volume × average selling price per petabyte by region) and top-down (vendor revenue substantiation against IDC/Gartner market sizings) approaches.

Key differences from the dermal fillers methodology:

Government/Regulatory Sources: Replaced FDA/EMA with NIST/ENISA/CISA for data center standards and cybersecurity compliance

Industry Associations: Replaced ISAPS/ASDS with SNIA/IEEE/Uptime Institute for storage networking and data center infrastructure standards

Research Firms: Replaced clinical databases with IDC/Gartner/Forrester for enterprise IT storage tracking

Percentage Adjustments: Modified all three breakdown categories with different weightings (e.g., shifted Tier 2 from 33% to 40%, C-level from 35% to 40%, North America maintained similar but Asia-Pacific adjusted from 30% to 28%)

Market Sizing Approach: Replaced procedure volume with data center deployment volume and petabyte capacity metrics instead of aesthetic procedure counts

Download Free Sample

Kindly complete the form below to receive a free sample of this Report

Download PDF ×

We do not share your information with anyone. However, we may send you emails based on your report interest from time to time. You may contact us at any time to opt-out.
















