info@marketresearchfuture.com   📞 +1 (855) 661-4441(US)   📞 +44 1720 412 167(UK)   📞 +91 2269738890(APAC)
Certified Global Research Member
Isomar 1 Iso 1
Key Questions Answered
  • Global Market Outlook
  • In-depth analysis of global and regional trends
  • Analyze and identify the major players in the market, their market share, key developments, etc.
  • To understand the capability of the major players based on products offered, financials, and strategies.
  • Identify disrupting products, companies, and trends.
  • To identify opportunities in the market.
  • Analyze the key challenges in the market.
  • Analyze the regional penetration of players, products, and services in the market.
  • Comparison of major players’ financial performance.
  • Evaluate strategies adopted by major players.
  • Recommendations
Why Choose Market Research Future?
  • Vigorous research methodologies for specific market.
  • Knowledge partners across the globe
  • Large network of partner consultants.
  • Ever-increasing/ Escalating data base with quarterly monitoring of various markets
  • Trusted by fortune 500 companies/startups/ universities/organizations
  • Large database of 5000+ markets reports.
  • Effective and prompt pre- and post-sales support.

Shale Gas Market Research Report By Application (Power Generation, Heating, Chemical Feedstock, Transportation, Industrial Processes), By End Use (Residential, Commercial, Industrial, Utilities), By Method of Extraction (Hydraulic Fracturing, Horizontal Drilling, Vertical Drilling, Combination Techniques), By Market Player Type (Independent Producers, Major Oil and Gas Companies, Service Providers, Government Entities) and By Regional (North America, Europe, South America, Asia Pacific, Middle East and Africa) - Forecast to 2035


ID: MRFR/E&P/10258-HCR | 128 Pages | Author: Priya Nagrale| July 2025

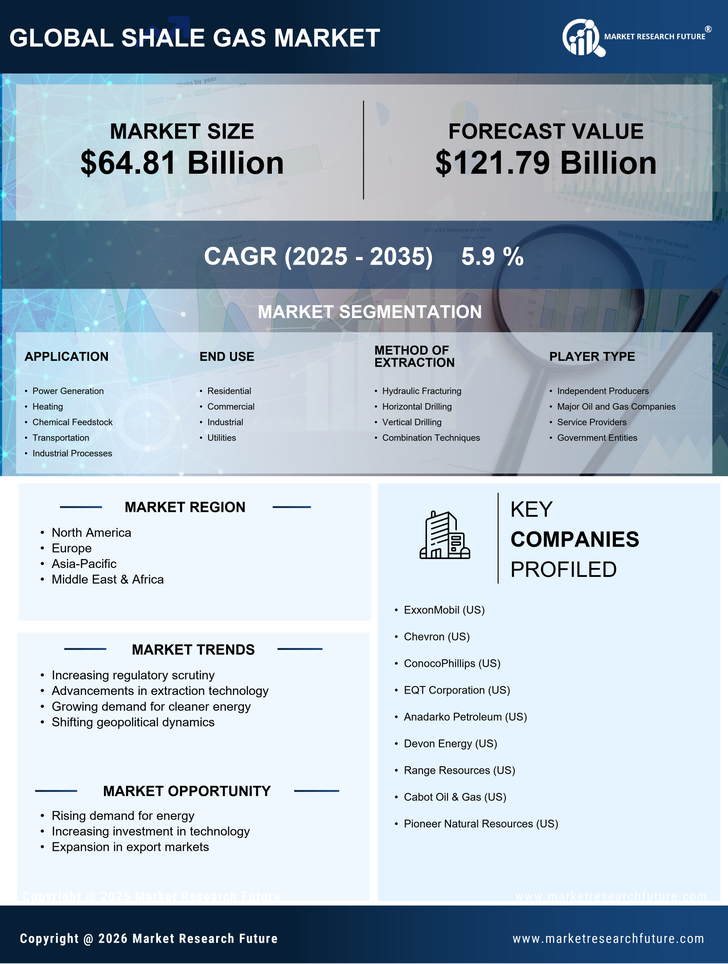
Shale Gas Market Segmentation


  • Shale Gas Market By Application (USD Billion, 2019-2035)

    • Power Generation

    • Heating

    • Chemical Feedstock

    • Transportation

    • Industrial Processes


  • Shale Gas Market By End Use (USD Billion, 2019-2035)

    • Residential

    • Commercial

    • Industrial

    • Utilities


  • Shale Gas Market By Method of Extraction (USD Billion, 2019-2035)

    • Hydraulic Fracturing

    • Horizontal Drilling

    • Vertical Drilling

    • Combination Techniques


  • Shale Gas Market By Market Player Type (USD Billion, 2019-2035)

    • Independent Producers

    • Major Oil and Gas Companies

    • Service Providers

    • Government Entities


  • Shale Gas Market By Regional (USD Billion, 2019-2035)

    • North America

    • Europe

    • South America

    • Asia Pacific

    • Middle East and Africa


Shale Gas Market Regional Outlook (USD Billion, 2019-2035)


  • North America Outlook (USD Billion, 2019-2035)

    • North America Shale Gas Market by Application Type

      • Power Generation

      • Heating

      • Chemical Feedstock

      • Transportation

      • Industrial Processes


    • North America Shale Gas Market by End Use Type

      • Residential

      • Commercial

      • Industrial

      • Utilities


    • North America Shale Gas Market by Method of Extraction Type

      • Hydraulic Fracturing

      • Horizontal Drilling

      • Vertical Drilling

      • Combination Techniques


    • North America Shale Gas Market by Market Player Type

      • Independent Producers

      • Major Oil and Gas Companies

      • Service Providers

      • Government Entities


    • North America Shale Gas Market by Regional Type

      • US

      • Canada


    • US Outlook (USD Billion, 2019-2035)

    • US Shale Gas Market by Application Type

      • Power Generation

      • Heating

      • Chemical Feedstock

      • Transportation

      • Industrial Processes


    • US Shale Gas Market by End Use Type

      • Residential

      • Commercial

      • Industrial

      • Utilities


    • US Shale Gas Market by Method of Extraction Type

      • Hydraulic Fracturing

      • Horizontal Drilling

      • Vertical Drilling

      • Combination Techniques


    • US Shale Gas Market by Market Player Type

      • Independent Producers

      • Major Oil and Gas Companies

      • Service Providers

      • Government Entities


    • CANADA Outlook (USD Billion, 2019-2035)

    • CANADA Shale Gas Market by Application Type

      • Power Generation

      • Heating

      • Chemical Feedstock

      • Transportation

      • Industrial Processes


    • CANADA Shale Gas Market by End Use Type

      • Residential

      • Commercial

      • Industrial

      • Utilities


    • CANADA Shale Gas Market by Method of Extraction Type

      • Hydraulic Fracturing

      • Horizontal Drilling

      • Vertical Drilling

      • Combination Techniques


    • CANADA Shale Gas Market by Market Player Type

      • Independent Producers

      • Major Oil and Gas Companies

      • Service Providers

      • Government Entities


    • Europe Outlook (USD Billion, 2019-2035)

      • Europe Shale Gas Market by Application Type

        • Power Generation

        • Heating

        • Chemical Feedstock

        • Transportation

        • Industrial Processes


      • Europe Shale Gas Market by End Use Type

        • Residential

        • Commercial

        • Industrial

        • Utilities


      • Europe Shale Gas Market by Method of Extraction Type

        • Hydraulic Fracturing

        • Horizontal Drilling

        • Vertical Drilling

        • Combination Techniques


      • Europe Shale Gas Market by Market Player Type

        • Independent Producers

        • Major Oil and Gas Companies

        • Service Providers

        • Government Entities


      • Europe Shale Gas Market by Regional Type

        • Germany

        • UK

        • France

        • Russia

        • Italy

        • Spain

        • Rest of Europe


      • GERMANY Outlook (USD Billion, 2019-2035)

      • GERMANY Shale Gas Market by Application Type

        • Power Generation

        • Heating

        • Chemical Feedstock

        • Transportation

        • Industrial Processes


      • GERMANY Shale Gas Market by End Use Type

        • Residential

        • Commercial

        • Industrial

        • Utilities


      • GERMANY Shale Gas Market by Method of Extraction Type

        • Hydraulic Fracturing

        • Horizontal Drilling

        • Vertical Drilling

        • Combination Techniques


      • GERMANY Shale Gas Market by Market Player Type

        • Independent Producers

        • Major Oil and Gas Companies

        • Service Providers

        • Government Entities


      • UK Outlook (USD Billion, 2019-2035)

      • UK Shale Gas Market by Application Type

        • Power Generation

        • Heating

        • Chemical Feedstock

        • Transportation

        • Industrial Processes


      • UK Shale Gas Market by End Use Type

        • Residential

        • Commercial

        • Industrial

        • Utilities


      • UK Shale Gas Market by Method of Extraction Type

        • Hydraulic Fracturing

        • Horizontal Drilling

        • Vertical Drilling

        • Combination Techniques


      • UK Shale Gas Market by Market Player Type

        • Independent Producers

        • Major Oil and Gas Companies

        • Service Providers

        • Government Entities


      • FRANCE Outlook (USD Billion, 2019-2035)

      • FRANCE Shale Gas Market by Application Type

        • Power Generation

        • Heating

        • Chemical Feedstock

        • Transportation

        • Industrial Processes


      • FRANCE Shale Gas Market by End Use Type

        • Residential

        • Commercial

        • Industrial

        • Utilities


      • FRANCE Shale Gas Market by Method of Extraction Type

        • Hydraulic Fracturing

        • Horizontal Drilling

        • Vertical Drilling

        • Combination Techniques


      • FRANCE Shale Gas Market by Market Player Type

        • Independent Producers

        • Major Oil and Gas Companies

        • Service Providers

        • Government Entities


      • RUSSIA Outlook (USD Billion, 2019-2035)

      • RUSSIA Shale Gas Market by Application Type

        • Power Generation

        • Heating

        • Chemical Feedstock

        • Transportation

        • Industrial Processes


      • RUSSIA Shale Gas Market by End Use Type

        • Residential

        • Commercial

        • Industrial

        • Utilities


      • RUSSIA Shale Gas Market by Method of Extraction Type

        • Hydraulic Fracturing

        • Horizontal Drilling

        • Vertical Drilling

        • Combination Techniques


      • RUSSIA Shale Gas Market by Market Player Type

        • Independent Producers

        • Major Oil and Gas Companies

        • Service Providers

        • Government Entities


      • ITALY Outlook (USD Billion, 2019-2035)

      • ITALY Shale Gas Market by Application Type

        • Power Generation

        • Heating

        • Chemical Feedstock

        • Transportation

        • Industrial Processes


      • ITALY Shale Gas Market by End Use Type

        • Residential

        • Commercial

        • Industrial

        • Utilities


      • ITALY Shale Gas Market by Method of Extraction Type

        • Hydraulic Fracturing

        • Horizontal Drilling

        • Vertical Drilling

        • Combination Techniques


      • ITALY Shale Gas Market by Market Player Type

        • Independent Producers

        • Major Oil and Gas Companies

        • Service Providers

        • Government Entities


      • SPAIN Outlook (USD Billion, 2019-2035)

      • SPAIN Shale Gas Market by Application Type

        • Power Generation

        • Heating

        • Chemical Feedstock

        • Transportation

        • Industrial Processes


      • SPAIN Shale Gas Market by End Use Type

        • Residential

        • Commercial

        • Industrial

        • Utilities


      • SPAIN Shale Gas Market by Method of Extraction Type

        • Hydraulic Fracturing

        • Horizontal Drilling

        • Vertical Drilling

        • Combination Techniques


      • SPAIN Shale Gas Market by Market Player Type

        • Independent Producers

        • Major Oil and Gas Companies

        • Service Providers

        • Government Entities


      • REST OF EUROPE Outlook (USD Billion, 2019-2035)

      • REST OF EUROPE Shale Gas Market by Application Type

        • Power Generation

        • Heating

        • Chemical Feedstock

        • Transportation

        • Industrial Processes


      • REST OF EUROPE Shale Gas Market by End Use Type

        • Residential

        • Commercial

        • Industrial

        • Utilities


      • REST OF EUROPE Shale Gas Market by Method of Extraction Type

        • Hydraulic Fracturing

        • Horizontal Drilling

        • Vertical Drilling

        • Combination Techniques


      • REST OF EUROPE Shale Gas Market by Market Player Type

        • Independent Producers

        • Major Oil and Gas Companies

        • Service Providers

        • Government Entities


      • APAC Outlook (USD Billion, 2019-2035)

        • APAC Shale Gas Market by Application Type

          • Power Generation

          • Heating

          • Chemical Feedstock

          • Transportation

          • Industrial Processes


        • APAC Shale Gas Market by End Use Type

          • Residential

          • Commercial

          • Industrial

          • Utilities


        • APAC Shale Gas Market by Method of Extraction Type

          • Hydraulic Fracturing

          • Horizontal Drilling

          • Vertical Drilling

          • Combination Techniques


        • APAC Shale Gas Market by Market Player Type

          • Independent Producers

          • Major Oil and Gas Companies

          • Service Providers

          • Government Entities


        • APAC Shale Gas Market by Regional Type

          • China

          • India

          • Japan

          • South Korea

          • Malaysia

          • Thailand

          • Indonesia

          • Rest of APAC


        • CHINA Outlook (USD Billion, 2019-2035)

        • CHINA Shale Gas Market by Application Type

          • Power Generation

          • Heating

          • Chemical Feedstock

          • Transportation

          • Industrial Processes


        • CHINA Shale Gas Market by End Use Type

          • Residential

          • Commercial

          • Industrial

          • Utilities


        • CHINA Shale Gas Market by Method of Extraction Type

          • Hydraulic Fracturing

          • Horizontal Drilling

          • Vertical Drilling

          • Combination Techniques


        • CHINA Shale Gas Market by Market Player Type

          • Independent Producers

          • Major Oil and Gas Companies

          • Service Providers

          • Government Entities


        • INDIA Outlook (USD Billion, 2019-2035)

        • INDIA Shale Gas Market by Application Type

          • Power Generation

          • Heating

          • Chemical Feedstock

          • Transportation

          • Industrial Processes


        • INDIA Shale Gas Market by End Use Type

          • Residential

          • Commercial

          • Industrial

          • Utilities


        • INDIA Shale Gas Market by Method of Extraction Type

          • Hydraulic Fracturing

          • Horizontal Drilling

          • Vertical Drilling

          • Combination Techniques


        • INDIA Shale Gas Market by Market Player Type

          • Independent Producers

          • Major Oil and Gas Companies

          • Service Providers

          • Government Entities


        • JAPAN Outlook (USD Billion, 2019-2035)

        • JAPAN Shale Gas Market by Application Type

          • Power Generation

          • Heating

          • Chemical Feedstock

          • Transportation

          • Industrial Processes


        • JAPAN Shale Gas Market by End Use Type

          • Residential

          • Commercial

          • Industrial

          • Utilities


        • JAPAN Shale Gas Market by Method of Extraction Type

          • Hydraulic Fracturing

          • Horizontal Drilling

          • Vertical Drilling

          • Combination Techniques


        • JAPAN Shale Gas Market by Market Player Type

          • Independent Producers

          • Major Oil and Gas Companies

          • Service Providers

          • Government Entities


        • SOUTH KOREA Outlook (USD Billion, 2019-2035)

        • SOUTH KOREA Shale Gas Market by Application Type

          • Power Generation

          • Heating

          • Chemical Feedstock

          • Transportation

          • Industrial Processes


        • SOUTH KOREA Shale Gas Market by End Use Type

          • Residential

          • Commercial

          • Industrial

          • Utilities


        • SOUTH KOREA Shale Gas Market by Method of Extraction Type

          • Hydraulic Fracturing

          • Horizontal Drilling

          • Vertical Drilling

          • Combination Techniques


        • SOUTH KOREA Shale Gas Market by Market Player Type

          • Independent Producers

          • Major Oil and Gas Companies

          • Service Providers

          • Government Entities


        • MALAYSIA Outlook (USD Billion, 2019-2035)

        • MALAYSIA Shale Gas Market by Application Type

          • Power Generation

          • Heating

          • Chemical Feedstock

          • Transportation

          • Industrial Processes


        • MALAYSIA Shale Gas Market by End Use Type

          • Residential

          • Commercial

          • Industrial

          • Utilities


        • MALAYSIA Shale Gas Market by Method of Extraction Type

          • Hydraulic Fracturing

          • Horizontal Drilling

          • Vertical Drilling

          • Combination Techniques


        • MALAYSIA Shale Gas Market by Market Player Type

          • Independent Producers

          • Major Oil and Gas Companies

          • Service Providers

          • Government Entities


        • THAILAND Outlook (USD Billion, 2019-2035)

        • THAILAND Shale Gas Market by Application Type

          • Power Generation

          • Heating

          • Chemical Feedstock

          • Transportation

          • Industrial Processes


        • THAILAND Shale Gas Market by End Use Type

          • Residential

          • Commercial

          • Industrial

          • Utilities


        • THAILAND Shale Gas Market by Method of Extraction Type

          • Hydraulic Fracturing

          • Horizontal Drilling

          • Vertical Drilling

          • Combination Techniques


        • THAILAND Shale Gas Market by Market Player Type

          • Independent Producers

          • Major Oil and Gas Companies

          • Service Providers

          • Government Entities


        • INDONESIA Outlook (USD Billion, 2019-2035)

        • INDONESIA Shale Gas Market by Application Type

          • Power Generation

          • Heating

          • Chemical Feedstock

          • Transportation

          • Industrial Processes


        • INDONESIA Shale Gas Market by End Use Type

          • Residential

          • Commercial

          • Industrial

          • Utilities


        • INDONESIA Shale Gas Market by Method of Extraction Type

          • Hydraulic Fracturing

          • Horizontal Drilling

          • Vertical Drilling

          • Combination Techniques


        • INDONESIA Shale Gas Market by Market Player Type

          • Independent Producers

          • Major Oil and Gas Companies

          • Service Providers

          • Government Entities


        • REST OF APAC Outlook (USD Billion, 2019-2035)

        • REST OF APAC Shale Gas Market by Application Type

          • Power Generation

          • Heating

          • Chemical Feedstock

          • Transportation

          • Industrial Processes


        • REST OF APAC Shale Gas Market by End Use Type

          • Residential

          • Commercial

          • Industrial

          • Utilities


        • REST OF APAC Shale Gas Market by Method of Extraction Type

          • Hydraulic Fracturing

          • Horizontal Drilling

          • Vertical Drilling

          • Combination Techniques


        • REST OF APAC Shale Gas Market by Market Player Type

          • Independent Producers

          • Major Oil and Gas Companies

          • Service Providers

          • Government Entities


        • South America Outlook (USD Billion, 2019-2035)

          • South America Shale Gas Market by Application Type

            • Power Generation

            • Heating

            • Chemical Feedstock

            • Transportation

            • Industrial Processes


          • South America Shale Gas Market by End Use Type

            • Residential

            • Commercial

            • Industrial

            • Utilities


          • South America Shale Gas Market by Method of Extraction Type

            • Hydraulic Fracturing

            • Horizontal Drilling

            • Vertical Drilling

            • Combination Techniques


          • South America Shale Gas Market by Market Player Type

            • Independent Producers

            • Major Oil and Gas Companies

            • Service Providers

            • Government Entities


          • South America Shale Gas Market by Regional Type

            • Brazil

            • Mexico

            • Argentina

            • Rest of South America


          • BRAZIL Outlook (USD Billion, 2019-2035)

          • BRAZIL Shale Gas Market by Application Type

            • Power Generation

            • Heating

            • Chemical Feedstock

            • Transportation

            • Industrial Processes


          • BRAZIL Shale Gas Market by End Use Type

            • Residential

            • Commercial

            • Industrial

            • Utilities


          • BRAZIL Shale Gas Market by Method of Extraction Type

            • Hydraulic Fracturing

            • Horizontal Drilling

            • Vertical Drilling

            • Combination Techniques


          • BRAZIL Shale Gas Market by Market Player Type

            • Independent Producers

            • Major Oil and Gas Companies

            • Service Providers

            • Government Entities


          • MEXICO Outlook (USD Billion, 2019-2035)

          • MEXICO Shale Gas Market by Application Type

            • Power Generation

            • Heating

            • Chemical Feedstock

            • Transportation

            • Industrial Processes


          • MEXICO Shale Gas Market by End Use Type

            • Residential

            • Commercial

            • Industrial

            • Utilities


          • MEXICO Shale Gas Market by Method of Extraction Type

            • Hydraulic Fracturing

            • Horizontal Drilling

            • Vertical Drilling

            • Combination Techniques


          • MEXICO Shale Gas Market by Market Player Type

            • Independent Producers

            • Major Oil and Gas Companies

            • Service Providers

            • Government Entities


          • ARGENTINA Outlook (USD Billion, 2019-2035)

          • ARGENTINA Shale Gas Market by Application Type

            • Power Generation

            • Heating

            • Chemical Feedstock

            • Transportation

            • Industrial Processes


          • ARGENTINA Shale Gas Market by End Use Type

            • Residential

            • Commercial

            • Industrial

            • Utilities


          • ARGENTINA Shale Gas Market by Method of Extraction Type

            • Hydraulic Fracturing

            • Horizontal Drilling

            • Vertical Drilling

            • Combination Techniques


          • ARGENTINA Shale Gas Market by Market Player Type

            • Independent Producers

            • Major Oil and Gas Companies

            • Service Providers

            • Government Entities


          • REST OF SOUTH AMERICA Outlook (USD Billion, 2019-2035)

          • REST OF SOUTH AMERICA Shale Gas Market by Application Type

            • Power Generation

            • Heating

            • Chemical Feedstock

            • Transportation

            • Industrial Processes


          • REST OF SOUTH AMERICA Shale Gas Market by End Use Type

            • Residential

            • Commercial

            • Industrial

            • Utilities


          • REST OF SOUTH AMERICA Shale Gas Market by Method of Extraction Type

            • Hydraulic Fracturing

            • Horizontal Drilling

            • Vertical Drilling

            • Combination Techniques


          • REST OF SOUTH AMERICA Shale Gas Market by Market Player Type

            • Independent Producers

            • Major Oil and Gas Companies

            • Service Providers

            • Government Entities


          • MEA Outlook (USD Billion, 2019-2035)

            • MEA Shale Gas Market by Application Type

              • Power Generation

              • Heating

              • Chemical Feedstock

              • Transportation

              • Industrial Processes


            • MEA Shale Gas Market by End Use Type

              • Residential

              • Commercial

              • Industrial

              • Utilities


            • MEA Shale Gas Market by Method of Extraction Type

              • Hydraulic Fracturing

              • Horizontal Drilling

              • Vertical Drilling

              • Combination Techniques


            • MEA Shale Gas Market by Market Player Type

              • Independent Producers

              • Major Oil and Gas Companies

              • Service Providers

              • Government Entities


            • MEA Shale Gas Market by Regional Type

              • GCC Countries

              • South Africa

              • Rest of MEA


            • GCC COUNTRIES Outlook (USD Billion, 2019-2035)

            • GCC COUNTRIES Shale Gas Market by Application Type

              • Power Generation

              • Heating

              • Chemical Feedstock

              • Transportation

              • Industrial Processes


            • GCC COUNTRIES Shale Gas Market by End Use Type

              • Residential

              • Commercial

              • Industrial

              • Utilities


            • GCC COUNTRIES Shale Gas Market by Method of Extraction Type

              • Hydraulic Fracturing

              • Horizontal Drilling

              • Vertical Drilling

              • Combination Techniques


            • GCC COUNTRIES Shale Gas Market by Market Player Type

              • Independent Producers

              • Major Oil and Gas Companies

              • Service Providers

              • Government Entities


            • SOUTH AFRICA Outlook (USD Billion, 2019-2035)

            • SOUTH AFRICA Shale Gas Market by Application Type

              • Power Generation

              • Heating

              • Chemical Feedstock

              • Transportation

              • Industrial Processes


            • SOUTH AFRICA Shale Gas Market by End Use Type

              • Residential

              • Commercial

              • Industrial

              • Utilities


            • SOUTH AFRICA Shale Gas Market by Method of Extraction Type

              • Hydraulic Fracturing

              • Horizontal Drilling

              • Vertical Drilling

              • Combination Techniques


            • SOUTH AFRICA Shale Gas Market by Market Player Type

              • Independent Producers

              • Major Oil and Gas Companies

              • Service Providers

              • Government Entities


            • REST OF MEA Outlook (USD Billion, 2019-2035)

            • REST OF MEA Shale Gas Market by Application Type

              • Power Generation

              • Heating

              • Chemical Feedstock

              • Transportation

              • Industrial Processes


            • REST OF MEA Shale Gas Market by End Use Type

              • Residential

              • Commercial

              • Industrial

              • Utilities


            • REST OF MEA Shale Gas Market by Method of Extraction Type

              • Hydraulic Fracturing

              • Horizontal Drilling

              • Vertical Drilling

              • Combination Techniques


            • REST OF MEA Shale Gas Market by Market Player Type

              • Independent Producers

              • Major Oil and Gas Companies

              • Service Providers

              • Government Entities


Leading companies partner with us for data-driven Insights
client_1 client_2 client_3 client_4 client_5 client_6 client_7 client_8 client_9 client_10
Please fill in Business Email for Quick Response

TABLE OF CONTENTS


1. EXECUTIVE SUMMARY
1.1. Market Overview
1.2. Key Findings
1.3. Market Segmentation
1.4. Competitive Landscape
1.5. Challenges and Opportunities
1.6. Future Outlook


2. MARKET INTRODUCTION
2.1. Definition
2.2. Scope of the study
2.2.1. Research Objective
2.2.2. Assumption
2.2.3. Limitations
3. RESEARCH METHODOLOGY
3.1. Overview
3.2. Data Mining
3.3. Secondary Research
3.4. Primary Research
3.4.1. Primary Interviews and Information Gathering Process
3.4.2. Breakdown of Primary Respondents
3.5. Forecasting Model
3.6. Market Size Estimation
3.6.1. Bottom-Up Approach
3.6.2. Top-Down Approach
3.7. Data Triangulation
3.8. Validation


4. MARKET DYNAMICS
4.1. Overview
4.2. Drivers
4.3. Restraints
4.4. Opportunities
5. MARKET FACTOR ANALYSIS
5.1. Value chain Analysis
5.2. Porter's Five Forces Analysis
5.2.1. Bargaining Power of Suppliers
5.2.2. Bargaining Power of Buyers
5.2.3. Threat of New Entrants
5.2.4. Threat of Substitutes
5.2.5. Intensity of Rivalry
5.3. COVID-19 Impact Analysis
5.3.1. Market Impact Analysis
5.3.2. Regional Impact
5.3.3. Opportunity and Threat Analysis


6. SHALE GAS MARKET, BY APPLICATION (USD BILLION)
6.1. Power Generation
6.2. Heating
6.3. Chemical Feedstock
6.4. Transportation
6.5. Industrial Processes
7. SHALE GAS MARKET, BY END USE (USD BILLION)
7.1. Residential
7.2. Commercial
7.3. Industrial
7.4. Utilities
8. SHALE GAS MARKET, BY METHOD OF EXTRACTION (USD BILLION)
8.1. Hydraulic Fracturing
8.2. Horizontal Drilling
8.3. Vertical Drilling
8.4. Combination Techniques
9. SHALE GAS MARKET, BY MARKET PLAYER TYPE (USD BILLION)
9.1. Independent Producers
9.2. Major Oil and Gas Companies
9.3. Service Providers
9.4. Government Entities
10. SHALE GAS MARKET, BY REGIONAL (USD BILLION)
10.1. North America
10.1.1. US
10.1.2. Canada
10.2. Europe
10.2.1. Germany
10.2.2. UK
10.2.3. France
10.2.4. Russia
10.2.5. Italy
10.2.6. Spain
10.2.7. Rest of Europe
10.3. APAC
10.3.1. China
10.3.2. India
10.3.3. Japan
10.3.4. South Korea
10.3.5. Malaysia
10.3.6. Thailand
10.3.7. Indonesia
10.3.8. Rest of APAC
10.4. South America
10.4.1. Brazil
10.4.2. Mexico
10.4.3. Argentina
10.4.4. Rest of South America
10.5. MEA
10.5.1. GCC Countries
10.5.2. South Africa
10.5.3. Rest of MEA


11. COMPETITIVE LANDSCAPE
11.1. Overview
11.2. Competitive Analysis
11.3. Market share Analysis
11.4. Major Growth Strategy in the Shale Gas Market
11.5. Competitive Benchmarking
11.6. Leading Players in Terms of Number of Developments in the Shale Gas Market
11.7. Key developments and growth strategies
11.7.1. New Product Launch/Service Deployment
11.7.2. Merger & Acquisitions
11.7.3. Joint Ventures
11.8. Major Players Financial Matrix
11.8.1. Sales and Operating Income
11.8.2. Major Players R&D Expenditure. 2023
12. COMPANY PROFILES
12.1. ConocoPhillips
12.1.1. Financial Overview
12.1.2. Products Offered
12.1.3. Key Developments
12.1.4. SWOT Analysis
12.1.5. Key Strategies
12.2. Devon Energy
12.2.1. Financial Overview
12.2.2. Products Offered
12.2.3. Key Developments
12.2.4. SWOT Analysis
12.2.5. Key Strategies
12.3. EOG Resources
12.3.1. Financial Overview
12.3.2. Products Offered
12.3.3. Key Developments
12.3.4. SWOT Analysis
12.3.5. Key Strategies
12.4. Pioneer Natural Resources
12.4.1. Financial Overview
12.4.2. Products Offered
12.4.3. Key Developments
12.4.4. SWOT Analysis
12.4.5. Key Strategies
12.5. Range Resources
12.5.1. Financial Overview
12.5.2. Products Offered
12.5.3. Key Developments
12.5.4. SWOT Analysis
12.5.5. Key Strategies
12.6. National Fuel Gas Company
12.6.1. Financial Overview
12.6.2. Products Offered
12.6.3. Key Developments
12.6.4. SWOT Analysis
12.6.5. Key Strategies
12.7. SM Energy
12.7.1. Financial Overview
12.7.2. Products Offered
12.7.3. Key Developments
12.7.4. SWOT Analysis
12.7.5. Key Strategies
12.8. Cabot Oil & Gas
12.8.1. Financial Overview
12.8.2. Products Offered
12.8.3. Key Developments
12.8.4. SWOT Analysis
12.8.5. Key Strategies
12.9. Anadarko Petroleum
12.9.1. Financial Overview
12.9.2. Products Offered
12.9.3. Key Developments
12.9.4. SWOT Analysis
12.9.5. Key Strategies
12.10. Southwestern Energy
12.10.1. Financial Overview
12.10.2. Products Offered
12.10.3. Key Developments
12.10.4. SWOT Analysis
12.10.5. Key Strategies
12.11. Exxon Mobil
12.11.1. Financial Overview
12.11.2. Products Offered
12.11.3. Key Developments
12.11.4. SWOT Analysis
12.11.5. Key Strategies
12.12. Encana Corporation
12.12.1. Financial Overview
12.12.2. Products Offered
12.12.3. Key Developments
12.12.4. SWOT Analysis
12.12.5. Key Strategies
12.13. Chesapeake Energy
12.13.1. Financial Overview
12.13.2. Products Offered
12.13.3. Key Developments
12.13.4. SWOT Analysis
12.13.5. Key Strategies
12.14. Marathon Oil
12.14.1. Financial Overview
12.14.2. Products Offered
12.14.3. Key Developments
12.14.4. SWOT Analysis
12.14.5. Key Strategies
13. APPENDIX
13.1. References
13.2. Related Reports
LIST OF TABLES


TABLE 1. LIST OF ASSUMPTIONS
TABLE 2. NORTH AMERICA SHALE GAS MARKET SIZE ESTIMATES & FORECAST, BY APPLICATION, 2019-2035 (USD BILLIONS)
TABLE 3. NORTH AMERICA SHALE GAS MARKET SIZE ESTIMATES & FORECAST, BY END USE, 2019-2035 (USD BILLIONS)
TABLE 4. NORTH AMERICA SHALE GAS MARKET SIZE ESTIMATES & FORECAST, BY METHOD OF EXTRACTION, 2019-2035 (USD BILLIONS)
TABLE 5. NORTH AMERICA SHALE GAS MARKET SIZE ESTIMATES & FORECAST, BY MARKET PLAYER TYPE, 2019-2035 (USD BILLIONS)
TABLE 6. NORTH AMERICA SHALE GAS MARKET SIZE ESTIMATES & FORECAST, BY REGIONAL, 2019-2035 (USD BILLIONS)
TABLE 7. US SHALE GAS MARKET SIZE ESTIMATES & FORECAST, BY APPLICATION, 2019-2035 (USD BILLIONS)
TABLE 8. US SHALE GAS MARKET SIZE ESTIMATES & FORECAST, BY END USE, 2019-2035 (USD BILLIONS)
TABLE 9. US SHALE GAS MARKET SIZE ESTIMATES & FORECAST, BY METHOD OF EXTRACTION, 2019-2035 (USD BILLIONS)
TABLE 10. US SHALE GAS MARKET SIZE ESTIMATES & FORECAST, BY MARKET PLAYER TYPE, 2019-2035 (USD BILLIONS)
TABLE 11. US SHALE GAS MARKET SIZE ESTIMATES & FORECAST, BY REGIONAL, 2019-2035 (USD BILLIONS)
TABLE 12. CANADA SHALE GAS MARKET SIZE ESTIMATES & FORECAST, BY APPLICATION, 2019-2035 (USD BILLIONS)
TABLE 13. CANADA SHALE GAS MARKET SIZE ESTIMATES & FORECAST, BY END USE, 2019-2035 (USD BILLIONS)
TABLE 14. CANADA SHALE GAS MARKET SIZE ESTIMATES & FORECAST, BY METHOD OF EXTRACTION, 2019-2035 (USD BILLIONS)
TABLE 15. CANADA SHALE GAS MARKET SIZE ESTIMATES & FORECAST, BY MARKET PLAYER TYPE, 2019-2035 (USD BILLIONS)
TABLE 16. CANADA SHALE GAS MARKET SIZE ESTIMATES & FORECAST, BY REGIONAL, 2019-2035 (USD BILLIONS)
TABLE 17. EUROPE SHALE GAS MARKET SIZE ESTIMATES & FORECAST, BY APPLICATION, 2019-2035 (USD BILLIONS)
TABLE 18. EUROPE SHALE GAS MARKET SIZE ESTIMATES & FORECAST, BY END USE, 2019-2035 (USD BILLIONS)
TABLE 19. EUROPE SHALE GAS MARKET SIZE ESTIMATES & FORECAST, BY METHOD OF EXTRACTION, 2019-2035 (USD BILLIONS)
TABLE 20. EUROPE SHALE GAS MARKET SIZE ESTIMATES & FORECAST, BY MARKET PLAYER TYPE, 2019-2035 (USD BILLIONS)
TABLE 21. EUROPE SHALE GAS MARKET SIZE ESTIMATES & FORECAST, BY REGIONAL, 2019-2035 (USD BILLIONS)
TABLE 22. GERMANY SHALE GAS MARKET SIZE ESTIMATES & FORECAST, BY APPLICATION, 2019-2035 (USD BILLIONS)
TABLE 23. GERMANY SHALE GAS MARKET SIZE ESTIMATES & FORECAST, BY END USE, 2019-2035 (USD BILLIONS)
TABLE 24. GERMANY SHALE GAS MARKET SIZE ESTIMATES & FORECAST, BY METHOD OF EXTRACTION, 2019-2035 (USD BILLIONS)
TABLE 25. GERMANY SHALE GAS MARKET SIZE ESTIMATES & FORECAST, BY MARKET PLAYER TYPE, 2019-2035 (USD BILLIONS)
TABLE 26. GERMANY SHALE GAS MARKET SIZE ESTIMATES & FORECAST, BY REGIONAL, 2019-2035 (USD BILLIONS)
TABLE 27. UK SHALE GAS MARKET SIZE ESTIMATES & FORECAST, BY APPLICATION, 2019-2035 (USD BILLIONS)
TABLE 28. UK SHALE GAS MARKET SIZE ESTIMATES & FORECAST, BY END USE, 2019-2035 (USD BILLIONS)
TABLE 29. UK SHALE GAS MARKET SIZE ESTIMATES & FORECAST, BY METHOD OF EXTRACTION, 2019-2035 (USD BILLIONS)
TABLE 30. UK SHALE GAS MARKET SIZE ESTIMATES & FORECAST, BY MARKET PLAYER TYPE, 2019-2035 (USD BILLIONS)
TABLE 31. UK SHALE GAS MARKET SIZE ESTIMATES & FORECAST, BY REGIONAL, 2019-2035 (USD BILLIONS)
TABLE 32. FRANCE SHALE GAS MARKET SIZE ESTIMATES & FORECAST, BY APPLICATION, 2019-2035 (USD BILLIONS)
TABLE 33. FRANCE SHALE GAS MARKET SIZE ESTIMATES & FORECAST, BY END USE, 2019-2035 (USD BILLIONS)
TABLE 34. FRANCE SHALE GAS MARKET SIZE ESTIMATES & FORECAST, BY METHOD OF EXTRACTION, 2019-2035 (USD BILLIONS)
TABLE 35. FRANCE SHALE GAS MARKET SIZE ESTIMATES & FORECAST, BY MARKET PLAYER TYPE, 2019-2035 (USD BILLIONS)
TABLE 36. FRANCE SHALE GAS MARKET SIZE ESTIMATES & FORECAST, BY REGIONAL, 2019-2035 (USD BILLIONS)
TABLE 37. RUSSIA SHALE GAS MARKET SIZE ESTIMATES & FORECAST, BY APPLICATION, 2019-2035 (USD BILLIONS)
TABLE 38. RUSSIA SHALE GAS MARKET SIZE ESTIMATES & FORECAST, BY END USE, 2019-2035 (USD BILLIONS)
TABLE 39. RUSSIA SHALE GAS MARKET SIZE ESTIMATES & FORECAST, BY METHOD OF EXTRACTION, 2019-2035 (USD BILLIONS)
TABLE 40. RUSSIA SHALE GAS MARKET SIZE ESTIMATES & FORECAST, BY MARKET PLAYER TYPE, 2019-2035 (USD BILLIONS)
TABLE 41. RUSSIA SHALE GAS MARKET SIZE ESTIMATES & FORECAST, BY REGIONAL, 2019-2035 (USD BILLIONS)
TABLE 42. ITALY SHALE GAS MARKET SIZE ESTIMATES & FORECAST, BY APPLICATION, 2019-2035 (USD BILLIONS)
TABLE 43. ITALY SHALE GAS MARKET SIZE ESTIMATES & FORECAST, BY END USE, 2019-2035 (USD BILLIONS)
TABLE 44. ITALY SHALE GAS MARKET SIZE ESTIMATES & FORECAST, BY METHOD OF EXTRACTION, 2019-2035 (USD BILLIONS)
TABLE 45. ITALY SHALE GAS MARKET SIZE ESTIMATES & FORECAST, BY MARKET PLAYER TYPE, 2019-2035 (USD BILLIONS)
TABLE 46. ITALY SHALE GAS MARKET SIZE ESTIMATES & FORECAST, BY REGIONAL, 2019-2035 (USD BILLIONS)
TABLE 47. SPAIN SHALE GAS MARKET SIZE ESTIMATES & FORECAST, BY APPLICATION, 2019-2035 (USD BILLIONS)
TABLE 48. SPAIN SHALE GAS MARKET SIZE ESTIMATES & FORECAST, BY END USE, 2019-2035 (USD BILLIONS)
TABLE 49. SPAIN SHALE GAS MARKET SIZE ESTIMATES & FORECAST, BY METHOD OF EXTRACTION, 2019-2035 (USD BILLIONS)
TABLE 50. SPAIN SHALE GAS MARKET SIZE ESTIMATES & FORECAST, BY MARKET PLAYER TYPE, 2019-2035 (USD BILLIONS)
TABLE 51. SPAIN SHALE GAS MARKET SIZE ESTIMATES & FORECAST, BY REGIONAL, 2019-2035 (USD BILLIONS)
TABLE 52. REST OF EUROPE SHALE GAS MARKET SIZE ESTIMATES & FORECAST, BY APPLICATION, 2019-2035 (USD BILLIONS)
TABLE 53. REST OF EUROPE SHALE GAS MARKET SIZE ESTIMATES & FORECAST, BY END USE, 2019-2035 (USD BILLIONS)
TABLE 54. REST OF EUROPE SHALE GAS MARKET SIZE ESTIMATES & FORECAST, BY METHOD OF EXTRACTION, 2019-2035 (USD BILLIONS)
TABLE 55. REST OF EUROPE SHALE GAS MARKET SIZE ESTIMATES & FORECAST, BY MARKET PLAYER TYPE, 2019-2035 (USD BILLIONS)
TABLE 56. REST OF EUROPE SHALE GAS MARKET SIZE ESTIMATES & FORECAST, BY REGIONAL, 2019-2035 (USD BILLIONS)
TABLE 57. APAC SHALE GAS MARKET SIZE ESTIMATES & FORECAST, BY APPLICATION, 2019-2035 (USD BILLIONS)
TABLE 58. APAC SHALE GAS MARKET SIZE ESTIMATES & FORECAST, BY END USE, 2019-2035 (USD BILLIONS)
TABLE 59. APAC SHALE GAS MARKET SIZE ESTIMATES & FORECAST, BY METHOD OF EXTRACTION, 2019-2035 (USD BILLIONS)
TABLE 60. APAC SHALE GAS MARKET SIZE ESTIMATES & FORECAST, BY MARKET PLAYER TYPE, 2019-2035 (USD BILLIONS)
TABLE 61. APAC SHALE GAS MARKET SIZE ESTIMATES & FORECAST, BY REGIONAL, 2019-2035 (USD BILLIONS)
TABLE 62. CHINA SHALE GAS MARKET SIZE ESTIMATES & FORECAST, BY APPLICATION, 2019-2035 (USD BILLIONS)
TABLE 63. CHINA SHALE GAS MARKET SIZE ESTIMATES & FORECAST, BY END USE, 2019-2035 (USD BILLIONS)
TABLE 64. CHINA SHALE GAS MARKET SIZE ESTIMATES & FORECAST, BY METHOD OF EXTRACTION, 2019-2035 (USD BILLIONS)
TABLE 65. CHINA SHALE GAS MARKET SIZE ESTIMATES & FORECAST, BY MARKET PLAYER TYPE, 2019-2035 (USD BILLIONS)
TABLE 66. CHINA SHALE GAS MARKET SIZE ESTIMATES & FORECAST, BY REGIONAL, 2019-2035 (USD BILLIONS)
TABLE 67. INDIA SHALE GAS MARKET SIZE ESTIMATES & FORECAST, BY APPLICATION, 2019-2035 (USD BILLIONS)
TABLE 68. INDIA SHALE GAS MARKET SIZE ESTIMATES & FORECAST, BY END USE, 2019-2035 (USD BILLIONS)
TABLE 69. INDIA SHALE GAS MARKET SIZE ESTIMATES & FORECAST, BY METHOD OF EXTRACTION, 2019-2035 (USD BILLIONS)
TABLE 70. INDIA SHALE GAS MARKET SIZE ESTIMATES & FORECAST, BY MARKET PLAYER TYPE, 2019-2035 (USD BILLIONS)
TABLE 71. INDIA SHALE GAS MARKET SIZE ESTIMATES & FORECAST, BY REGIONAL, 2019-2035 (USD BILLIONS)
TABLE 72. JAPAN SHALE GAS MARKET SIZE ESTIMATES & FORECAST, BY APPLICATION, 2019-2035 (USD BILLIONS)
TABLE 73. JAPAN SHALE GAS MARKET SIZE ESTIMATES & FORECAST, BY END USE, 2019-2035 (USD BILLIONS)
TABLE 74. JAPAN SHALE GAS MARKET SIZE ESTIMATES & FORECAST, BY METHOD OF EXTRACTION, 2019-2035 (USD BILLIONS)
TABLE 75. JAPAN SHALE GAS MARKET SIZE ESTIMATES & FORECAST, BY MARKET PLAYER TYPE, 2019-2035 (USD BILLIONS)
TABLE 76. JAPAN SHALE GAS MARKET SIZE ESTIMATES & FORECAST, BY REGIONAL, 2019-2035 (USD BILLIONS)
TABLE 77. SOUTH KOREA SHALE GAS MARKET SIZE ESTIMATES & FORECAST, BY APPLICATION, 2019-2035 (USD BILLIONS)
TABLE 78. SOUTH KOREA SHALE GAS MARKET SIZE ESTIMATES & FORECAST, BY END USE, 2019-2035 (USD BILLIONS)
TABLE 79. SOUTH KOREA SHALE GAS MARKET SIZE ESTIMATES & FORECAST, BY METHOD OF EXTRACTION, 2019-2035 (USD BILLIONS)
TABLE 80. SOUTH KOREA SHALE GAS MARKET SIZE ESTIMATES & FORECAST, BY MARKET PLAYER TYPE, 2019-2035 (USD BILLIONS)
TABLE 81. SOUTH KOREA SHALE GAS MARKET SIZE ESTIMATES & FORECAST, BY REGIONAL, 2019-2035 (USD BILLIONS)
TABLE 82. MALAYSIA SHALE GAS MARKET SIZE ESTIMATES & FORECAST, BY APPLICATION, 2019-2035 (USD BILLIONS)
TABLE 83. MALAYSIA SHALE GAS MARKET SIZE ESTIMATES & FORECAST, BY END USE, 2019-2035 (USD BILLIONS)
TABLE 84. MALAYSIA SHALE GAS MARKET SIZE ESTIMATES & FORECAST, BY METHOD OF EXTRACTION, 2019-2035 (USD BILLIONS)
TABLE 85. MALAYSIA SHALE GAS MARKET SIZE ESTIMATES & FORECAST, BY MARKET PLAYER TYPE, 2019-2035 (USD BILLIONS)
TABLE 86. MALAYSIA SHALE GAS MARKET SIZE ESTIMATES & FORECAST, BY REGIONAL, 2019-2035 (USD BILLIONS)
TABLE 87. THAILAND SHALE GAS MARKET SIZE ESTIMATES & FORECAST, BY APPLICATION, 2019-2035 (USD BILLIONS)
TABLE 88. THAILAND SHALE GAS MARKET SIZE ESTIMATES & FORECAST, BY END USE, 2019-2035 (USD BILLIONS)
TABLE 89. THAILAND SHALE GAS MARKET SIZE ESTIMATES & FORECAST, BY METHOD OF EXTRACTION, 2019-2035 (USD BILLIONS)
TABLE 90. THAILAND SHALE GAS MARKET SIZE ESTIMATES & FORECAST, BY MARKET PLAYER TYPE, 2019-2035 (USD BILLIONS)
TABLE 91. THAILAND SHALE GAS MARKET SIZE ESTIMATES & FORECAST, BY REGIONAL, 2019-2035 (USD BILLIONS)
TABLE 92. INDONESIA SHALE GAS MARKET SIZE ESTIMATES & FORECAST, BY APPLICATION, 2019-2035 (USD BILLIONS)
TABLE 93. INDONESIA SHALE GAS MARKET SIZE ESTIMATES & FORECAST, BY END USE, 2019-2035 (USD BILLIONS)
TABLE 94. INDONESIA SHALE GAS MARKET SIZE ESTIMATES & FORECAST, BY METHOD OF EXTRACTION, 2019-2035 (USD BILLIONS)
TABLE 95. INDONESIA SHALE GAS MARKET SIZE ESTIMATES & FORECAST, BY MARKET PLAYER TYPE, 2019-2035 (USD BILLIONS)
TABLE 96. INDONESIA SHALE GAS MARKET SIZE ESTIMATES & FORECAST, BY REGIONAL, 2019-2035 (USD BILLIONS)
TABLE 97. REST OF APAC SHALE GAS MARKET SIZE ESTIMATES & FORECAST, BY APPLICATION, 2019-2035 (USD BILLIONS)
TABLE 98. REST OF APAC SHALE GAS MARKET SIZE ESTIMATES & FORECAST, BY END USE, 2019-2035 (USD BILLIONS)
TABLE 99. REST OF APAC SHALE GAS MARKET SIZE ESTIMATES & FORECAST, BY METHOD OF EXTRACTION, 2019-2035 (USD BILLIONS)
TABLE 100. REST OF APAC SHALE GAS MARKET SIZE ESTIMATES & FORECAST, BY MARKET PLAYER TYPE, 2019-2035 (USD BILLIONS)
TABLE 101. REST OF APAC SHALE GAS MARKET SIZE ESTIMATES & FORECAST, BY REGIONAL, 2019-2035 (USD BILLIONS)
TABLE 102. SOUTH AMERICA SHALE GAS MARKET SIZE ESTIMATES & FORECAST, BY APPLICATION, 2019-2035 (USD BILLIONS)
TABLE 103. SOUTH AMERICA SHALE GAS MARKET SIZE ESTIMATES & FORECAST, BY END USE, 2019-2035 (USD BILLIONS)
TABLE 104. SOUTH AMERICA SHALE GAS MARKET SIZE ESTIMATES & FORECAST, BY METHOD OF EXTRACTION, 2019-2035 (USD BILLIONS)
TABLE 105. SOUTH AMERICA SHALE GAS MARKET SIZE ESTIMATES & FORECAST, BY MARKET PLAYER TYPE, 2019-2035 (USD BILLIONS)
TABLE 106. SOUTH AMERICA SHALE GAS MARKET SIZE ESTIMATES & FORECAST, BY REGIONAL, 2019-2035 (USD BILLIONS)
TABLE 107. BRAZIL SHALE GAS MARKET SIZE ESTIMATES & FORECAST, BY APPLICATION, 2019-2035 (USD BILLIONS)
TABLE 108. BRAZIL SHALE GAS MARKET SIZE ESTIMATES & FORECAST, BY END USE, 2019-2035 (USD BILLIONS)
TABLE 109. BRAZIL SHALE GAS MARKET SIZE ESTIMATES & FORECAST, BY METHOD OF EXTRACTION, 2019-2035 (USD BILLIONS)
TABLE 110. BRAZIL SHALE GAS MARKET SIZE ESTIMATES & FORECAST, BY MARKET PLAYER TYPE, 2019-2035 (USD BILLIONS)
TABLE 111. BRAZIL SHALE GAS MARKET SIZE ESTIMATES & FORECAST, BY REGIONAL, 2019-2035 (USD BILLIONS)
TABLE 112. MEXICO SHALE GAS MARKET SIZE ESTIMATES & FORECAST, BY APPLICATION, 2019-2035 (USD BILLIONS)
TABLE 113. MEXICO SHALE GAS MARKET SIZE ESTIMATES & FORECAST, BY END USE, 2019-2035 (USD BILLIONS)
TABLE 114. MEXICO SHALE GAS MARKET SIZE ESTIMATES & FORECAST, BY METHOD OF EXTRACTION, 2019-2035 (USD BILLIONS)
TABLE 115. MEXICO SHALE GAS MARKET SIZE ESTIMATES & FORECAST, BY MARKET PLAYER TYPE, 2019-2035 (USD BILLIONS)
TABLE 116. MEXICO SHALE GAS MARKET SIZE ESTIMATES & FORECAST, BY REGIONAL, 2019-2035 (USD BILLIONS)
TABLE 117. ARGENTINA SHALE GAS MARKET SIZE ESTIMATES & FORECAST, BY APPLICATION, 2019-2035 (USD BILLIONS)
TABLE 118. ARGENTINA SHALE GAS MARKET SIZE ESTIMATES & FORECAST, BY END USE, 2019-2035 (USD BILLIONS)
TABLE 119. ARGENTINA SHALE GAS MARKET SIZE ESTIMATES & FORECAST, BY METHOD OF EXTRACTION, 2019-2035 (USD BILLIONS)
TABLE 120. ARGENTINA SHALE GAS MARKET SIZE ESTIMATES & FORECAST, BY MARKET PLAYER TYPE, 2019-2035 (USD BILLIONS)
TABLE 121. ARGENTINA SHALE GAS MARKET SIZE ESTIMATES & FORECAST, BY REGIONAL, 2019-2035 (USD BILLIONS)
TABLE 122. REST OF SOUTH AMERICA SHALE GAS MARKET SIZE ESTIMATES & FORECAST, BY APPLICATION, 2019-2035 (USD BILLIONS)
TABLE 123. REST OF SOUTH AMERICA SHALE GAS MARKET SIZE ESTIMATES & FORECAST, BY END USE, 2019-2035 (USD BILLIONS)
TABLE 124. REST OF SOUTH AMERICA SHALE GAS MARKET SIZE ESTIMATES & FORECAST, BY METHOD OF EXTRACTION, 2019-2035 (USD BILLIONS)
TABLE 125. REST OF SOUTH AMERICA SHALE GAS MARKET SIZE ESTIMATES & FORECAST, BY MARKET PLAYER TYPE, 2019-2035 (USD BILLIONS)
TABLE 126. REST OF SOUTH AMERICA SHALE GAS MARKET SIZE ESTIMATES & FORECAST, BY REGIONAL, 2019-2035 (USD BILLIONS)
TABLE 127. MEA SHALE GAS MARKET SIZE ESTIMATES & FORECAST, BY APPLICATION, 2019-2035 (USD BILLIONS)
TABLE 128. MEA SHALE GAS MARKET SIZE ESTIMATES & FORECAST, BY END USE, 2019-2035 (USD BILLIONS)
TABLE 129. MEA SHALE GAS MARKET SIZE ESTIMATES & FORECAST, BY METHOD OF EXTRACTION, 2019-2035 (USD BILLIONS)
TABLE 130. MEA SHALE GAS MARKET SIZE ESTIMATES & FORECAST, BY MARKET PLAYER TYPE, 2019-2035 (USD BILLIONS)
TABLE 131. MEA SHALE GAS MARKET SIZE ESTIMATES & FORECAST, BY REGIONAL, 2019-2035 (USD BILLIONS)
TABLE 132. GCC COUNTRIES SHALE GAS MARKET SIZE ESTIMATES & FORECAST, BY APPLICATION, 2019-2035 (USD BILLIONS)
TABLE 133. GCC COUNTRIES SHALE GAS MARKET SIZE ESTIMATES & FORECAST, BY END USE, 2019-2035 (USD BILLIONS)
TABLE 134. GCC COUNTRIES SHALE GAS MARKET SIZE ESTIMATES & FORECAST, BY METHOD OF EXTRACTION, 2019-2035 (USD BILLIONS)
TABLE 135. GCC COUNTRIES SHALE GAS MARKET SIZE ESTIMATES & FORECAST, BY MARKET PLAYER TYPE, 2019-2035 (USD BILLIONS)
TABLE 136. GCC COUNTRIES SHALE GAS MARKET SIZE ESTIMATES & FORECAST, BY REGIONAL, 2019-2035 (USD BILLIONS)
TABLE 137. SOUTH AFRICA SHALE GAS MARKET SIZE ESTIMATES & FORECAST, BY APPLICATION, 2019-2035 (USD BILLIONS)
TABLE 138. SOUTH AFRICA SHALE GAS MARKET SIZE ESTIMATES & FORECAST, BY END USE, 2019-2035 (USD BILLIONS)
TABLE 139. SOUTH AFRICA SHALE GAS MARKET SIZE ESTIMATES & FORECAST, BY METHOD OF EXTRACTION, 2019-2035 (USD BILLIONS)
TABLE 140. SOUTH AFRICA SHALE GAS MARKET SIZE ESTIMATES & FORECAST, BY MARKET PLAYER TYPE, 2019-2035 (USD BILLIONS)
TABLE 141. SOUTH AFRICA SHALE GAS MARKET SIZE ESTIMATES & FORECAST, BY REGIONAL, 2019-2035 (USD BILLIONS)
TABLE 142. REST OF MEA SHALE GAS MARKET SIZE ESTIMATES & FORECAST, BY APPLICATION, 2019-2035 (USD BILLIONS)
TABLE 143. REST OF MEA SHALE GAS MARKET SIZE ESTIMATES & FORECAST, BY END USE, 2019-2035 (USD BILLIONS)
TABLE 144. REST OF MEA SHALE GAS MARKET SIZE ESTIMATES & FORECAST, BY METHOD OF EXTRACTION, 2019-2035 (USD BILLIONS)
TABLE 145. REST OF MEA SHALE GAS MARKET SIZE ESTIMATES & FORECAST, BY MARKET PLAYER TYPE, 2019-2035 (USD BILLIONS)
TABLE 146. REST OF MEA SHALE GAS MARKET SIZE ESTIMATES & FORECAST, BY REGIONAL, 2019-2035 (USD BILLIONS)
TABLE 147. PRODUCT LAUNCH/PRODUCT DEVELOPMENT/APPROVAL
TABLE 148. ACQUISITION/PARTNERSHIP


LIST OF FIGURES


FIGURE 1. MARKET SYNOPSIS
FIGURE 2. NORTH AMERICA SHALE GAS MARKET ANALYSIS
FIGURE 3. US SHALE GAS MARKET ANALYSIS BY APPLICATION
FIGURE 4. US SHALE GAS MARKET ANALYSIS BY END USE
FIGURE 5. US SHALE GAS MARKET ANALYSIS BY METHOD OF EXTRACTION
FIGURE 6. US SHALE GAS MARKET ANALYSIS BY MARKET PLAYER TYPE
FIGURE 7. US SHALE GAS MARKET ANALYSIS BY REGIONAL
FIGURE 8. CANADA SHALE GAS MARKET ANALYSIS BY APPLICATION
FIGURE 9. CANADA SHALE GAS MARKET ANALYSIS BY END USE
FIGURE 10. CANADA SHALE GAS MARKET ANALYSIS BY METHOD OF EXTRACTION
FIGURE 11. CANADA SHALE GAS MARKET ANALYSIS BY MARKET PLAYER TYPE
FIGURE 12. CANADA SHALE GAS MARKET ANALYSIS BY REGIONAL
FIGURE 13. EUROPE SHALE GAS MARKET ANALYSIS
FIGURE 14. GERMANY SHALE GAS MARKET ANALYSIS BY APPLICATION
FIGURE 15. GERMANY SHALE GAS MARKET ANALYSIS BY END USE
FIGURE 16. GERMANY SHALE GAS MARKET ANALYSIS BY METHOD OF EXTRACTION
FIGURE 17. GERMANY SHALE GAS MARKET ANALYSIS BY MARKET PLAYER TYPE
FIGURE 18. GERMANY SHALE GAS MARKET ANALYSIS BY REGIONAL
FIGURE 19. UK SHALE GAS MARKET ANALYSIS BY APPLICATION
FIGURE 20. UK SHALE GAS MARKET ANALYSIS BY END USE
FIGURE 21. UK SHALE GAS MARKET ANALYSIS BY METHOD OF EXTRACTION
FIGURE 22. UK SHALE GAS MARKET ANALYSIS BY MARKET PLAYER TYPE
FIGURE 23. UK SHALE GAS MARKET ANALYSIS BY REGIONAL
FIGURE 24. FRANCE SHALE GAS MARKET ANALYSIS BY APPLICATION
FIGURE 25. FRANCE SHALE GAS MARKET ANALYSIS BY END USE
FIGURE 26. FRANCE SHALE GAS MARKET ANALYSIS BY METHOD OF EXTRACTION
FIGURE 27. FRANCE SHALE GAS MARKET ANALYSIS BY MARKET PLAYER TYPE
FIGURE 28. FRANCE SHALE GAS MARKET ANALYSIS BY REGIONAL
FIGURE 29. RUSSIA SHALE GAS MARKET ANALYSIS BY APPLICATION
FIGURE 30. RUSSIA SHALE GAS MARKET ANALYSIS BY END USE
FIGURE 31. RUSSIA SHALE GAS MARKET ANALYSIS BY METHOD OF EXTRACTION
FIGURE 32. RUSSIA SHALE GAS MARKET ANALYSIS BY MARKET PLAYER TYPE
FIGURE 33. RUSSIA SHALE GAS MARKET ANALYSIS BY REGIONAL
FIGURE 34. ITALY SHALE GAS MARKET ANALYSIS BY APPLICATION
FIGURE 35. ITALY SHALE GAS MARKET ANALYSIS BY END USE
FIGURE 36. ITALY SHALE GAS MARKET ANALYSIS BY METHOD OF EXTRACTION
FIGURE 37. ITALY SHALE GAS MARKET ANALYSIS BY MARKET PLAYER TYPE
FIGURE 38. ITALY SHALE GAS MARKET ANALYSIS BY REGIONAL
FIGURE 39. SPAIN SHALE GAS MARKET ANALYSIS BY APPLICATION
FIGURE 40. SPAIN SHALE GAS MARKET ANALYSIS BY END USE
FIGURE 41. SPAIN SHALE GAS MARKET ANALYSIS BY METHOD OF EXTRACTION
FIGURE 42. SPAIN SHALE GAS MARKET ANALYSIS BY MARKET PLAYER TYPE
FIGURE 43. SPAIN SHALE GAS MARKET ANALYSIS BY REGIONAL
FIGURE 44. REST OF EUROPE SHALE GAS MARKET ANALYSIS BY APPLICATION
FIGURE 45. REST OF EUROPE SHALE GAS MARKET ANALYSIS BY END USE
FIGURE 46. REST OF EUROPE SHALE GAS MARKET ANALYSIS BY METHOD OF EXTRACTION
FIGURE 47. REST OF EUROPE SHALE GAS MARKET ANALYSIS BY MARKET PLAYER TYPE
FIGURE 48. REST OF EUROPE SHALE GAS MARKET ANALYSIS BY REGIONAL
FIGURE 49. APAC SHALE GAS MARKET ANALYSIS
FIGURE 50. CHINA SHALE GAS MARKET ANALYSIS BY APPLICATION
FIGURE 51. CHINA SHALE GAS MARKET ANALYSIS BY END USE
FIGURE 52. CHINA SHALE GAS MARKET ANALYSIS BY METHOD OF EXTRACTION
FIGURE 53. CHINA SHALE GAS MARKET ANALYSIS BY MARKET PLAYER TYPE
FIGURE 54. CHINA SHALE GAS MARKET ANALYSIS BY REGIONAL
FIGURE 55. INDIA SHALE GAS MARKET ANALYSIS BY APPLICATION
FIGURE 56. INDIA SHALE GAS MARKET ANALYSIS BY END USE
FIGURE 57. INDIA SHALE GAS MARKET ANALYSIS BY METHOD OF EXTRACTION
FIGURE 58. INDIA SHALE GAS MARKET ANALYSIS BY MARKET PLAYER TYPE
FIGURE 59. INDIA SHALE GAS MARKET ANALYSIS BY REGIONAL
FIGURE 60. JAPAN SHALE GAS MARKET ANALYSIS BY APPLICATION
FIGURE 61. JAPAN SHALE GAS MARKET ANALYSIS BY END USE
FIGURE 62. JAPAN SHALE GAS MARKET ANALYSIS BY METHOD OF EXTRACTION
FIGURE 63. JAPAN SHALE GAS MARKET ANALYSIS BY MARKET PLAYER TYPE
FIGURE 64. JAPAN SHALE GAS MARKET ANALYSIS BY REGIONAL
FIGURE 65. SOUTH KOREA SHALE GAS MARKET ANALYSIS BY APPLICATION
FIGURE 66. SOUTH KOREA SHALE GAS MARKET ANALYSIS BY END USE
FIGURE 67. SOUTH KOREA SHALE GAS MARKET ANALYSIS BY METHOD OF EXTRACTION
FIGURE 68. SOUTH KOREA SHALE GAS MARKET ANALYSIS BY MARKET PLAYER TYPE
FIGURE 69. SOUTH KOREA SHALE GAS MARKET ANALYSIS BY REGIONAL
FIGURE 70. MALAYSIA SHALE GAS MARKET ANALYSIS BY APPLICATION
FIGURE 71. MALAYSIA SHALE GAS MARKET ANALYSIS BY END USE
FIGURE 72. MALAYSIA SHALE GAS MARKET ANALYSIS BY METHOD OF EXTRACTION
FIGURE 73. MALAYSIA SHALE GAS MARKET ANALYSIS BY MARKET PLAYER TYPE
FIGURE 74. MALAYSIA SHALE GAS MARKET ANALYSIS BY REGIONAL
FIGURE 75. THAILAND SHALE GAS MARKET ANALYSIS BY APPLICATION
FIGURE 76. THAILAND SHALE GAS MARKET ANALYSIS BY END USE
FIGURE 77. THAILAND SHALE GAS MARKET ANALYSIS BY METHOD OF EXTRACTION
FIGURE 78. THAILAND SHALE GAS MARKET ANALYSIS BY MARKET PLAYER TYPE
FIGURE 79. THAILAND SHALE GAS MARKET ANALYSIS BY REGIONAL
FIGURE 80. INDONESIA SHALE GAS MARKET ANALYSIS BY APPLICATION
FIGURE 81. INDONESIA SHALE GAS MARKET ANALYSIS BY END USE
FIGURE 82. INDONESIA SHALE GAS MARKET ANALYSIS BY METHOD OF EXTRACTION
FIGURE 83. INDONESIA SHALE GAS MARKET ANALYSIS BY MARKET PLAYER TYPE
FIGURE 84. INDONESIA SHALE GAS MARKET ANALYSIS BY REGIONAL
FIGURE 85. REST OF APAC SHALE GAS MARKET ANALYSIS BY APPLICATION
FIGURE 86. REST OF APAC SHALE GAS MARKET ANALYSIS BY END USE
FIGURE 87. REST OF APAC SHALE GAS MARKET ANALYSIS BY METHOD OF EXTRACTION
FIGURE 88. REST OF APAC SHALE GAS MARKET ANALYSIS BY MARKET PLAYER TYPE
FIGURE 89. REST OF APAC SHALE GAS MARKET ANALYSIS BY REGIONAL
FIGURE 90. SOUTH AMERICA SHALE GAS MARKET ANALYSIS
FIGURE 91. BRAZIL SHALE GAS MARKET ANALYSIS BY APPLICATION
FIGURE 92. BRAZIL SHALE GAS MARKET ANALYSIS BY END USE
FIGURE 93. BRAZIL SHALE GAS MARKET ANALYSIS BY METHOD OF EXTRACTION
FIGURE 94. BRAZIL SHALE GAS MARKET ANALYSIS BY MARKET PLAYER TYPE
FIGURE 95. BRAZIL SHALE GAS MARKET ANALYSIS BY REGIONAL
FIGURE 96. MEXICO SHALE GAS MARKET ANALYSIS BY APPLICATION
FIGURE 97. MEXICO SHALE GAS MARKET ANALYSIS BY END USE
FIGURE 98. MEXICO SHALE GAS MARKET ANALYSIS BY METHOD OF EXTRACTION
FIGURE 99. MEXICO SHALE GAS MARKET ANALYSIS BY MARKET PLAYER TYPE
FIGURE 100. MEXICO SHALE GAS MARKET ANALYSIS BY REGIONAL
FIGURE 101. ARGENTINA SHALE GAS MARKET ANALYSIS BY APPLICATION
FIGURE 102. ARGENTINA SHALE GAS MARKET ANALYSIS BY END USE
FIGURE 103. ARGENTINA SHALE GAS MARKET ANALYSIS BY METHOD OF EXTRACTION
FIGURE 104. ARGENTINA SHALE GAS MARKET ANALYSIS BY MARKET PLAYER TYPE
FIGURE 105. ARGENTINA SHALE GAS MARKET ANALYSIS BY REGIONAL
FIGURE 106. REST OF SOUTH AMERICA SHALE GAS MARKET ANALYSIS BY APPLICATION
FIGURE 107. REST OF SOUTH AMERICA SHALE GAS MARKET ANALYSIS BY END USE
FIGURE 108. REST OF SOUTH AMERICA SHALE GAS MARKET ANALYSIS BY METHOD OF EXTRACTION
FIGURE 109. REST OF SOUTH AMERICA SHALE GAS MARKET ANALYSIS BY MARKET PLAYER TYPE
FIGURE 110. REST OF SOUTH AMERICA SHALE GAS MARKET ANALYSIS BY REGIONAL
FIGURE 111. MEA SHALE GAS MARKET ANALYSIS
FIGURE 112. GCC COUNTRIES SHALE GAS MARKET ANALYSIS BY APPLICATION
FIGURE 113. GCC COUNTRIES SHALE GAS MARKET ANALYSIS BY END USE
FIGURE 114. GCC COUNTRIES SHALE GAS MARKET ANALYSIS BY METHOD OF EXTRACTION
FIGURE 115. GCC COUNTRIES SHALE GAS MARKET ANALYSIS BY MARKET PLAYER TYPE
FIGURE 116. GCC COUNTRIES SHALE GAS MARKET ANALYSIS BY REGIONAL
FIGURE 117. SOUTH AFRICA SHALE GAS MARKET ANALYSIS BY APPLICATION
FIGURE 118. SOUTH AFRICA SHALE GAS MARKET ANALYSIS BY END USE
FIGURE 119. SOUTH AFRICA SHALE GAS MARKET ANALYSIS BY METHOD OF EXTRACTION
FIGURE 120. SOUTH AFRICA SHALE GAS MARKET ANALYSIS BY MARKET PLAYER TYPE
FIGURE 121. SOUTH AFRICA SHALE GAS MARKET ANALYSIS BY REGIONAL
FIGURE 122. REST OF MEA SHALE GAS MARKET ANALYSIS BY APPLICATION
FIGURE 123. REST OF MEA SHALE GAS MARKET ANALYSIS BY END USE
FIGURE 124. REST OF MEA SHALE GAS MARKET ANALYSIS BY METHOD OF EXTRACTION
FIGURE 125. REST OF MEA SHALE GAS MARKET ANALYSIS BY MARKET PLAYER TYPE
FIGURE 126. REST OF MEA SHALE GAS MARKET ANALYSIS BY REGIONAL
FIGURE 127. KEY BUYING CRITERIA OF SHALE GAS MARKET
FIGURE 128. RESEARCH PROCESS OF MRFR
FIGURE 129. DRO ANALYSIS OF SHALE GAS MARKET
FIGURE 130. DRIVERS IMPACT ANALYSIS: SHALE GAS MARKET
FIGURE 131. RESTRAINTS IMPACT ANALYSIS: SHALE GAS MARKET
FIGURE 132. SUPPLY / VALUE CHAIN: SHALE GAS MARKET
FIGURE 133. SHALE GAS MARKET, BY APPLICATION, 2025 (% SHARE)
FIGURE 134. SHALE GAS MARKET, BY APPLICATION, 2019 TO 2035 (USD Billions)
FIGURE 135. SHALE GAS MARKET, BY END USE, 2025 (% SHARE)
FIGURE 136. SHALE GAS MARKET, BY END USE, 2019 TO 2035 (USD Billions)
FIGURE 137. SHALE GAS MARKET, BY METHOD OF EXTRACTION, 2025 (% SHARE)
FIGURE 138. SHALE GAS MARKET, BY METHOD OF EXTRACTION, 2019 TO 2035 (USD Billions)
FIGURE 139. SHALE GAS MARKET, BY MARKET PLAYER TYPE, 2025 (% SHARE)
FIGURE 140. SHALE GAS MARKET, BY MARKET PLAYER TYPE, 2019 TO 2035 (USD Billions)
FIGURE 141. SHALE GAS MARKET, BY REGIONAL, 2025 (% SHARE)
FIGURE 142. SHALE GAS MARKET, BY REGIONAL, 2019 TO 2035 (USD Billions)
FIGURE 143. BENCHMARKING OF MAJOR COMPETITORS


Purchase Option
Single User $ 4,950
Multiuser License $ 5,950
Enterprise User $ 7,250
Compare Licenses
Tailored for You
  • Dedicated Research on any specifics segment or region.
  • Focused Research on specific players in the market.
  • Custom Report based only on your requirements.
  • Flexibility to add or subtract any chapter in the study.
  • Historic data from 2014 and forecasts outlook till 2040.
  • Flexibility of providing data/insights in formats (PDF, PPT, Excel).
  • Provide cross segmentation in applicable scenario/markets.
report-img