Shrimp Market

Key Players: Thai Union Group, Charoen Pokphand Foods (CPF), Maruha Nichiro, Nireus Aquaculture, Songa Group, Clearwater Seafoods, Apex Frozen Foods, Omarsa S.A.

Shrimp Market

Shrimp Market Size, Share, Industry Trend & Analysis Research Report By Species (Pink Shrimp, Tiger Shrimp, Others), By Form (Frozen, Canned, Fresh/Chilled), By Source (Farmed, Wild-Caught), By Distribution Channel (On-Trade, Off-Trade)- Forecast to 2035
ID: MRFR/FnB/10000-HCR
128 Pages
Tejas Chaudhary
Last Updated: June 12, 2026
 

Shrimp Market Summary

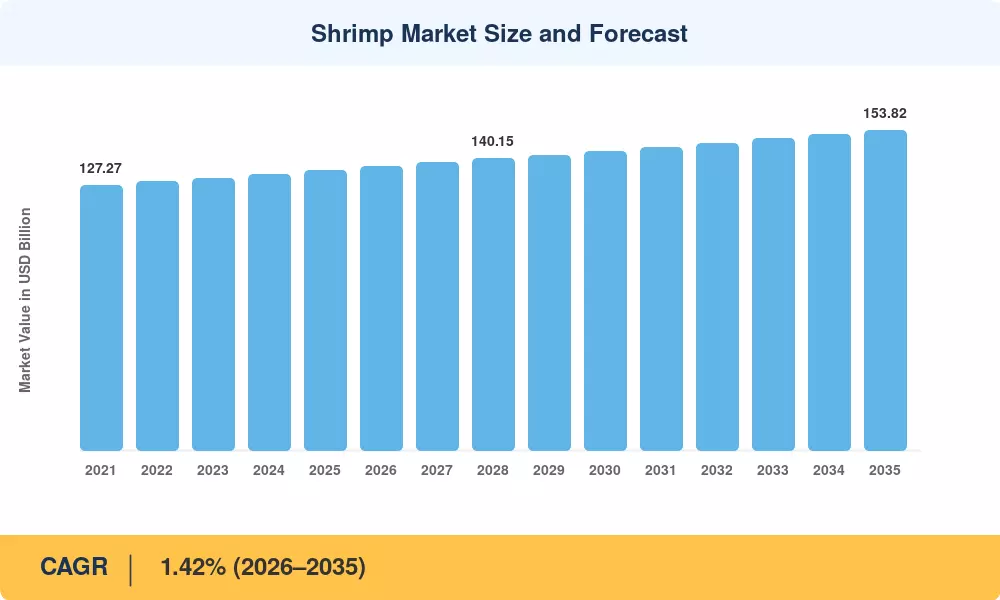
The global Shrimp Market stood at USD 134.67 billion in 2025 and is projected to reach USD 136.58 billion in 2026 before climbing to USD 153.82 billion by 2035, registering a CAGR of 1.42% during the forecast period. Rising per-capita seafood consumption in Asia-Pacific — where governments have rolled out multi-billion-dollar aquaculture modernization programs — and growing demand for peeled and deveined shrimp across Western foodservice channels are the two structural forces propelling this trajectory[2].

A fundamental shift is underway in how shrimp reach the consumer's plate. Land-based recirculating aquaculture systems (RAS) are displacing traditional open-pond operations, driven by climate volatility and the spread of early-mortality syndrome across Southeast Asian farms. Thailand's Department of Fisheries committed approximately USD 420 million between 2023 and 2026 to subsidize RAS conversions, while Ecuador's shrimp aquaculture production capacity expanded 11% year-on-year in 2024 through vertically integrated hatchery-to-export corridors [3][4].

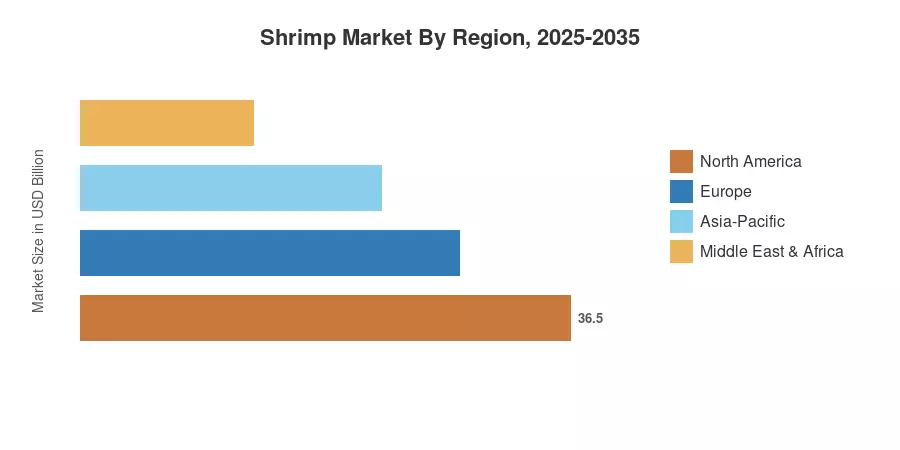
Asia-Pacific commands roughly 48.4% of the global Shrimp Market revenue, anchored by China, India, and Vietnam. Europe is the fastest-growing region at an estimated 2.36% CAGR through 2035, fueled by sustainability-focused procurement mandates and rising consumer preference for frozen and fresh shrimp products. North America retains the second-largest share at approximately 21%, where foodservice recovery and retail expansion of white and black tiger shrimp products continue to drive imports. The decade ahead will be shaped by traceability technologies and shifting trade flows as farmed and wild-caught shrimp supply chains reconfigure around ESG benchmarks [5][6].


Key Report Takeaways

• By Species

  • Pink shrimp accounted for 42.3% of the Shrimp Market in 2025, led by large-scale farmed and wild-caught shrimp harvests across the Gulf of Mexico and Indian Ocean corridors
  • Tiger shrimp — including white and black tiger shrimp varieties — are projected to expand at a 2.55% CAGR through 2035 as improved hatchery genetics boost survival rates

• By Form

  • Frozen and fresh shrimp in the frozen segment captured 59.8% of the Shrimp Market share in 2025, reflecting cold-chain infrastructure maturation across Asia-Pacific
  • Canned shrimp products are forecast to grow at a 3.95% CAGR, driven by shelf-stable convenience trends in emerging economies

• By Source

  • Farmed shrimp supplied 55.8% of global volume in the Shrimp Market, with shrimp aquaculture production expanding in Ecuador and India
  • Wild-caught shrimp output is set to rise at a 3.40% CAGR, maintaining a premium among quality-conscious buyers in Europe and Japan

• By Distribution Channel

  • On-trade channels retained 58.7% share in 2025, though off-trade retail of peeled and deveined shrimp is accelerating at a 2.65% CAGR

• By Region

  • Asia-Pacific commanded 48.4% of the 2025 Shrimp Market revenue
  • Europe is poised for the fastest expansion at a 2.36% CAGR to 2035


Market Size and Forecast (2021–2035)

MRFR's valuation model combines FAO production statistics, national customs trade data, processor-level revenue disclosures, and proprietary demand surveys across 32 countries. Historical figures (2021–2024) are reconciled against published export/import volumes, while forecast values (2026–2035) are generated through econometric demand modeling calibrated to GDP growth, protein substitution elasticity, and aquaculture capacity expansion timelines.

Shrimp Market Size and Forecast
Our Impact
Enabled $4.3B Revenue Impact for Fortune 500 and Leading Multinationals
Partnering with 2000+ Global Organizations Each Year
30K+ Citations by Top-Tier Firms in the Industry
 

Driver Impact Analysis

Driver ~% Impact on CAGR Geographic Relevance Impact Timeline
Rising global seafood protein demand +0.35% Global Long-term (≥4 yr)
Shrimp aquaculture production expansion +0.30% Asia-Pacific, South America Medium-term (2–4 yr)
Cold-chain and frozen shrimp logistics modernization +0.20% Asia-Pacific, Europe Short-term (≤2 yr)
Growth of peeled and deveined shrimp retail SKUs +0.18% North America, Europe Short-term (≤2 yr)
RAS and biosecurity technology adoption +0.15% Global Long-term (≥4 yr)
E-commerce and off-trade channel penetration +0.12% North America, Asia-Pacific Medium-term (2–4 yr)
Sustainability certification and ESG procurement +0.10% Europe Medium-term (2–4 yr)


Rising Global Seafood Protein Demand

The UN FAO projects global per-capita fish consumption will reach 21.4 kg by 2030, up from 20.2 kg in 2022 [2]. Shrimp accounts for roughly 16% of all internationally traded seafood by value, making the Shrimp Market a direct beneficiary of this protein transition. In the United States alone, shrimp has remained the top-consumed seafood species for over two decades, with annual per-capita intake exceeding 2.0 kg — a figure that continues to climb as quick-service restaurants expand shrimp-based menu offerings and retailers stock more frozen and fresh shrimp varieties.

Shrimp Aquaculture Production Expansion

Ecuador overtook India as the world's largest shrimp exporter in 2023, shipping over 1.1 million metric tons valued at approximately USD 6.7 billion [3]. This reflects a broader trend: shrimp aquaculture production now supplies the majority of global output, with intensive and semi-intensive pond systems in Ecuador, Vietnam, and Indonesia achieving survival rates above 80% through improved post-larvae genetics and probiotic-based pond management. India's Pradhan Mantri Matsya Sampada Yojana (PMMSY) allocated INR 20,050 crore (~USD 2.4 billion) to boost farmed and wild-caught shrimp infrastructure through 2025 [4].

Cold-Chain and Processing Infrastructure Investment

The proliferation of individually quick-frozen (IQF) processing lines across Southeast Asia has transformed the frozen shrimp supply chain. Vietnam invested approximately USD 1.2 billion in seafood processing upgrades between 2022 and 2024, enabling processors to deliver peeled and deveined shrimp at scale with shelf lives exceeding 18 months [7]. This infrastructure directly supports Shrimp Market growth in import-dependent regions like Europe and North America, where retailers demand a consistent year-round supply.

E-Commerce and Off-Trade Channel Penetration

Online seafood sales in China grew 28% year-on-year in 2024, with shrimp ranking as the top-purchased fresh protein category on platforms like JD.com and Hema [13]. The shift toward off-trade channels benefits processors offering consumer-ready formats — particularly peeled and deveined shrimp packs and marinated white and black tiger shrimp products — positioning the Shrimp Market for sustained retail-driven growth.


Restraints Impact Analysis

Restraint impact estimates follow the same directional methodology described in Section 4. These represent headwinds that moderate the Shrimp Market's baseline growth trajectory.

Restraint ~% Impact on CAGR Geographic Relevance Impact Timeline
Disease outbreaks (EMS, WSSV, EHP) −0.25% Asia-Pacific Ongoing
Environmental regulation and pond conversion limits −0.15% Southeast Asia, South America Medium-term (2–4 yr)
Import tariff volatility and trade disputes −0.12% North America, Asia-Pacific Short-term (≤2 yr)
Feed cost inflation (fishmeal, soybean) −0.10% Global Short-term (≤2 yr)
Consumer concerns over antibiotic residues −0.08% Europe, North America Long-term (≥4 yr)


Disease Outbreaks in Major Production Zones

Early mortality syndrome (EMS) and white spot syndrome virus (WSSV) remain the Shrimp Market's most persistent biological threats. Thailand's shrimp output fell roughly 40% between 2013 and 2020 due to recurring EMS outbreaks, and although recovery has been underway, the country's production in 2024 was still approximately 30% below its 2012 peak [4]. India's Andhra Pradesh — which accounts for over 70% of national farmed and wild-caught shrimp output — experienced localized EHP (Enterocytozoon hepatopenaei) flare-ups in 2024 that reduced stocking densities by an estimated 15% in affected districts [17].

Feed Cost Inflation

Fishmeal prices averaged USD 1,680 per metric ton in 2024, up 22% from 2021, driven by reduced anchovy catches off Peru and surging aquafeed demand globally [16]. Feed constitutes 50–60% of shrimp aquaculture production costs, making the Shrimp Market highly sensitive to commodity cycles. While plant-based and insect-meal alternatives are gaining traction, commercial-scale substitution remains limited to 20–30% inclusion rates without compromising growth performance in white and black tiger shrimp species.

Trade Friction and Tariff Uncertainty

The U.S. Department of Commerce imposed anti-dumping duties ranging from 4.36% to 25.39% on frozen shrimp imports from India, Vietnam, and Ecuador in 2024 [15]. Such measures introduce pricing volatility that disrupts procurement planning for major U.S. importers and creates uncertainty in the broader Shrimp Market, pushing some buyers toward alternative sourcing from Indonesia and Thailand.


Shrimp Market Opportunities

Recirculating Aquaculture Systems (RAS) for Near-Shore Shrimp Farming

RAS technology enables land-based, climate-controlled shrimp aquaculture production that eliminates disease transmission from open water sources. The global RAS shrimp sector attracted over USD 800 million in venture and project financing between 2022 and 2025, with facilities operational or under construction in Saudi Arabia, the United States, and Spain [11]. This represents a structural opportunity to relocate production closer to consumption centers, reducing freight costs and carbon footprints while delivering premium frozen and fresh shrimp

Value-Added and Ready-to-Cook Product Innovation

Consumer demand for convenience is accelerating growth in peeled and deveined shrimp, pre-marinated skewers, and breaded shrimp formats. In the U.S. retail channel, value-added shrimp products grew at nearly twice the rate of commodity-grade packs in 2024. Processors that invest in flavor innovation and portion-controlled packaging stand to capture disproportionate Shrimp Market share in mature Western economies

Sustainability Certification and Traceability Premiums

ASC-certified shrimp commands a 12–18% price premium in European retail, and major buyers like Tesco and Carrefour have committed to sourcing 100% certified shrimp by 2030 [9]. Blockchain-enabled traceability platforms are emerging as a differentiation tool, particularly for farmed and wild-caught shrimp sold into ESG-conscious institutional channels

Emerging Markets in Africa and the Middle East

The Middle East's shrimp import volume grew 9.4% year-on-year in 2024, driven by hospitality-sector expansion in Saudi Arabia and the UAE [18]. Saudi Arabia's National Aquaculture Strategy targets 100,000 metric tons of domestic shrimp aquaculture production by 2030 — a fivefold increase from 2023 levels — creating both import-substitution and export opportunities for the Shrimp Market

Data-Driven Aquaculture and Precision Feeding

IoT-enabled pond monitoring and AI-based feeding optimization can reduce feed conversion ratios by 15–20%, directly lowering production costs for white and black tiger shrimp operations. Companies deploying sensor networks and predictive analytics across shrimp aquaculture production clusters in Indonesia and Vietnam are already reporting 10–12% yield improvements


Shrimp Market Future Outlook

Precision Aquaculture and AI-Driven Farming

Artificial intelligence is transforming shrimp aquaculture production through automated feeding systems, computer-vision-based health monitoring, and predictive disease analytics. The global precision aquaculture technology sector is projected to exceed USD 1.5 billion by 2030, with shrimp farming as its largest application segment. These technologies will reshape the Shrimp Market's cost structure by reducing feed waste by 15–20% and enabling early disease intervention that prevents catastrophic pond losses.

Supply Chain Digitalization and Traceability

Blockchain-based traceability platforms are moving from the pilot phase to commercial deployment across the frozen and fresh shrimp supply chain. Walmart and Costco now require end-to-end digital traceability for imported shrimp, covering hatchery origin, feed inputs, processing timestamps, and cold-chain temperature logs [20]. This trend benefits farmed and wild-caught shrimp producers that invest in digital infrastructure and positions the Shrimp Market for greater transparency-driven consumer trust.

Climate Adaptation and Resilient Production Models

Sea-level rise, ocean warming, and increased cyclone frequency threaten coastal shrimp ponds across Bangladesh, Vietnam, and Thailand. The World Bank estimates that climate adaptation investments in Asian aquaculture need to reach USD 3 billion annually by 2030 to maintain current production levels [21]. RAS and biofloc technology offer climate-resilient alternatives that will increasingly reshape the geographic distribution of shrimp aquaculture production and Shrimp Market supply dynamics.

ESG Integration and Sustainable Sourcing Mandates

The EU's Corporate Sustainability Reporting Directive (CSRD), effective from 2024, requires major importers to disclose environmental impacts across seafood supply chains [9]. This regulatory framework will accelerate ASC and BAP certification adoption among exporters of farmed and wild-caught shrimp, creating a two-tier Shrimp Market where certified producers capture premium pricing and uncertified volumes face shrinking market access in Europe and North America.


Shrimp Market Segmentation

By Species

Segment Key Metric Primary Demand Driver
Pink Shrimp 42.3% share (2025) High availability from farmed and wild-caught sources
Tiger Shrimp 2.55% CAGR (2026–2035) White and black tiger shrimp breeding innovations
Others USD 18.92 Billion (2025) Specialty species for regional cuisines


The Shrimp Market's species landscape is anchored by pink shrimp (Penaeus duorarum and related species), which dominate global trade due to wide availability and competitive farming economics. However, tiger shrimp — particularly white and black tiger shrimp (Penaeus monodon) — are re-emerging as premium products following breakthroughs in specific pathogen-free (SPF) broodstock development. Indonesia and Vietnam have led tiger shrimp farming innovation, achieving survival rates above 75% in improved pond systems that were previously economically unviable.

By Form

Segment Key Metric Primary Demand Driver
Frozen 59.8% share (2025) Cold-chain maturation; IQF technology
Canned 3.95% CAGR (2026–2035) Shelf-stable convenience in emerging markets
Fresh/Chilled USD 25.68 Billion (2025) Premium dining; wet-market tradition in Asia


Frozen and fresh shrimp products together constitute the vast majority of the Shrimp Market by value. The frozen segment benefits from IQF processing advances that preserve texture and flavor, making peeled and deveined shrimp accessible year-round to retail and foodservice buyers in import-dependent regions. Canned shrimp's accelerating growth reflects expanding distribution in sub-Saharan Africa, Southeast Asia, and Latin America, where ambient-temperature storage infrastructure remains limited.

By Source

Segment Key Metric Primary Demand Driver
Farmed 55.8% share (2025) Shrimp aquaculture production intensification
Wild-Caught 3.40% CAGR (2026–2035) Premium positioning; sustainability perception


Farmed and wild-caught shrimp serve distinct market tiers within the Shrimp Market. Farmed production — led by Ecuador, India, and Vietnam — delivers the volume needed for mainstream retail and QSR applications, with shrimp aquaculture production capacity continuing to expand through both pond intensification and RAS adoption. Wild-caught shrimp maintain a pricing premium of 20–35% in European and Japanese retail, driven by consumer perception of superior taste and environmental sustainability.

By Distribution Channel

Segment Key Metric Primary Demand Driver
On-Trade 58.7% share (2025) Restaurant and hospitality sector demand
Off-Trade 2.65% CAGR (2026–2035) Retail expansion of peeled and deveined shrimp packs


On-trade channels — encompassing restaurants, hotels, and institutional catering — remain the largest route to market for the Shrimp Market. Off-trade growth is accelerating as retailers expand frozen and fresh shrimp shelf space and consumers increasingly prepare shrimp-based meals at home. The COVID-era shift to home cooking left a lasting structural uplift in retail shrimp sales, particularly for value-added formats such as pre-seasoned white and black tiger shrimp products.


Regional Market Share Analysis

Region Key Metric Primary Investment Themes
Asia-Pacific 48.4% share (2025) Shrimp aquaculture production scale-up; cold-chain expansion
North America USD 28.24 Billion (2025) Frozen and fresh shrimp imports; foodservice recovery
Europe 2.36% CAGR (2026–2035) Sustainability certification; peeled and deveined shrimp demand
South America USD 14.82 Billion (2025) Ecuador's export dominance, farmed shrimp capacity expansion
Middle East & Africa 1.85% CAGR (2026–2035) RAS investment; hospitality-driven imports
Total USD 134.67 Billion

The Shrimp Market exhibits distinct regional dynamics. Asia-Pacific dominates both production and consumption, while Europe's growth rate leads all regions. The following regional summary reflects MRFR's 2025 base-year estimates.


North America

Country Key Metric Key Driver
United States 78.3% of regional share Largest global shrimp importer; QSR menu expansion
Canada 1.52% CAGR Growing Asian-cuisine consumer base
Mexico USD 2.14 Billion Domestic wild-caught shrimp fleet and farmed output


The United States imported approximately 750,000 metric tons of shrimp in 2024, with frozen and fresh shrimp from India, Ecuador, and Indonesia accounting for over 80% of volume [15]. Anti-dumping duty reviews and NOAA Seafood Import Monitoring Program requirements continue to reshape sourcing patterns in the North American Shrimp Market. Canada's retail sector has seen strong uptake of peeled and deveined shrimp products, while Mexico's Pacific coast operations supply both domestic consumption and U.S. exports.

Europe

Country Key Metric Key Driver
Germany 1.98% CAGR Retail frozen shrimp penetration
United Kingdom 19.2% of regional share Foodservice and grocery private-label shrimp
France USD 4.18 Billion Culinary tradition; premium wild-caught preference
Italy 1.75% CAGR Mediterranean seafood culture
Spain 15.4% of regional share Gambas consumption tradition
Nordic Countries USD 2.62 Billion Sustainability-driven procurement
Russia 1.45% CAGR Import substitution and domestic aquaculture
Rest of Europe USD 3.95 Billion Emerging Eastern European demand


European Shrimp Market growth is propelled by the EU's Farm-to-Fork Strategy, which mandates traceability and sustainability standards for imported seafood [9]. The region's demand for ASC-certified farmed and wild-caught shrimp has grown 14% annually since 2021, with retailers in Germany, the Netherlands, and Scandinavia leading adoption. White and black tiger shrimp varieties from Madagascar and Bangladesh are gaining share in premium segments.

Asia-Pacific

Country Key Metric Key Driver
China 31.5% of regional share Domestic consumption and e-commerce distribution
India USD 11.89 Billion Second-largest global producer; PMMSY incentives
Japan 1.62% CAGR Premium sushi and tempura demand
South Korea USD 3.24 Billion Retail and HoReCa frozen shrimp growth
ASEAN 28.7% of regional share Vietnam, Indonesia, Thailand — major export producers
Rest of Asia-Pacific 1.38% CAGR Bangladesh and Myanmar are emerging as production


Asia-Pacific's dominance in the Shrimp Market reflects its dual role as both the largest production hub and the fastest-growing consumption base. China's shrimp aquaculture production output exceeded 1.8 million metric tons in 2024, while India exported approximately USD 5.1 billion worth of frozen and fresh shrimp [3][4]. Vietnam's Mekong Delta remains a critical source of white and black tiger shrimp, with government-backed cluster zoning policies aiming to expand certified farm area by 40% through 2028.

South America

Country Key Metric Key Driver
Brazil 42.6% of regional share Domestic aquaculture expansion in northeastern states
Argentina 1.68% CAGR Wild-caught Patagonian red shrimp exports
Rest of South America USD 3.41 Billion Ecuador's dominance; Peru and Colombia emerging


Ecuador's vertically integrated shrimp aquaculture production model — controlling genetics, farming, processing, and export logistics — has made it the world's top exporter [3]. The Shrimp Market in South America benefits from favorable climatic conditions and lower labor costs, though El Niño-related temperature fluctuations remain a risk factor for pond-based operations.

Middle East & Africa

Country Key Metric Key Driver
Saudi Arabia 34.8% of regional share National Aquaculture Strategy; RAS investment
UAE 1.92% CAGR Hospitality and tourism-driven imports
South Africa USD 0.78 Billion Wild-caught Mozambique Channel supply
Egypt 1.70% CAGR Nile Delta pond farming expansion
Rest of MEA USD 1.45 Billion Emerging import demand


The Middle East & Africa Shrimp Market is driven by Saudi Arabia's ambitious plan to build domestic shrimp aquaculture production capacity through RAS facilities along the Red Sea coast [18]. The UAE's hotel, restaurant, and catering sector consumed an estimated 38,000 metric tons of peeled and deveined shrimp in 2024. African production remains nascent, though Mozambique and Madagascar are expanding farmed and wild-caught shrimp exports to European premium channels.


Shrimp Market By Region, 2025-2035
 

Competitive Benchmarking

The Shrimp Market remains highly fragmented, with an estimated Herfindahl-Hirschman Index (HHI) below 500. The top five companies collectively account for approximately 12–16% of global revenue, reflecting a supply base dominated by thousands of small-to-medium pond operators, cooperatives, and mid-tier processors. Consolidation is accelerating through vertical integration, with leading players controlling hatchery, farming, processing, and distribution operations.

Company Est. Revenue Share Range Key Offerings Strategic Positioning
Thai Union Group ~2–4% Frozen and fresh shrimp; branded retail (Chicken of the Sea) Vertically integrated; global distribution network
Charoen Pokphand Foods (CPF) ~2–3% Farmed and wild-caught shrimp; feed supply Full value chain control; Asia-Pacific leader
Maruha Nichiro ~1–3% Premium frozen shrimp; Japanese market focus Quality-driven; sushi-grade processing
Nireus Aquaculture ~1–2% Mediterranean species; emerging shrimp lines European aquaculture specialization
Mazzetta Company ~1–2% Peeled and deveined shrimp; U.S. retail and foodservice Sourcing and import specialization
Songa Group ~1–2% White and black tiger shrimp; Mozambique operations African production; EU export certification
Clearwater Seafoods ~1–2% Wild-caught premium shrimp; Canadian operations Sustainability-certified; cold-water species
Apex Frozen Foods ~1–2% Frozen shrimp; Indian export leader Shrimp aquaculture production integration in Andhra Pradesh
Omarsa S.A. ~1–2% Ecuadorian farmed shrimp; global exports Cost leadership; scale production
Grupo Ibérica ~1–2% European-market shrimp processing Private-label supply to Western retailers


Recent News & Developments


  • SeaPak Shrimp & Seafood (February 2025): SeaPak Shrimp & Seafood introduced a new product inspired by the flavors of New Orleans, called SeaPak Classic Cajun Style Shrimp, aimed to bring the authentic taste of Cajun cuisine to consumers, offering a convenient and flavorful seafood option.
  • Prime Shrimp (February 2024): Prime Shrimp expanded its product portfolio by introducing a new Soy Ginger flavor to its frozen sauced shrimp line. This addition aimed to cater to evolving consumer preferences for diverse and convenient meal options.


Shrimp Market Report Scope

Parameter Details
Market Scope Global Shrimp Market — by Species, Form, Source, Distribution Channel, Geography
Study Period 2021–2035
CAGR Window 2026–2035 (1.42%)
Market Size (2025) USD 134.67 Billion
Market Size (2035) USD 153.82 Billion
Fastest Growing Segment Canned shrimp (by Form); Tiger Shrimp (by Species)
Fastest Growing Region Europe (2.36% CAGR)
Companies Profiled 10 (including Thai Union, CPF, Maruha Nichiro, Apex Frozen Foods, others)
Valuation Currency USD Billion


FAQs

How does the Shrimp Market's fragmented structure affect pricing stability?

Thousands of independent pond operators create a supply base where localized gluts or shortfalls quickly ripple through spot prices. Vertically integrated exporters in Ecuador and Thailand serve as price anchors, but small-farm volatility can swing regional wholesale prices 10–15% within a single season.

What practical steps should institutional buyers take to mitigate supply-chain risk in the Shrimp Market?

Diversifying sourcing across at least three origin countries and requiring ASC or BAP certification reduces exposure to single-country disease events or trade disruptions. Long-term contracts with integrated processors provide volume stability that spot purchasing cannot [9].

How do RAS-produced shrimp compare to pond-farmed shrimp on cost per kilogram?

RAS production currently costs 20–30% more per kilogram than conventional pond farming due to higher energy and infrastructure expenses. Scale-up and renewable energy integration are expected to narrow this gap to under 10% by 2030 [11].

What role does antibiotic-free certification play in Shrimp Market procurement decisions?

European and North American retailers increasingly mandate antibiotic-free documentation as a condition of supply. Producers lacking third-party verification face exclusion from premium channels, pushing compliance costs onto exporters in India and Vietnam [9].

How are carbon footprint regulations reshaping the Shrimp Market's trade patterns?

The EU's Carbon Border Adjustment Mechanism discussions now extend to imported protein, including seafood. Exporters with lower-emission production models — such as biofloc or RAS-raised shrimp — gain preferential positioning as carbon reporting requirements tighten [14].

What insurance and financing options exist for small-scale shrimp farmers entering the Shrimp Market?

Index-based crop insurance products — tied to water temperature and salinity triggers — are emerging in India and Thailand. Microfinance institutions in Vietnam and Indonesia now offer aquaculture-specific credit lines with repayment tied to harvest cycles [7].

How do white and black tiger shrimp genetics programs affect the Shrimp Market's competitive dynamics?

SPF broodstock programs have reduced tiger shrimp mortality rates from 50–60% to below 25% over the past decade. This genetic improvement narrows the cost disadvantage versus vannamei (pink) shrimp, enabling tiger shrimp to compete on quality-adjusted price in premium retail [8].


FAQs

What is the current valuation of The Global Shrimp as of 2024?

The Global Shrimp was valued at 42.7 USD Billion in 2024.

What is the projected market valuation for The Global Shrimp in 2035?

The market is projected to reach 119.44 USD Billion by 2035.

What is the expected CAGR for The Global Shrimp during the forecast period 2025 - 2035?

The expected CAGR for The Global Shrimp during 2025 - 2035 is 9.8%.

Which species of shrimp dominate the market in terms of valuation?

Penaeus vannamei leads the market with a valuation range of 20.0 to 58.0 USD Billion.

What are the key product forms in The Global Shrimp?

Key product forms include Frozen, Fresh, Canned, Cooked, and Dried shrimp, with Frozen shrimp valued between 15.0 and 42.0 USD Billion.

How does the distribution channel impact The Global Shrimp?

Supermarkets are a major distribution channel, with a valuation range of 15.0 to 42.0 USD Billion.

What are the primary uses of shrimp in the market?

The primary uses of shrimp include Food Service, Retail, and Industrial, with Retail valued between 15.78 and 44.12 USD Billion.

Who are the leading players in The Global Shrimp?

Key players include Thai Union Group, Maruha Nichiro Corporation, and Mowi ASA, among others.

What is the valuation range for Penaeus monodon in the market?

Penaeus monodon has a valuation range of 10.0 to 30.0 USD Billion.

What trends are expected to shape The Global Shrimp by 2035?

The market may experience growth driven by increasing demand and innovation in shrimp farming and distribution.
Author
Author
Author Profile
Tejas Chaudhary
Research Analyst Level II
I have a degree in Engineering (Civil), with masters in Business Administration (Marketing). With more than 4 years of experience in market research and consulting, I am involved in end-to-end process of market research, proposals, project kickoffs and delivery. I have research knowledge and expertise in consumer goods/packaging domain. Also I have worked for various other domains like construction & equipment. Effectively managed and delivered more than 60 report studies for regional as well as global clientele.

Research Approach


Secondary Research

The secondary research process involved comprehensive analysis of regulatory databases, peer-reviewed aquaculture journals, industry publications, and authoritative food & agriculture organizations. Key sources included the Food and Agriculture Organization of the United Nations (FAO) - Globefish & Fishery Statistical Collections, National Oceanic and Atmospheric Administration (NOAA) - Fisheries Statistics Division, United States Department of Agriculture (USDA) - Foreign Agricultural Service (FAS), National Marine Fisheries Service (NMFS) - Commercial Fisheries Statistics, European Commission - Directorate-General for Maritime Affairs and Fisheries (DG MARE), European Market Observatory for Fisheries and Aquaculture Products (EUMOFA), Asian Development Bank (ADB) - Aquaculture Sector Reports, Southeast Asian Fisheries Development Center (SEAFDEC), Global Aquaculture Alliance (GAA) - Best Aquaculture Practices (BAP) Certification Data, Global Seafood Alliance, National Fisheries Institute (NFI), World Aquaculture Society (WAS), International Seafood Sustainability Foundation (ISSF), Marine Stewardship Council (MSC) Certification Database, Aquaculture Stewardship Council (ASC) Certification Database, and national fisheries ministry reports from key producing markets including India (Department of Fisheries - Marine Products Export Development Authority - MPEDA), Vietnam (Directorate of Fisheries - D-Fish), Ecuador (National Chamber of Aquaculture - CNA), Thailand (Department of Fisheries), Indonesia (Ministry of Marine Affairs and Fisheries), and China (Ministry of Agriculture and Rural Affairs). These sources were used to collect production volume statistics, export/import trade data, aquaculture production trends, species distribution analysis, sustainability certification metrics, and market landscape analysis for Penaeus vannamei, Penaeus monodon, Metapenaeus ensis, and Litopenaeus setiferus species across frozen, fresh, canned, cooked, and dried product forms.


Primary Research

In order to gather both qualitative and quantitative insights, supply-side and demand-side stakeholders were interviewed during the primary research process. CEOs, VPs of Operations, directors of aquaculture farms, hatchery managers, heads of processing facilities, heads of quality assurance, and export managers from integrated seafood companies, hatcheries, feed manufacturers, processing and cold storage facilities, and shrimp aquaculture farms were examples of supply-side sources. Procurement chiefs from supermarket chains, food service distributors, restaurant chains, category managers of online retail platforms, and industrial buyers from food processing firms were examples of demand-side suppliers. In addition to gathering information on species adoption patterns, pricing dynamics, sustainability certification adoption, cold chain logistics, and import/export regulatory compliance, primary research validated market segmentation and production capacity growth timetables.

Primary Respondent Breakdown:

By Designation: C-level Primaries (32%), Director Level (30%), Others (38%)

By Region: Asia-Pacific (38%), North America (28%), Europe (22%), Rest of World (12%)


Market Size Estimation

Global market valuation was derived through production volume mapping and trade flow analysis. The methodology included:

Identification of 60+ key producers, processors, and exporters across Asia-Pacific, Latin America, North America, and Europe

Species mapping across Penaeus vannamei, Penaeus monodon, Metapenaeus ensis, and Litopenaeus setiferus production volumes

Product form analysis across frozen, fresh, canned, cooked, and dried segments with country-specific ASP calculations

Analysis of reported and modeled annual revenues specific to shrimp aquaculture and processing portfolios

Coverage of producers and processors representing 75-80% of global market share in 2024

Extrapolation using bottom-up (production volume × ASP by country/product form) and top-down (manufacturer/processor revenue validation) approaches to derive segment-specific valuations, cross-referenced with FAO trade statistics and national export databases

Download Free Sample

Kindly complete the form below to receive a free sample of this Report

Download PDF ×

We do not share your information with anyone. However, we may send you emails based on your report interest from time to time. You may contact us at any time to opt-out.