Segmentation Quick Reference
| Dimension | Sub-Segments | Dominant Segment | Fastest Growing Segment |
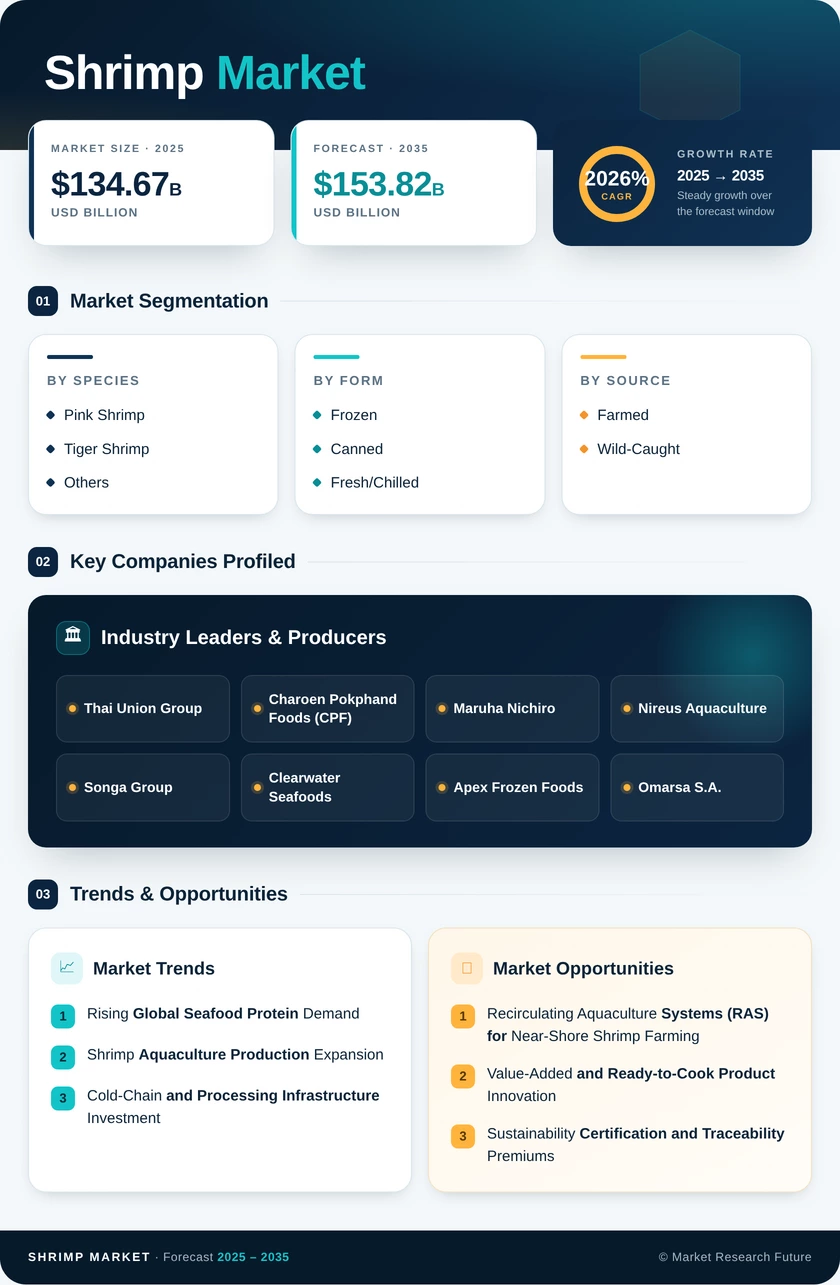
| Species | Pink Shrimp, Tiger Shrimp, Others | Pink Shrimp (42.3% share, 2025) | Tiger Shrimp (2.55% CAGR) |
| Form | Frozen, Canned, Fresh/Chilled | Frozen (59.8% share, 2025) | Canned (3.95% CAGR) |
| Source | Farmed, Wild-Caught | Farmed (55.8% share, 2025) | Wild-Caught (3.40% CAGR) |
| Distribution Channel | On-Trade, Off-Trade | On-Trade (58.7% share, 2025) | Off-Trade (2.65% CAGR) |
Market Segmentation Overview
By Species
| Sub-Segment | Key Trend |
| Pink Shrimp | Dominant globally due to established vannamei farming systems and competitive pricing across major aquaculture production regions. |
| Tiger Shrimp | Re-emerging as a premium product following SPF broodstock breakthroughs, white and black tiger shrimp are gaining traction in European and Japanese retail. |
| Others | Specialty species (e.g., rock shrimp, royal red shrimp) serve niche culinary and regional demand. |
Pink shrimp retain market leadership due to decades of genetic selection and optimized farming protocols, particularly in Ecuador, India, and China. Tiger shrimp's resurgence reflects improved disease management and growing consumer interest in larger, firmer shrimp formats for premium dining applications.
By Form
| Sub-Segment | Key Trend |
| Frozen | IQF technology and expanded cold-chain infrastructure drive dominance; peeled and deveined shrimp packs are gaining retail share. |
| Canned | Shelf-stable convenience fuels growth in emerging markets with limited refrigeration. |
| Fresh/Chilled | Premium segment driven by wet-market traditions in Asia and high-end foodservice in Europe and Japan. |
Frozen shrimp remains the backbone of international trade, with IQF processing enabling year-round retail availability. Canned shrimp's strong growth trajectory reflects unmet demand in African and Southeast Asian markets, where ambient-temperature distribution remains the primary logistics model.
By Source
| Sub-Segment | Key Trend |
| Farmed | Shrimp aquaculture production intensification continues; vertically integrated operators are expanding. |
| Wild-Caught | Premium positioning maintained; sustainability certifications increasingly required for market access. |
Farmed shrimp drives the majority of global supply, while wild-caught shrimp retain a quality-driven premium, particularly in markets where traceability and origin labeling influence purchasing decisions.
By Distribution Channel
| Sub-Segment | Key Trend |
| On-Trade | Restaurant, hotel, and institutional demand remains the largest channel. |
| Off-Trade | Retail and e-commerce expansion accelerates, driven by consumer-ready peeled and deveined shrimp formats. |
On-trade channels continue to dominate, but the structural shift toward home cooking and online grocery purchasing is steadily expanding off-trade share, particularly in North America and China.