Simulation Software Market (2026 - 2035)

ID: MRFR/ICT/4314-HCR
100 Pages
Ankit Gupta
Last Updated: July 02, 2026
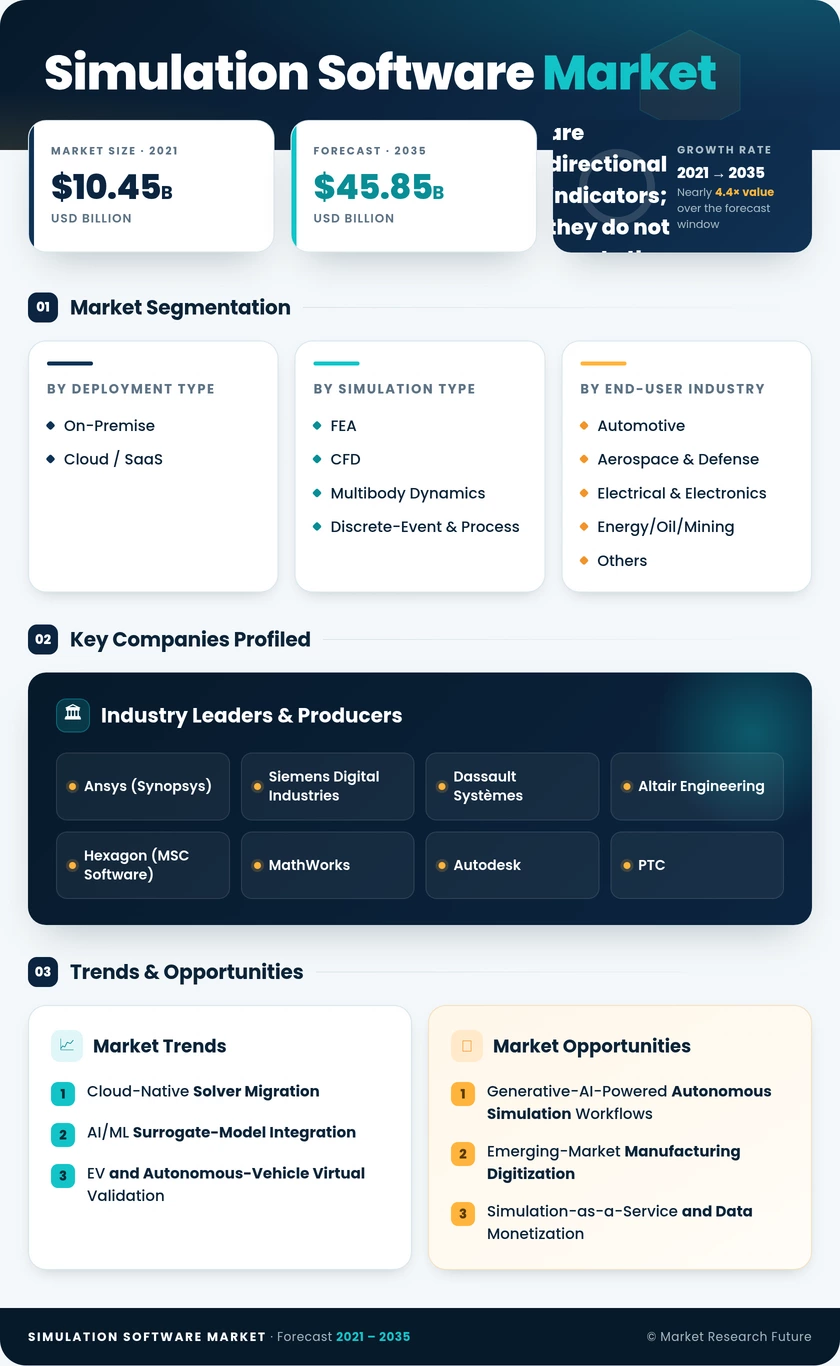
Simulation Software Market Size, Share and Research Report By Deployment Type (On-Premise, Cloud / SaaS), By Simulation Type (Finite Element Analysis (FEA), Computational Fluid Dynamics (CFD), Multibody Dynamics, Discrete-Event & Process Simulation), By End-User Industry (Automotive, Aerospace & Defense, Electrical & Electronics, Energy / Oil / Mining, Other Industries), By Application Area (Product Design & Engineering, R&D and Scientific Computing, Digital Twin Lifecycle Management), By Component (Software Licenses, Platform & Integration Services, Professional Services) and By Regional (North America, Europe, South America, Asia Pacific, Middle East and Africa) - Industry Forecast to 2035
Simulation Software Market
Market Size
Forecast Period2026-2035
CAGR (2026-2035)12.20%
2021 Market Size14.5 USD Billion
2024 Market Size16.27 USD Billion
Key Players
Ansys
Siemens Digital Industries
Dassault Systèmes
Altair Engineering
Hexagon
MathWorks
Opportunities
  • Generative-AI-Powered Autonomous Simulation Workflows
  • Emerging-Market Manufacturing Digitization
  • Simulation-as-a-Service and Data Monetization
  1. 1 Market Overview |
    1. 1.1 Study Assumptions & Market Definition |
    2. 1.2 Scope of the Study |
    3. 1.3 Research Methodology
  2. 2 Market Summary & Key Takeaways
  3. 3 Market Dynamics |
    1. 3.1 Market Drivers Analysis | |
      1. 3.1.1 Cloud-Native Solver Migration | |
      2. 3.1.2 AI/ML Surrogate-Model Integration | |
      3. 3.1.3 EV and Autonomous-Vehicle Virtual Validation | |
      4. 3.1.4 Digital Twin Lifecycle Mandates | |
      5. 3.1.5 Semiconductor Process-Node Shrinkage | |
      6. 3.1.6 Regulatory ESG/Sustainability Reporting | |
      7. 3.1.7 Defense Modernization Programs |
    2. 3.2 Market Restraints Analysis | |
      1. 3.2.1 Fragmented Data-Exchange Standards | |
      2. 3.2.2 Domain-Specific Physics Talent Scarcity | |
      3. 3.2.3 High Switching Costs from Legacy Solvers | |
      4. 3.2.4 Cybersecurity Risks in Cloud-Solver Environments | |
      5. 3.2.5 IP Protection Concerns in Multi-Tenant Clouds |
    3. 3.3 Market Opportunity Analysis | |
      1. 3.3.1 Generative-AI-Powered Autonomous Simulation Workflows | |
      2. 3.3.2 Emerging-Market Manufacturing Digitization | |
      3. 3.3.3 Simulation-as-a-Service and Data Monetization | |
      4. 3.3.4 Sustainability and Carbon-Footprint Simulation | |
      5. 3.3.5 Real-Time Digital Twin Simulation for Smart Infrastructure
  4. 4 Global Simulation Software Market Size & Forecast (2021–2035) |
    1. 4.1 Historical Market Size (2021–2025) |
    2. 4.2 Current & Forecast Market Size (2026–2035) |
    3. 4.3 Market Size by Revenue (USD Billion) |
    4. 4.4 Year-over-Year Growth Analysis
  5. 5 Segmentation Analysis |
    1. 5.1 By Deployment Type | |
      1. 5.1.1 On-Premise | |
      2. 5.1.2 Cloud / SaaS |
    2. 5.2 By Simulation Type | |
      1. 5.2.1 Finite Element Analysis (FEA) | |
      2. 5.2.2 Computational Fluid Dynamics (CFD) | |
      3. 5.2.3 Multibody Dynamics | |
      4. 5.2.4 Discrete-Event & Process Simulation |
    3. 5.3 By End-User Industry | |
      1. 5.3.1 Automotive | |
      2. 5.3.2 Aerospace & Defense | |
      3. 5.3.3 Electrical & Electronics | |
      4. 5.3.4 Energy / Oil / Mining | |
      5. 5.3.5 Other Industries |
    4. 5.4 By Application Area | |
      1. 5.4.1 Product Design & Engineering | |
      2. 5.4.2 R&D and Scientific Computing | |
      3. 5.4.3 Digital Twin Lifecycle Management |
    5. 5.5 By Component | |
      1. 5.5.1 Software Licenses | |
      2. 5.5.2 Platform & Integration Services | |
      3. 5.5.3 Professional Services
  6. 6 Regional Analysis |
    1. 6.1 North America | |
      1. 6.1.1 United States | |
      2. 6.1.2 Canada | |
      3. 6.1.3 Mexico |
    2. 6.2 Europe | |
      1. 6.2.1 Germany | |
      2. 6.2.2 United Kingdom | |
      3. 6.2.3 France | |
      4. 6.2.4 Italy | |
      5. 6.2.5 Spain | |
      6. 6.2.6 Nordic Countries | |
      7. 6.2.7 Russia | |
      8. 6.2.8 Rest of Europe |
    3. 6.3 Asia-Pacific | |
      1. 6.3.1 China | |
      2. 6.3.2 India | |
      3. 6.3.3 Japan | |
      4. 6.3.4 South Korea | |
      5. 6.3.5 ASEAN | |
      6. 6.3.6 Rest of Asia-Pacific |
    4. 6.4 South America | |
      1. 6.4.1 Brazil | |
      2. 6.4.2 Argentina | |
      3. 6.4.3 Rest of South America |
    5. 6.5 Middle East & Africa | |
      1. 6.5.1 Saudi Arabia | |
      2. 6.5.2 UAE | |
      3. 6.5.3 South Africa | |
      4. 6.5.4 Egypt | |
      5. 6.5.5 Rest of MEA
  7. 7 Competitive Landscape |
    1. 7.1 Market Share Analysis (2025) |
    2. 7.2 Competitive Benchmarking Matrix |
    3. 7.3 Company Profiles | |
      1. 7.3.1 Ansys (Synopsys) | |
      2. 7.3.2 Siemens Digital Industries | |
      3. 7.3.3 Dassault Systèmes | |
      4. 7.3.4 Altair Engineering | |
      5. 7.3.5 Hexagon (MSC Software) | |
      6. 7.3.6 MathWorks | |
      7. 7.3.7 Autodesk | |
      8. 7.3.8 PTC | |
      9. 7.3.9 Cadence Design Systems | |
      10. 7.3.10 Keysight Technologies
  8. 8 Future Outlook & Strategic Recommendations (2026–2035) |
    1. 8.1 AI-Autonomous Simulation and Self-Optimizing Design Loops |
    2. 8.2 Platform Consolidation and Ecosystem Lock-In |
    3. 8.3 Electrification and Energy-Transition Simulation Supercycle |
    4. 8.4 Regulatory-Driven Digital Twin Simulation Mandates
  9. 9 Recent Developments & News
  10. 10 Frequently Asked Questions (FAQs)
  11. 11 Report Scope & Methodology |
    1. 11.1 Study Period & Base Year |
    2. 11.2 Data Sources & Citations |
    3. 11.3 Abbreviations
  12. 12 LIST OF TABLES |
  13. TABLE 1 Global Simulation Software Market Size & Forecast, by Revenue (USD Billion), 2021–2035 |
  14. TABLE 2 Global Simulation Software Market — Year-over-Year Growth Analysis, 2021–2035 |
  15. TABLE 3 Driver Impact Analysis — Simulation Software Market, 2026–2035 |
  16. TABLE 4 Restraint Impact Analysis — Simulation Software Market, 2026–2035 |
  17. TABLE 5 Regional Summary — Simulation Software Market, 2025 |
  18. TABLE 6 North America Simulation Software Market Size, by Country, 2021–2035 (USD Billion) |
  19. TABLE 7 Europe Simulation Software Market Size, by Country, 2021–2035 (USD Billion) |
  20. TABLE 8 Asia-Pacific Simulation Software Market Size, by Country, 2021–2035 (USD Billion) |
  21. TABLE 9 South America Simulation Software Market Size, by Country, 2021–2035 (USD Billion) |
  22. TABLE 10 Middle East & Africa Simulation Software Market Size, by Country, 2021–2035 (USD Billion) |
  23. TABLE 11 Global Simulation Software Market Size, by Deployment Type, 2021–2035 (USD Billion) |
  24. TABLE 12 Global Simulation Software Market Size, by Simulation Type, 2021–2035 (USD Billion) |
  25. TABLE 13 Global Simulation Software Market Size, by End-User Industry, 2021–2035 (USD Billion) |
  26. TABLE 14 Global Simulation Software Market Size, by Application Area, 2021–2035 (USD Billion) |
  27. TABLE 15 Global Simulation Software Market Size, by Component, 2021–2035 (USD Billion) |
  28. TABLE 16 Competitive Benchmarking Matrix — Simulation Software Market, 2025 |
  29. TABLE 17 Company Profiles — Key Players, Simulation Software Market |
  30. TABLE 18 Recent Developments & Strategic Announcements, 2023–2025 |
  31. TABLE 19 North America Simulation Software Market Size, by Deployment Type, 2021–2035 (USD Billion) |
  32. TABLE 20 North America Simulation Software Market Size, by Simulation Type, 2021–2035 (USD Billion) |
  33. TABLE 21 North America Simulation Software Market Size, by End-User Industry, 2021–2035 (USD Billion) |
  34. TABLE 22 North America Simulation Software Market Size, by Application Area, 2021–2035 (USD Billion) |
  35. TABLE 23 North America Simulation Software Market Size, by Component, 2021–2035 (USD Billion) |
  36. TABLE 24 Europe Simulation Software Market Size, by Deployment Type, 2021–2035 (USD Billion) |
  37. TABLE 25 Europe Simulation Software Market Size, by Simulation Type, 2021–2035 (USD Billion) |
  38. TABLE 26 Europe Simulation Software Market Size, by End-User Industry, 2021–2035 (USD Billion) |
  39. TABLE 27 Europe Simulation Software Market Size, by Application Area, 2021–2035 (USD Billion) |
  40. TABLE 28 Europe Simulation Software Market Size, by Component, 2021–2035 (USD Billion) |
  41. TABLE 29 Asia-Pacific Simulation Software Market Size, by Deployment Type, 2021–2035 (USD Billion) |
  42. TABLE 30 Asia-Pacific Simulation Software Market Size, by Simulation Type, 2021–2035 (USD Billion) |
  43. TABLE 31 Asia-Pacific Simulation Software Market Size, by End-User Industry, 2021–2035 (USD Billion) |
  44. TABLE 32 Asia-Pacific Simulation Software Market Size, by Application Area, 2021–2035 (USD Billion) |
  45. TABLE 33 Asia-Pacific Simulation Software Market Size, by Component, 2021–2035 (USD Billion) |
  46. TABLE 34 South America Simulation Software Market Size, by Deployment Type, 2021–2035 (USD Billion) |
  47. TABLE 35 South America Simulation Software Market Size, by Simulation Type, 2021–2035 (USD Billion) |
  48. TABLE 36 South America Simulation Software Market Size, by End-User Industry, 2021–2035 (USD Billion) |
  49. TABLE 37 South America Simulation Software Market Size, by Application Area, 2021–2035 (USD Billion) |
  50. TABLE 38 South America Simulation Software Market Size, by Component, 2021–2035 (USD Billion) |
  51. TABLE 39 Middle East & Africa Simulation Software Market Size, by Deployment Type, 2021–2035 (USD Billion) |
  52. TABLE 40 Middle East & Africa Simulation Software Market Size, by Simulation Type, 2021–2035 (USD Billion) |
  53. TABLE 41 Middle East & Africa Simulation Software Market Size, by End-User Industry, 2021–2035 (USD Billion) |
  54. TABLE 42 Middle East & Africa Simulation Software Market Size, by Application Area, 2021–2035 (USD Billion) |
  55. TABLE 43 Middle East & Africa Simulation Software Market Size, by Component, 2021–2035 (USD Billion)
  56. 13 LIST OF FIGURES |
  57. FIGURE 1 Simulation Software Market Dynamics — Drivers, Restraints & Opportunities |
  58. FIGURE 2 Value Chain Analysis — Simulation Software Market |
  59. FIGURE 3 Porter's Five Forces Analysis — Simulation Software Market |
  60. FIGURE 4 Global Simulation Software Market Size Trend (USD Billion), 2021–2035 |
  61. FIGURE 5 Simulation Software Market Share, by Deployment Type, 2025 |
  62. FIGURE 6 Simulation Software Market Share, by Simulation Type, 2025 |
  63. FIGURE 7 Simulation Software Market Share, by End-User Industry, 2025 |
  64. FIGURE 8 Simulation Software Market Share, by Application Area, 2025 |
  65. FIGURE 9 Simulation Software Market Share, by Component, 2025 |
  66. FIGURE 10 Simulation Software Market Share, by Region, 2025 |
  67. FIGURE 11 North America Simulation Software Market Size Trend, 2021–2035 |
  68. FIGURE 12 Europe Simulation Software Market Size Trend, 2021–2035 |
  69. FIGURE 13 Asia-Pacific Simulation Software Market Size Trend, 2021–2035 |
  70. FIGURE 14 South America Simulation Software Market Size Trend, 2021–2035 |
  71. FIGURE 15 Middle East & Africa Simulation Software Market Size Trend, 2021–2035 |
  72. FIGURE 16 Competitive Landscape — Market Share Analysis, 2025

Segmentation Quick Reference

DimensionSub-SegmentsDominant SegmentFastest Growing Segment
Deployment TypeOn-Premise; Cloud / SaaSOn-Premise (55.3% share)Cloud / SaaS (14.30% CAGR)
Simulation TypeFEA; CFD; Multibody Dynamics; Discrete-Event & ProcessCFD (29.8% share)Discrete-Event & Process (15.10% CAGR)
End-User IndustryAutomotive; Aerospace & Defense; Electrical & Electronics; Energy/Oil/Mining; OthersAutomotive (30.5% share)Electrical & Electronics (13.20% CAGR)
Application AreaProduct Design & Engineering; R&D & Scientific Computing; Digital Twin Lifecycle MgmtProduct Design & Engineering (38.0% share)Digital Twin Lifecycle Mgmt (15.00% CAGR)
ComponentSimulation Software Market Licenses; Platform & Integration Services; Simulation Software MarketSimulation Software Market Licenses (50.3% share)Platform & Integration Services (14.90% CAGR)


Market Segmentation Overview

By Deployment Type

Sub-SegmentKey Trend
On-PremisePersists in defense and regulated verticals; declining share as cloud adoption accelerates.
Cloud / SaaSPay-as-you-go burst-compute models are attracting mid-market manufacturers and SMEs


On-premise deployments continue to serve organizations bound by ITAR, EAR, and sovereign data-residency mandates, while cloud and SaaS configurations are emerging as the default choice for new simulation workloads, particularly in automotive and consumer-electronics R&D.

By Simulation Type

Sub-SegmentKey Trend
Finite Element Analysis (FEA)Backbone of structural and thermal validation; expanding into additive-manufacturing simulation
Computational Fluid Dynamics (CFD)High-fidelity LES and DES methods driving compute-per-job increases
Multibody DynamicsRobotics and vehicle-dynamics coupling with real-time control co-simulation
Discrete-Event & Process SimulationSupply-chain and logistics digital twin deployments are accelerating post-pandemic


CFD and FEA collectively account for over half of total solver-license revenue, while discrete-event simulation is gaining traction as manufacturers model entire factory and logistics networks digitally.

By End-User Industry

Sub-SegmentKey Trend
AutomotiveEV platform design and autonomous-vehicle virtual validation driving double-digit growth
Aerospace & DefenseMission-level simulation and digital-thread integration across prime contractors
Electrical & ElectronicsSemiconductor thermal management and 5G antenna modeling
Energy / Oil / MiningReservoir modeling, turbine optimization, and grid-stability analysis
Other IndustriesHealthcare computational modeling, construction BIM simulation and consumer goods


Automotive and aerospace remain the two largest verticals, together representing over half of global demand, while electronics and healthcare are the fastest-expanding end users.

By Application Area

Sub-SegmentKey Trend
Product Design & EngineeringShift-left simulation integrated at the concept-design phase
R&D & Scientific ComputingHPC-driven drug discovery and materials science
Digital Twin Lifecycle ManagementContinuous operational simulation from commissioning through decommissioning


Product design and engineering continue to absorb the majority of simulation spending, but digital twin lifecycle management is closing the gap as enterprises pursue real-time operational optimization.

By Component

Sub-SegmentKey Trend
Simulation Software Market LicensesTransition from perpetual to subscription-based revenue models
Platform & Integration ServicesEcosystem orchestration and workflow-automation platforms
Simulation Software MarketConsulting, managed simulation operations, and training academies


Simulation Software Market licenses remain the revenue core, though platform and integration services are the fastest-growing component as vendors shift toward ecosystem-centric business models.


 

Download PDF ×

We do not share your information with anyone. However, we may send you emails based on your report interest from time to time. You may contact us at any time to opt-out.