Single-use Assemblies Market (2026 - 2035)

Single-Use Assemblies Market Research Report: Size, Share, Trend Analysis By Applications (Biopharmaceutical Manufacturing, Vaccination, Cell Culture, Tissue Engineering), By Component Type (Bag Systems, Filters, Connectors, Tubing), By Material Type (Polyethylene, Polypropylene, Polyvinyl Chloride, Thermoplastic Elastomers), By End Users (Pharmaceutical Companies, Contract Manufacturing Organizations, Research Laboratories) and By Regional (North America, Europe, South America, Asia Pacific, Middle East and Africa) - Growth Outlook & Industry Forecast 2025 To 2035

Forecast Period
2026-2035
CAGR
30.1%
2025 Market Size
USD 1.98 Billion
2035 Market Size
USD 27.55 Billion
Healthcare ● Updated August 24, 2026 Report ID: MRFR/HC/19931-HCR | Pages: 128 | Author: Nidhi Mandole, Rahul Gotadki

Single-use Assemblies Market Summary

The Single-use Assemblies Market was valued at USD 1.98 billion in 2025 and opens the forecast window at USD 2.58 billion in 2026, climbing to USD 27.55 billion by 2035 at a 30.1% CAGR. Two catalysts explain the steepness of that curve. The US Biomedical Advanced Research and Development Authority has committed more than USD 1.4 billion since 2023 to domestic biologics and vaccine surge capacity, nearly all of it specified around closed, disposable fluid paths [1]. Europe's HERA framework adds a parallel pull, reserving flexible manufacturing capacity that only pre-sterilized, plug-and-play assemblies can deliver on short notice [2].

Stainless-steel pipes, clean-in-place skids and certified steam-in-place loops are being decommissioned at a pace faster than most capital plans anticipated. Instead, they use pre-assembled and gamma-irradiated fluid circuits which are certified and discarded after one batch. Sartorius, Cytiva and Thermo Fisher have each invested more than USD 2.6 billion in assembly and polymer-conversion capacity since 2022, a hint that the Single-use Assemblies Market is now considered fundamental infrastructure, not consumable spend [3][4].


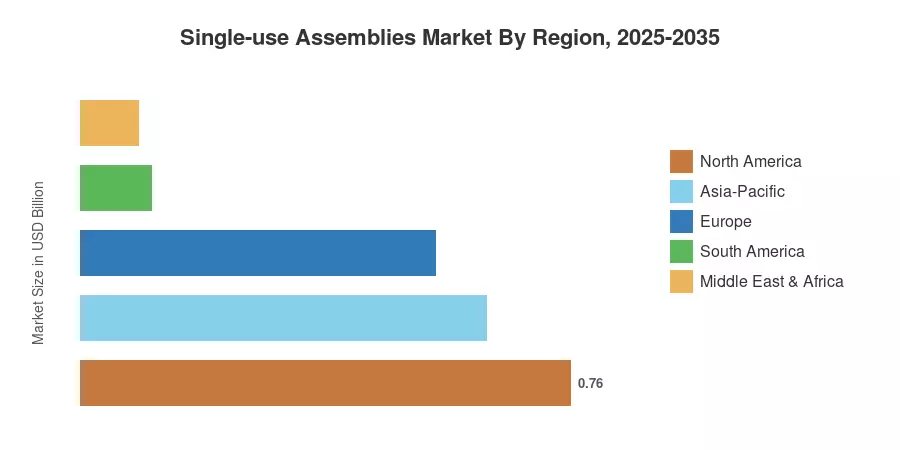
North America accounted for 38.6% of 2025 revenue, fueled by its cell and gene therapy program. Geographically, Asia-Pacific is anticipated to compound at 31.6% through 2035. Europe is second at 27.8% with Ireland, Switzerland and Germany the leaders. Single-use Assemblies Market Momentum to be Driven by Polymer and Irradiation Capacity Keeping Up with Demand


Key Report Takeaways

• By Technology (Product)

  • Filtration assemblies commanded 29.9% of Single-use Assemblies Market share in 2025, reflecting entrenched use in clarification and sterile filtration duty.
  • Bag assemblies are the fastest-expanding product line at a 31.5% CAGR through 2035
  • Mixing system assemblies generated USD 0.29 billion in 2025 as buffer prep shifts off stainless.

• By Sector (Application & End User)

  • Biopharmaceutical and pharmaceutical companies accounted for 51.2% of Single-use Assemblies Market demand in 2025
  • CMOs and CROs post the steepest end-user CAGR at 32.0%, tracking outsourced capacity growth.
  • Standard solutions delivered 59.5% of 2025 revenue, though customized configurations grow faster.

• By Geography

  • North America led with 38.6% revenue share in 2025
  • Asia-Pacific advances at 31.6% CAGR, the fastest of any region
  • Europe contributed USD 0.55 billion in 2025


Market Size and Forecast (2021–2035)

Historical values were reconstructed from audited segment disclosures in annual reports of bioprocessing suppliers, customs-level trade statistics on polymer film and tubing, and installed-base surveys of single-use bioreactor components at 340 licensed facilities. Forecast years are bottom-up builds from batch quantities and per-batch assembly usage, cross-validated against announced capital expansion. The values represent the Single-use Assemblies Market in USD billion.
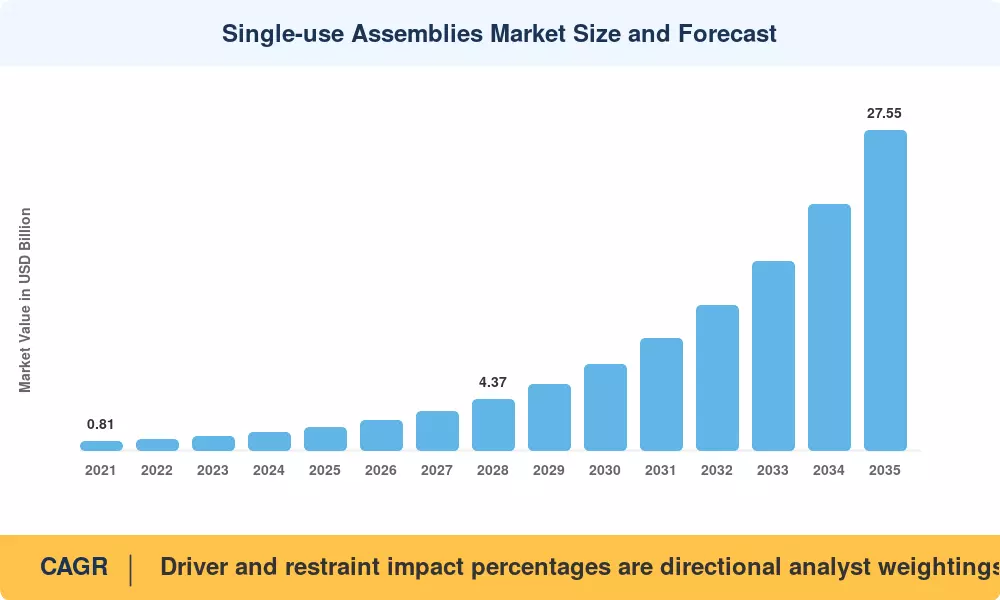
Single-use Assemblies Market Size and Forecast
Our Impact
Enabled $4.3B Revenue Impact for Fortune 500 and Leading Multinationals
Partnering with 2000+ Global Organizations Each Year
30K+ Citations by Top-Tier Firms in the Industry

Driver Impact Analysis

Driver ~% Impact on CAGR Geographic Relevance Impact Timeline
Cell and gene therapy commercialization 7.8 North America, Europe Medium-term (2–4 yr)
Government biomanufacturing sovereignty funding 6.4 US, EU, India, Japan Short-term (≤2 yr)
CDMO capacity buildout 5.9 Asia-Pacific, Ireland Medium-term (2–4 yr)
Facility conversion economics vs. stainless steel 5.1 Global Long-term (≥4 yr)
mRNA and nucleic-acid platform scale-up 4.3 US, EU, South Korea Short-term (≤2 yr)
Regulatory endorsement of closed processing 3.6 Global Long-term (≥4 yr)
Biosimilar wave and cost pressure 2.7 Europe, India, China Long-term (≥4 yr)


Cell and Gene Therapy Commercialization

Approvals reshaped demand structure. The FDA cleared a record number of cell and gene therapy products through 2024 and has publicly projected 10–20 annual approvals by 2027 [6]. Each autologous process runs at 1–50 litre scale with dozens of aseptic connections per batch, which makes disposable circuits the only economically rational choice. Facilities running 500 patient batches a year consume assembly volumes that would have been unthinkable in a 2,000-litre stainless plant. That consumption profile lifts unit demand in the Single-use Assemblies Market well ahead of revenue from traditional monoclonal antibody production.

Biomanufacturing Sovereignty Funding

Public money is rewriting siting decisions. India's Production Linked Incentive scheme for pharmaceuticals allocated roughly USD 2.0 billion across 55 approved projects, with bioprocessing consumables explicitly eligible for localization credit [12]. Japan's Ministry of Health committed JPY 155 billion to domestic vaccine plants under its 2023 preparedness plan [13]. Both programs favor modular facilities that reach GMP readiness in 18 months rather than 48.

CDMO Capacity Buildout

Outsourcing keeps compounding. Contract manufacturers added an estimated 1.9 million litres of installed bioreactor capacity between 2022 and 2025, with over 60% of new lines specified as single-use from the outset. Multi-product CDMO suites cannot economically justify dedicated stainless trains, so changeover speed becomes the purchasing criterion. Assemblies that eliminate cleaning validation cut turnaround from nine days to under two.

Facility Conversion Economics

Capital math favors disposability at mid scale. Peer-reviewed cost modeling puts greenfield capex for a 2,000-litre single-use facility at 40–45% below a comparable stainless installation, with water-for-injection demand falling by as much as 87% [8]. Operating savings persist where product changeovers exceed six per year.


Restraints Impact Analysis

Restraint weightings represent directional drag on growth. They are analyst estimates of suppressed demand within the Single-use Assemblies Market and should not be subtracted from the headline CAGR.

Restraint ~% Drag on CAGR Geographic Relevance Impact Timeline
Gamma irradiation capacity constraints -4.2 Global Short-term (≤2 yr)
Extractables and leachables qualification burden -3.4 US, EU Medium-term (2–4 yr)
Medical-grade polymer resin supply concentration -2.9 Global Medium-term (2–4 yr)
Plastic waste and ESG scrutiny -2.1 Europe Long-term (≥4 yr)
Unfavorable economics above 5,000 litres -1.8 China, India Long-term (≥4 yr)


Sterilization Bottlenecks

Irradiation is the industry's narrowest pipe. Global cobalt-60 supply grows at roughly 3% annually against consumables demand rising ten times faster, and the International Atomic Energy Agency has flagged reactor refurbishment schedules as a medium-term risk to isotope availability [14]. Lead times for gamma slots stretched to 12 weeks during 2024 peaks. X-ray and e-beam alternatives are scaling, but each requires fresh material compatibility studies.

Extractables and Leachables Qualification

Documentation costs bite hardest for smaller developers. A single multi-polymer assembly can require extractables testing across four solvent systems, and USP <665> compliance has pushed qualification packages toward USD 80,000–150,000 per novel configuration [10]. Custom designs therefore carry a hidden validation tax that slows adoption.

Polymer Supply Concentration

Film availability remains fragile. Fewer than eight suppliers globally produce validated multilayer bioprocess film, and a single resin grade change can invalidate years of compatibility data [15]. Buyers increasingly demand dual-sourced film specifications written into supply agreements.


Single-use Assemblies Market Opportunities

Standardized Assembly Catalogs

Pre-validated catalog designs collapse the qualification burden described in. BioPhorum's standardization workstream has published component templates that suppliers are converting into off-the-shelf SKUs, cutting delivery from 14 weeks to under four [17]. Vendors that lead catalog adoption capture a disproportionate share of first-fit specification.

Emerging-Market Localization

India, Brazil, and Indonesia represent the clearest geographic gap. Local biosimilar producers currently import over 80% of sterile single-use tubing sets, exposing them to currency and lead-time risk [12]. Regional conversion plants qualified to ISO 13485 would unlock demand that import duties currently suppress.

Digital Traceability and Data Services

Serialized assemblies create a monetizable data layer. RFID-tagged circuits linked to batch records let suppliers sell consumption analytics, predictive reorder services, and deviation forensics as subscription products. Early pilots at European CDMOs cut unplanned stockouts by roughly 30% [18].

Continuous and Intensified Processing

Perfusion runs consume assemblies continuously rather than per batch. Intensified upstream processes raise assembly consumption per gram of product by an estimated 2.4 times versus fed-batch, expanding the addressable Single-use Assemblies Market without requiring new facilities [19].

Circularity and Recovery Programs

Take-back schemes answer the ESG restraint. Pilot polymer recovery programs in Denmark and Ireland now divert validated waste streams into non-pharma resin markets, and EU packaging directives make such schemes a procurement differentiator by 2030 [16].


Single-use Assemblies Market Future Outlook

Automation and Closed Robotics

Robotic aseptic handling will move from novelty to specification. Isolator-integrated robotic arms already perform tube welding and sampling in pilot suites, and the ISPE estimates automation can remove 60–70% of human interventions from a typical upstream train [25]. Assemblies will be redesigned around machine-graspable connectors rather than human hands.

Platform Economics and Supplier Lock-In

Selecting an assembly platform increasingly locks a facility in for a decade. Requalifying a validated fluid path costs six figures, so suppliers compete hardest at the facility design stage. Expect the Single-use Assemblies Market to consolidate around three or four dominant connector and film ecosystems by 2030.

Distributed and Point-of-Care Manufacturing

Bedside manufacturing shifts the demand curve outward. Hospital-based CAR-T production is under active regulatory review in the EU and US, and each site would require fully closed, operator-independent kits rather than cleanroom-dependent workflows [26]. Volumes per site are small; site counts are potentially in the thousands.

Sustainability Reporting

Scope 3 disclosure will reprice disposability. Under CSRD, large EU manufacturers must report upstream emissions from consumables beginning with 2025 financial years, and life-cycle studies show single-use trains cut water and energy footprints by 30–40% even after accounting for polymer waste [16]. That evidence base blunts the sustainability objection.


Single-use Assemblies Market Segmentation

By Product

Product structure in the Single-use Assemblies Market follows the physical sequence of a biologics train.

Segment Metric Primary Demand Driver
Filtration Assemblies 29.9% share (2025) Sterile filtration and clarification duty
Bag Assemblies 31.5% CAGR (2026–2035) Buffer hold and intermediate storage
Mixing System Assemblies USD 0.29 billion (2025) Buffer and media preparation
Bottle Assemblies 18.1% share (2025) Sampling and small-volume transfer
Other Assemblies 29.6% CAGR (2026–2035) Transfer lines, manifolds, connectors


Filtration leads because every process step touches a filter, and sterilizing-grade capsules are consumed at high frequency regardless of scale. Bag assemblies grow faster for a different reason: 2D and 3D bag formats are displacing stainless hold vessels across buffer, media, and harvest duty simultaneously, and each conversion replaces one tank with several disposable units.

By Application

Application mix in the Single-use Assemblies Market reveals where conversion is furthest along.

Segment Metric Primary Demand Driver
Filtration 23.4% share (2025) Highest per-batch consumption intensity
Cell Culture & Mixing 31.7% CAGR (2026–2035) Perfusion and intensified upstream
Storage & Transport USD 0.44 billion (2025) Cold-chain intermediate shipping
Sampling 20.5% share (2025) Closed-system in-process control
Fill-Finish 29.4% CAGR (2026–2035) Annex 1 contamination control


Cell culture and mixing accelerate fastest because perfusion processes consume media continuously across 30–60 day campaigns. Filtration retains the larger installed share, though its growth is steadier — the duty is mature, and conversion is largely complete at commercial scale.

By Solution and End User

Buyer structure explains pricing behavior across the Single-use Assemblies Market.

Segment Metric Primary Demand Driver
Standard Solutions 59.5% share (2025) Short lead times, catalog availability
Customized Solutions 30.7% CAGR (2026–2035) Process-specific fluid path geometry
Biopharmaceutical & Pharmaceutical Companies 51.2% share (2025) Commercial-scale biologics portfolios
CMOs / CROs 32.0% CAGR (2026–2035) Multi-product suite changeover speed
Academic & Research Institutes USD 0.16 billion (2025) Translational ATMP research


Standard configurations dominate revenue because procurement teams prize the four-week lead time that catalog SKUs deliver. Customized designs nonetheless grow faster, driven by novel modalities whose fluid paths have no catalog equivalent. CMOs represent the sharpest end-user growth, since every additional client program multiplies changeover events.


Regional Market Share Analysis

Region Metric (2025) Primary Investment Themes
North America 38.6% share Cell/gene therapy suites, BARDA surge capacity
Europe USD 0.55 billion HERA reserved capacity, biosimilar scale-up
Asia-Pacific 31.6% CAGR (2026–2035) CDMO buildout, PLI localization
South America USD 0.11 billion Vaccine self-sufficiency programs
Middle East & Africa 4.7% share Sovereign biotech funds, fill-finish plants
Total USD 1.98 billion

Regional structure in the Single-use Assemblies Market reflects where biologics licensure and public capacity funding concentrate.


North America

Country Metric Key Driver
US 78.0% of regional revenue Highest density of licensed cell therapy suites
Canada USD 0.09 billion Biomanufacturing Strategy grants
Mexico 30.4% CAGR Nearshored fill-finish capacity


Federal procurement anchors the North American Single-use Assemblies Market. The Department of Health and Human Services structured its 2024 domestic manufacturing awards around rapid-deployment suites, and recipients must demonstrate 90-day product changeover — a specification stainless facilities cannot meet [1]. Canada's Strategic Innovation Fund committed CAD 1.1 billion to biomanufacturing between 2021 and 2025, seeding Montreal and Toronto clusters [20].

Europe

Country Metric Key Driver
Germany 26.0% of regional revenue Supplier manufacturing base
UK 29.8% CAGR Cell and Gene Therapy Catapult pipeline
France USD 0.08 billion France 2030 health sovereignty plan
Italy 9.5% of regional revenue Biosimilar contract capacity
Spain 30.9% CAGR ATMP academic manufacturing
Nordic Countries USD 0.05 billion Danish and Swedish CDMO expansion
Russia 3.1% of regional revenue Domestic vaccine substitution
Rest of Europe 27.6% CAGR Irish and Swiss multinational sites


Ireland and Switzerland punch far above population weight because multinational filling and drug-substance sites cluster there under favorable tax and regulatory regimes. France 2030 earmarked EUR 7.5 billion for health innovation, with biomanufacturing modernization named as a priority axis [21]. EU GMP Annex 1, effective from August 2023, tightened contamination control expectations and effectively rewards closed-system designs [10].

Asia-Pacific

Country Metric Key Driver
China 31.0% of regional revenue Domestic biologics and CDMO scale
India 34.2% CAGR PLI scheme and biosimilar exports
Japan USD 0.09 billion Vaccine preparedness investment
South Korea 13.0% of regional revenue Songdo contract manufacturing cluster
ASEAN 32.8% CAGR Singapore and Malaysia fill-finish
Rest of Asia-Pacific USD 0.03 billion Australian ATMP research capacity


Asia-Pacific delivers the fastest expansion in the Single-use Assemblies Market, and South Korea illustrates why. Samsung Biologics brought Plant 5 online in 2025, adding 180,000 litres and pushing the Songdo campus past 780,000 litres of installed capacity [22]. India's biosimilar exporters, meanwhile, are converting legacy stainless lines rather than building greenfield, which front-loads assembly demand into 2026–2029.

South America

Country Metric Key Driver
Brazil 58.0% of regional revenue Fiocruz and Butantan vaccine programs
Argentina 29.7% CAGR mAb production for regional supply
Rest of South America USD 0.02 billion Chilean and Colombian import demand


Brazil dominates through public institutes rather than private CDMOs. Fiocruz's Bio-Manguinhos expansion, funded at roughly BRL 2.0 billion, targets domestic production of viral vector vaccines using disposable trains to avoid long validation timelines [23]. Import tariffs on finished assemblies still add 14–18% to landed cost, which is why regional conversion is under active discussion.

Middle East & Africa

Country Metric Key Driver
Saudi Arabia 32.1% CAGR Vision 2030 localization targets
UAE 19.0% of regional revenue Free-zone biologics plants
South Africa USD 0.012 billion Afrigen mRNA technology transfer hub
Egypt 30.5% CAGR Vacsera capacity modernization
Rest of MEA 21.0% of regional revenue Distributed fill-finish investment


Africa's mRNA technology transfer hub in Cape Town changed the regional trajectory. Backed by WHO and roughly USD 117 million in donor commitments, Afrigen selected fully disposable platforms precisely because they compress the path to GMP readiness [24]. Gulf states are funding parallel capacity through sovereign vehicles, though skilled operator supply remains the binding constraint.


Single-use Assemblies Market By Region, 2025-2035

Competitive Benchmarking

Concentration is in the moderate band. The HHI for the Single-use Assemblies Market is expected to be between 900 and 1,100, with the top five vendors contributing 55–60% of the income. Below that level, the sector swiftly breaks up into regional switchers and specialist component producers, many of them supplying the giants on a private-label basis. The distinguishing competitive move of this cycle is vertical integration into film extrusion and connector molding.

Company Est. Revenue Share Range Key Offerings for Single-use Assemblies Market Strategic Positioning
Sartorius AG ~14–17% Flexboy/Flexel bags, Sartopore filtration, custom fluid paths Broadest integrated portfolio; heavy capacity investment
Thermo Fisher Scientific ~12–15% BioProcess Containers, Nunc systems, aseptic connectors Scale and global logistics footprint
Danaher (Cytiva / Pall) ~11–14% ReadyToProcess, Allegro, Kleenpak sterile connectors Deep installed base in mAb manufacturing
Merck KGaA ~8–11% Mobius assemblies, Millipak filters, Lynx connectors Strong regulatory support services
Saint-Gobain Life Sciences ~6–8% C-Flex tubing, Pure-Fit connectors, custom assemblies Polymer science leadership, OEM supplier
Repligen ~4–6% XCell ATF consumables, TangenX flat sheet, flow paths Focused on intensified and perfusion processes
Avantor ~3–5% Masterflex tubing, custom single-use kits Distribution reach plus in-house manufacturing
Corning Life Sciences ~2–4% Ascent FBR consumables, vessel assemblies Adherent cell culture specialization
Entegris ~2–4% Bioprocess containers, fluid handling components Materials engineering crossover from semiconductors
Parker Hannifin ~2–3% SciLog sensors, filtration and single-use flow assemblies Instrumentation-integrated fluid paths
Meissner Filtration Products ~1–3% TepoFlex bags, custom filtration assemblies Rapid-turnaround custom fabrication
CPC (Dover) ~1–3% AseptiQuik and MicroCNX genderless connectors De facto connector standard across suppliers


Recent News & Developments


  • Thermo Fisher Scientific (June 2023): Commissioned a single-use technologies facility in Ogden, Utah, expanding container and assembly output [27]
  • European Commission (August 2023): EU GMP Annex 1 came into force, elevating contamination control strategy requirements and favoring closed processing [10]
  • Repligen (January 2025): Acquired flow-path and filtration assets to broaden its perfusion consumables franchise [28]
  • USP (May 2024): Advanced implementation guidance for General Chapter <665> on polymeric components, clarifying extractables expectations [10]
  • Samsung Biologics (April 2025): Brought Plant 5 online at Songdo, adding 180,000 litres of largely single-use-enabled capacity [22]
  • Government of India (November 2023): Expanded PLI disbursements to bioprocessing consumables manufacturers under the pharmaceuticals scheme [12]
  • FDA (December 2024): FDA finalized the Advanced Manufacturing Technologies Designation Program, granting priority regulatory engagement to adopters of single-use and other advanced platforms
  • Novo Holdings (May 2024): Novo Holdings closed its acquisition of Single Use Support, expanding its presence in cryogenic fluid-management solutions


Single-use Assemblies Market Report Scope

Parameter Detail
Market Scope Global Single-use Assemblies Market by product, application, solution, end user, and geography
Study Period 2021–2035 (Historical 2021–2024; Base Year 2025; Forecast 2026–2035)
CAGR 30.1% (2026–2035)
Market Size Checkpoints USD 1.98 billion (2025); USD 2.58 billion (2026); USD 27.55 billion (2035)
Fastest Growing Segments Bag assemblies (product); cell culture & mixing (application); CMOs/CROs (end user); Asia-Pacific (geography)
Companies Profiled 12 major suppliers including Sartorius, Thermo Fisher Scientific, Danaher/Cytiva, Merck KGaA, Saint-Gobain, Repligen, Avantor, Corning, Entegris, Parker Hannifin, Meissner, CPC
Valuation Currency USD billion, constant 2025 dollars
CAGR Driver Disclaimer Driver and restraint impact percentages are directional analyst weightings and are not additive to the headline CAGR.

FAQs

How should a buyer structure dual sourcing in the Single-use Assemblies Market without duplicating validation costs?
Specify film and connector standards rather than supplier part numbers, then qualify two converters against the same specification. Shared extractables data packages under BioPhorum templates cut the second qualification by roughly half [17].
What contract terms matter most when negotiating assembly supply agreements?
Lock committed irradiation slot allocation, resin change notification periods of at least 12 months, and price adjustment caps tied to a published polymer index. Change control clauses matter more than unit price [15].
Is gamma sterilization or X-ray the safer specification choice for new programs?
X-ray offers better dose uniformity and avoids cobalt-60 supply risk, but requires fresh material compatibility data. Programs starting after 2026 should validate both modalities in parallel [14].
Which insurance and business-continuity risks are specific to the Single-use Assemblies Market?
Single-site converter dependency is the dominant exposure. Facility interruption at one plant can idle multiple client programs, so contingent business interruption coverage should reference named supplier sites [15].
How do procurement teams evaluate total cost beyond unit price?
Include cleaning validation avoided, water-for-injection reduction, changeover labor, waste disposal, and qualification amortization. Studies place non-price factors at 35–45% of true lifetime cost [8].
What integration problems arise when retrofitting single-use trains into legacy stainless plants?
Floor loading, hoist access, and existing utility routing rarely suit mobile totes. Retrofit projects commonly overrun on facility modification rather than equipment [7].
Where is talent scarcity most acute across the Single-use Assemblies Market?
Aseptic connection technique and closed-system troubleshooting are the scarcest skills, particularly across Gulf states and Southeast Asia. Supplier-led operator certification programs are becoming a purchase criterion [24].      
Author
Author
Author Profile
Nidhi Mandole LinkedIn
Senior Research Analyst
She is an extremely curious individual currently working in Healthcare and Medical Devices Domain. Nidhi is comfortably versed in data centric research backed by healthcare educational background. She leverages extensive data mining and analytics tools such as Primary and Secondary Research, Statistical Analysis, Machine Learning, Data Modelling. Her key role also involves Technical Sales Support, Client Interaction and Project management within the Healthcare team. Lastly, she showcases extensive affinity towards learning new skills and remain fascinated in implementing them.
Co-Author
Co-Author Profile
Rahul Gotadki LinkedIn
Research Manager
He holds an experience of about 9+ years in Market Research and Business Consulting, working under the spectrum of Life Sciences and Healthcare domains. Rahul conceptualizes and implements a scalable business strategy and provides strategic leadership to the clients. His expertise lies in market estimation, competitive intelligence, pipeline analysis, customer assessment, etc.
Share::
Request Free Sample

Research Approach


Secondary Research

The secondary research process involved comprehensive analysis of regulatory databases, peer-reviewed scientific journals, bioprocessing publications, and authoritative industry organizations. Key sources included the US Food & Drug Administration (FDA), European Medicines Agency (EMA), International Organization for Standardization (ISO), Parenteral Drug Association (PDA), Bio-Process Systems Alliance (BPSA), International Society for Pharmaceutical Engineering (ISPE), American Society of Mechanical Engineers (ASME) BPE Standards, National Institute of Standards and Technology (NIST), National Institutes of Health (NIH), National Center for Biotechnology Information (NCBI/PubMed), US Environmental Protection Agency (EPA), European Commission Directorate-General for Health and Food Safety, World Health Organization (WHO) International Pharmacopoeia, Organisation for Economic Co-operation and Development (OECD) Biotechnology Statistics, and national regulatory authority reports from key biopharmaceutical markets. These sources were used to collect bioprocessing industry statistics, regulatory compliance data, material safety studies, sterilization validation protocols, and market landscape analysis for bag systems, filters, connectors, tubing, and associated single-use technologies across polyethylene, polypropylene, polyvinyl chloride, and thermoplastic elastomer material categories.


Primary Research

In order to gather both qualitative and quantitative insights, supply-side and demand-side stakeholders were interviewed during the primary research process. CEOs, CTOs, VPs of Bioprocessing Operations, heads of regulatory affairs, and commercial directors from producers of single-use assemblies, suppliers of materials, and providers of bioprocessing technology were examples of supply-side sources. Chief Scientific Officers, manufacturing directors, procurement leads, process development directors, and quality assurance managers from pharmaceutical companies, contract manufacturing organizations (CMOs), contract development and manufacturing organizations (CDMOs), biotechnology companies, academic research institutions, and cell and gene therapy developers were examples of demand-side sources. Primary research verified product pipeline timelines, validated market segmentation across biopharmaceutical manufacturing, vaccination, cell culture, and tissue engineering applications, and obtained information on supplier consolidation trends, pricing strategies, technology adoption patterns, and sustainability initiatives.

Primary Respondent Breakdown:

By Designation: C-level Primaries (32%), Director Level (30%), Others (38%)

By Region: North America (32%), Europe (29%), Asia-Pacific (33%), Rest of World (6%)

By End-User Segment: Pharmaceutical & Biotechnology Companies (40%), Contract Manufacturing Organizations (28%), Research Laboratories & Academic Institutions (22%), Cell & Gene Therapy Developers (10%)

By Application Focus: Biopharmaceutical Manufacturing (45%), Vaccination & Viral Production (18%), Cell Culture Operations (22%), Tissue Engineering & Regenerative Medicine (15%)


Market Size Estimation

Global market valuation was derived through revenue mapping and installation base analysis across bioprocessing facilities worldwide. The methodology included:

Identification of 50+ key manufacturers and suppliers across North America, Europe, Asia-Pacific, Latin America, and Middle East & Africa

Product mapping across bag systems, filters, connectors, tubing, and other single-use components categorized by polyethylene, polypropylene, polyvinyl chloride, and thermoplastic elastomer materials

Analysis of reported and modeled annual revenues specific to single-use assembly portfolios, including both standard catalog products and customized configurations

Coverage of manufacturers representing 75-80% of global market share in 2024, encompassing integrated system providers and specialized component suppliers

Extrapolation using bottom-up (bioreactor capacity × single-use intensity factor × ASP by region) and top-down (manufacturer revenue validation) approaches to derive segment-specific valuations across biopharmaceutical manufacturing, vaccination, cell culture, and tissue engineering applications

Validation through triangulation with biopharmaceutical capital expenditure data, capacity expansion announcements, and industry association shipment statistics

This methodology mirrors your original dermal fillers research structure while adapting the sources and breakdown percentages to reflect the bioprocessing and single-use assemblies market landscape.

Share::
Request Free Sample
Download Free Sample

Kindly complete the form below to receive a free sample of this Report

* Please use a valid business email

Share::
Request Free Sample
Download PDF ×

We do not share your information with anyone. However, we may send you emails based on your report interest from time to time. You may contact us at any time to opt-out.
















